Chapter 1. Environmental performance: Trends and recent developments
The Czech Republic has made progress in decoupling environmental pressures from economic activity. However, challenges remain on the path towards green growth and sustainable development. This chapter provides a snapshot of key environmental trends in the Czech Republic since 2000. It presents the main economic and social developments, and reviews the country’s progress in reducing the energy and carbon intensity of its economy, in making the transition to a resource-efficient economy and in managing the natural asset base. The chapter also summarises key policy developments in specific areas, including energy, climate change, air, water and biodiversity.
The statistical data for Israel are supplied by and under the responsibility of the relevant Israeli authorities. The use of such data by the OECD is without prejudice to the status of the Golan Heights, East Jerusalem and Israeli settlements in the West Bank under the terms of international law.
1.1. Introduction
The Czech Republic has a relatively small export-oriented economy that has enjoyed strong economic growth over the past 15 years. However, improvement in the level of GDP per capita stalled after the economic crisis and remains below the OECD average. The country’s reliance on its substantial coal resources, as well as intensive industrial and agricultural activities and growing road traffic, have exacerbated environmental challenges.
This chapter provides an overview of the Czech Republic’s main environmental achievements and its remaining challenges on the path towards green growth and sustainable development. Drawing on indicators from national and international sources, it reviews progress on national policy goals, and on international commitments and targets, focusing on the period since 2000. To the extent possible, it compares the state of the environment and key environmental trends with those of other OECD countries. The chapter sketches out major policy developments in environmental sectors including air, climate, waste, water and biodiversity.
1.1.1. Progress towards the Sustainable Development Goals
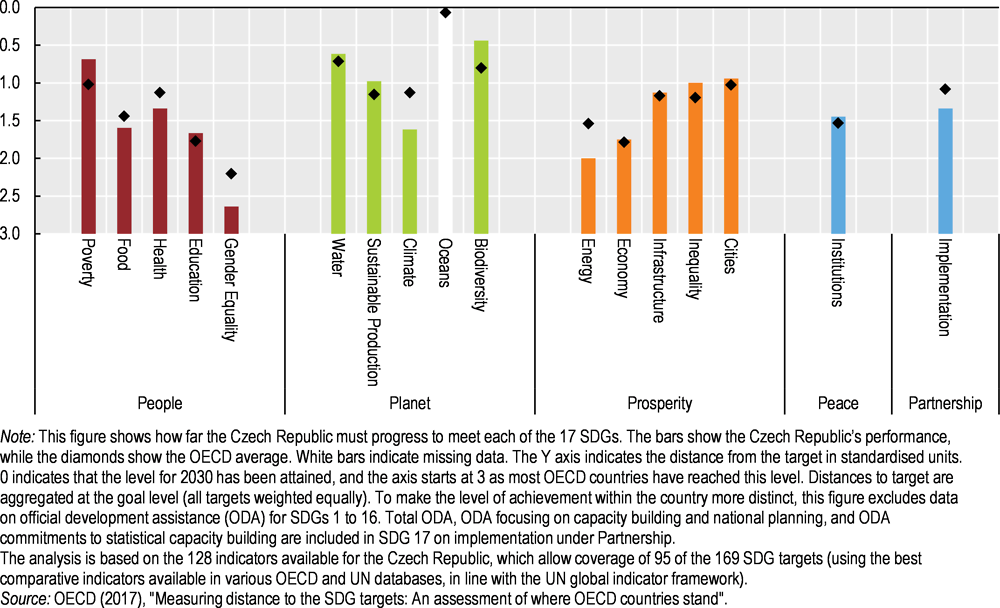
Czech Republic 2030, approved in 2017, is the overarching policy document defining long-term priorities for implementing the 2030 Agenda for Sustainable Development at the national level. It builds on the country’s 2010 Strategic Framework for Sustainable Development and translates the 17 international Sustainable Development Goals (SDGs) into six national priority areas (People and Society, Economy, Resilient Ecosystems, Municipalities and Regions, Global Development and Good Governance) covering 97 of the 169 SDG targets. Czech Republic 2030 includes nearly 200 indicators (compared to 50 in the 2010 framework). For effective communication, the government could consider replicating the French experience by defining a limited set of indicators to inform the budget discussions (OECD, 2017a, 2016a).
The Czech Republic has reached 15 out of 95 targets for which an indicator is available. Relative to the OECD average, it performs well on the goals related to poverty, water and biodiversity. However, it lags on food, health, gender equality, climate, energy and implementation. Poor performance on this last is mostly due to its official development assistance flows being lower than the OECD average (Figure 1.1; OECD 2017a).
1.2. Main economic and social developments
1.2.1. Economic performance
The Czech Republic has a small, open economy. Real GDP rose by about 51% over 2000-16, at a much faster pace than the OECD average of 32%. Economic growth averaged 4.4% annually over 2000-08, driven by opening markets and inflows of foreign investment (OECD, 2016b). With the economic crisis, GDP growth felt by 4.8% in 2009, remaining sluggish until 2013. It picked up in 2015, with the absorption of expiring EU funds, before moderating in 2016. It is expected to remain above 4% for 2017 and 3% for 2018 (Figure 1.2; OECD, 2017b).
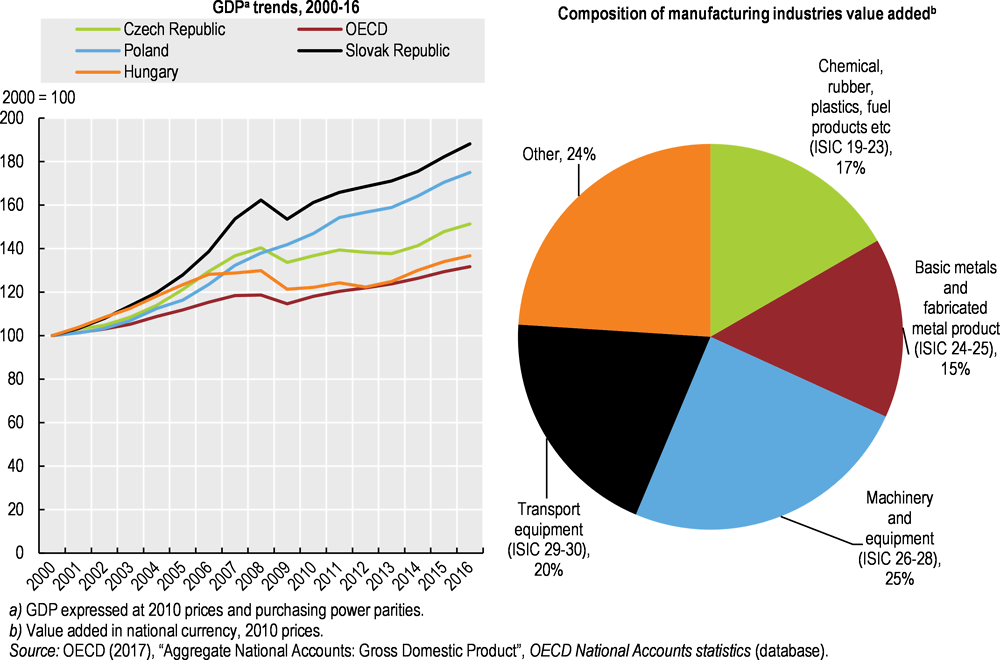
GDP per capita was 64% of the OECD average in 2000; the gap narrowed to 79% in 2008 then mainly stalled, reaching 83% in 2016. By contrast, other countries of Central and Eastern Europe, notably the Slovak Republic and Poland, continued to converge with the OECD level (OECD, 2016b).
The Czech economy relies increasingly heavily on external trade. In 2015, exports accounted for 83% of GDP and imports for 77%, well above the OECD average of 29% for each. The country is one of the most integrated in terms of global value chains, with the import content of its exports (45%) among the highest in the OECD in 2011. About 85% of Czech exports and 68% of imports are in trade with European countries; Germany in particular accounts for a third of Czech exports and a quarter of imports. Country exchanges mainly consist of vehicles, machinery, mechanical appliances and electrical machinery and equipment (Basic Statistics; OECD 2016b, 2015a).
The general government deficit has improved significantly since 2009. In the short term, Czech public finances appear to face little sustainability risk. Income growth and increased tax compliance helped turn the budget deficit into surplus in 2016 (OECD, 2017b). The debt/GDP ratio, at well below 60%, poses no significant risk to fiscal sustainability in the immediate future (Basic statistics).
While public expenditure on education and health is in line with the OECD average, environmental protection expenditure is higher due to investment in wastewater treatment (Chapter 3). Environmentally related tax revenue decreased slightly over 2011-15, from 2.9% to 2.6% of GDP, but remains above the OECD average of 1.6% (Basic statistics).
1.2.2. Structure of the economy and employment
The Czech Republic is among the most industrialised OECD countries. In 2015, industry, including energy and construction, contributed to 38% of total value added, well above the OECD average of 25%. The share of manufacturing industry in value added rose from 17% to 26% over 2000-15, boosted by the increasing contribution of the automotive industry, while the share of more energy-intensive subsectors such as metal, wood and paper products decreased. Services accounted for 60% of total value added and agriculture (2%) for the remainder (Basic statistics).
The unemployment rate has declined since 2000 to a level that put the Czech Republic among the best OECD performers in 2016 (OECD, 2016b; Basic statistics). The labour force participation rate has increased markedly in recent years. Nevertheless, some groups remain significantly under-represented in the labour market – particularly women with small children, youth, the low skilled and disabled people (OECD, 2016b).
1.2.3. Population, regional disparities, well-being and environmental awareness
Most Czechs live in peri-urban areas; regional disparities are low
The Czech Republic covers about 79 000 km². Its population has been slowly increasing over the past decade and reached 10.6 million in 2016. At 135 inhabitants per square kilometre in 2016, population density is above the OECD average, ranging from 71 inhabitants/km² in the Southwest to 2 538 inhabitants/km² in Prague. The Czech Republic is among the least urbanised countries in the OECD: 25% of the population lives in predominantly urban areas (compared to the OECD average of 48%) and more than half lives in intermediate regions owing to suburbanisation over the last decade (Chapter 5; Basic statistics; OECD, 2016c).
The country has improved equality among regions in many areas. Though GDP per capita disparities1 among small regions have risen since 2000, they are below the OECD average (OECD, 2016c). The Northwest is the poorest and least productive part of the country, with the lowest life expectancy at birth and the highest unemployment rate. Traditionally industrial regions such as Moravia-Silesia are catching up to the country’s best performers. Prague remains the largest contributor to GDP (accounting for 25% in 2014) (OECD, 2016c). In terms of living environment, Moravia-Silesia has the highest level of PM2.5 concentrations while the South Bohemian region has the lowest level. Municipal waste generated per person ranges from 355 kg per year in Central Bohemia to 283 kg in the Northeast. The share of population connected to public water supply ranges from 100% in Prague and Moravia-Silesia to 83% in Central Bohemia, and connection to urban sewage treatment plants ranges from 99% in Prague to 71% in the Northeast (OECD, 2017c; Eurostat, 2017a).
Well-being and environmental awareness
The Czech Republic performs well as regards many aspects of well-being,2 scoring above the OECD average on overall personal security, work-life balance, social connections, and education and skills. It is also among the best OECD performers concerning inequality and poverty risk. Overall, inequality and poverty were remarkably low over the past 15 years, even during the crisis. However, the country lags behind the OECD average on income, civic engagement and governance, housing and health (OECD, 2016b).
Public perception of environmental quality is evaluated through surveys, which have been regularly conducted since 2002 by the Public Opinion Research Centre. They cover people’s satisfaction with the environment in the country and in their neighbourhood. Results show that interest in information about the state of the environment in the country dropped by 12 percentage points over the past decade. The surveys also revealed that the higher respondents’ education and income levels were, the higher was their interest in environmental information (CENIA, 2016).
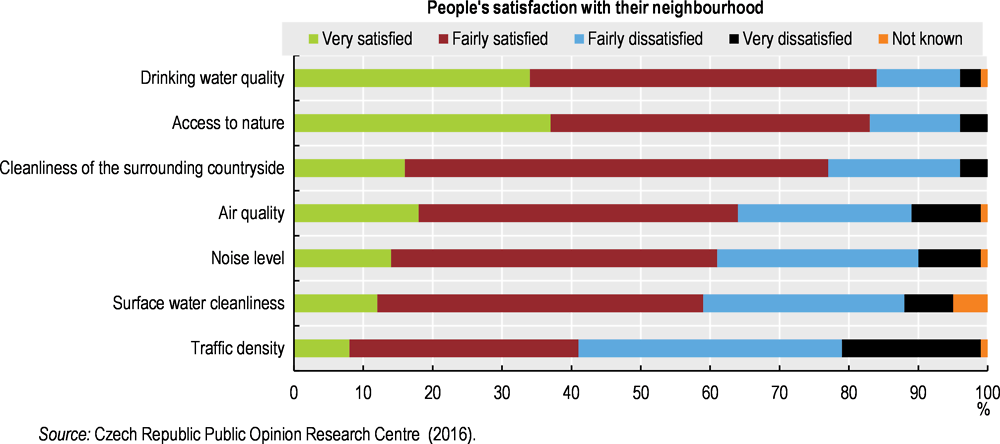
The share of respondents satisfied with the state of the environment in the country increased from 40% in 2002 to 68% in 2016. Satisfaction with neighbourhood environment is generally higher (77%) and, although fluctuating, has remained stable overall (Figure 1.3; CENIA, 2016).
1.3. Transition to an energy-efficient and low-carbon economy
1.3.1. Energy structure, intensity and use
Main policies and measures
The 2015 State Energy Policy (SEP) set a framework and objectives for the sector to ensure a reliable, affordable energy supply that would be sustainable in the long-term. It is complemented by technology-specific and sectoral action plans. Although the SEP reiterates the EU climate target for 2030, it does not commit on energy efficiency and renewable energy resources after 2020, and the long-term commitment on climate is conditional on the country’s financial capacity. Through the SEP, the government does not take real ownership of long-term climate objectives, related EU commitments being presented as external conditions rather than opportunities. Moreover, the SEP claims that CO2 emissions are not a key indicator for the Czech Republic, underestimating the impact of climate change for the country (IEA, 2016a; MIT, 2014).
The SEP emphasises nuclear energy, which benefits from strong public support, to ensure energy security, as well as coal as a key factor for competitiveness. The government aims to diversify the mix of primary energy sources by suggesting wide ranges as targets for each type: thus it sees the share of coal being reduced to between 11% and 17% of total primary energy supply (TPES) by 2040 while that of nuclear energy would rise to between 25% and 33%. For electricity production, coal’s share would be reduced to between 11% and 21% while that of nuclear plants would be raised to between 46% and 58%. The width of these ranges creates uncertainty for investors. In addition, a 2015 decision to lift a restriction on lignite mining sent contradictory signals (IAE, 2016; MIT, 2014).
A shift from coal to nuclear energy
For decades, domestic coal helped the country be less dependent on imported natural gas than many of its neighbours. Four bituminous coal mines and five lignite mines were still in operation in 2016. In 2015, coal accounted for 39% of TPES, the third highest share in the OECD (after Estonia and Poland). More than half of electricity generation comes from coal, which also accounts for 63% of heat output, compared with 24% in the OECD as a whole. Although the contribution of fossil fuels to the energy supply has been declining, they still accounted for three-quarters of the energy mix in 2016. Due to the high carbon content of coal, coupled with the use of other fossil fuels, the average amount of CO2 emitted in electricity generation and heat output in the Czech Republic is above the OECD average (Figure 1.4; OECD, 2016d; IEA, 2017a, 2016).
Coal resource depletion and the objective of decarbonising the economy while securing energy independence led to a shift from coal to nuclear energy, particularly from 2007. The share of nuclear plants in electricity generation grew from 19% in 2000 to 29% in 2016. The SEP and the National Action Plan for Nuclear Energy Development (2015) put nuclear power at the forefront of the national strategy. The government plans to extend the lifetime of the Dukovany plant to 50 or, if possible, 60 years and to add one or two reactors there and at Temelín, its other nuclear plant in operation. This would involve financing about CZK 125 billion to CZK 150 billion (EUR 4.5 billion to EUR 5.4 billion) (IEA, 2016a).

Energy consumption has decreased but energy intensity remains high
Since 2000, industrial energy consumption has decreased steadily while transport consumption increased strongly until 2008 before slowing, then recovering in 2014. In the aftermath of the crisis, energy consumption in the residential, commercial and public service sectors remained broadly stable, with annual variation due to climatic conditions (Figure 1.5).

With considerable reliance on heavy industry, the Czech Republic has one of the most energy-intensive economies in the OECD. Nevertheless, energy intensity declined by 34% between 2000 and 2016, a faster rate than the OECD average of 25%. Improvements were largely attributable to progress in energy efficiency, in particular since 2004, as well as to the industrial restructuring towards less energy-intensive industry (IEA, 2016b; EC, 2016a, 2016b; Figure 1.5). However, the Czech Republic is not on track to achieve its saving targets under the EU Energy Efficiency Directive (2012/27/EU), and the transport sector makes a limited contribution to the goals of the National Energy Efficiency Action Plan (Chapter 3).
Renewable energy sources
The National Renewable Energy Action Plan 2011-20, revised in 2012, laid out policies and measures to reach a national target of a 13% share for renewables in gross final energy consumption by 2020, in line with the relevant EU directive (2009/28/EC). The overall target, which is the fifth lowest among EU countries, is complemented by sectoral ones: 15.5% in heating and cooling, 13.5% in gross final electricity consumption and 10.8% in transport final consumption (IEA, 2016a; MIT, 2012). The SEP aims to raise the share of renewables to between 17% and 22% of TPES by 2040, and to between 18% and 25% in electricity generation (IEA, 2016a; MIT, 2014). It envisages achieving this objective principally by developing cultivated biomass so as to maximise the use of domestic, competitive sources.
In 2015, the Czech Republic had already exceeded its 2020 target on gross final consumption with a renewables share of 15%. However, like most EU countries, it was still far from the target on transport. Biofuels represented only 5% of transport energy consumption in 2015: biodiesel accounted for most of it (79%), the remainder being bioethanol (IEA, 2017b).
Over the last 16 years, renewables have almost tripled in the energy supply and quadrupled in electricity production. Their share of TPES was 10% in 2016, in line with the OECD average. Renewables generated 11% of electricity, the fourth lowest share in the OECD. The share is unlikely to rise in the medium term, as support mechanisms for renewables were eliminated (IEA, 2017b, 2016).
In 2016, solid biofuels and waste were the main component of renewable supply (90%), followed by solar and wind power (6%) and hydropower (4%). Coal boilers for space heating are gradually being replaced by biomass boilers, which drive biofuel and waste consumption in households and commercial buildings. Biofuels and waste are used in industry for space heating; the pulp and paper industry also uses them in production processes. Biofuels are used in manufacturing processes and in transport as well. Wind, hydro and solar energy are used in electricity generation, while most solar power is found in the residential sector (IEA, 2017b, 2016).
Renewables in electricity generation are solid biofuels and waste (51%), solar and wind power (29%) and hydropower (21%) (IEA, 2017b).
1.3.2. Road is the predominant transport mode
The transport sector is the second highest greenhouse gas (GHG) emitter. It is also one of the fastest-growing sources of GHG emissions and energy consumption. As in many countries, road transport accounts for most energy consumed in the sector (95% in 2015) (IEA, 2017).
The share of road in passenger transport remains predominant, accounting for 84% of total passenger transport volume in 2016. The most used transport mode is private cars (61%), followed by urban public transport (15%), air (9%), intercity bus (9%) and rail (7%). The share of private cars remained stable over 2000-09 but increased by two percentage points between 2010 and 2016 (MOT, 2017).
Motor vehicle ownership increased from 45 to 61 vehicles per 100 inhabitants between 2000 and 2015, but remains below the OECD average. The number of vehicles rose with growth in the economy and income: passenger car registrations doubled over 2004-16. The number of new cars (less than two years old) more than doubled, while that of cars older than five years jumped by about 60%. Old cars (over ten years) account for 61% of the vehicle fleet and cars aged between five and ten years represent 19% (Figure 1.6). The share of diesel in road fuel consumption grew from 46% in 2000 to 66% in 2015, while that of petrol decreased from 51% to 27%. Other motor fuel sources, such as electricity and liquefied petroleum gas, are barely developed (MOT, 2017).
Inland freight transport rose by 30% over 2000-15, driven by strong growth in road transport (+50%), before slowing down (-11%) in 2016.The share of road in total freight transport was 74% in 2016, up by eight percentage points from 2000. The increase was at the expense of rail, whose share fell from 30% to 23%. While the truck fleet is slightly younger than the passenger car fleet, vehicles older than ten years account for 46% and the share of the fleet older than five years is about 80% (Figure 1.6).

1.3.3. Greenhouse gas emissions
Main policies and measures
The climate policy framework has been improved. The 2017 Climate Protection Policy replaced the 2004 National Programme to Abate Climate Change Impact (MoE, 2017a). The new document sets 2020 and 2030 emission reduction targets3 and indicative long-term objectives for 2050, in line with EU commitments. It complements the 2015 Climate Change Adaptation Strategy. However, the Czech Republic has generally not played an active role in climate policy, attempting, with other Visegrád countries,4 to weaken EU ambitions (Dostál, 2014). It was the last EU member to ratify the Paris Agreement, in October 2017.
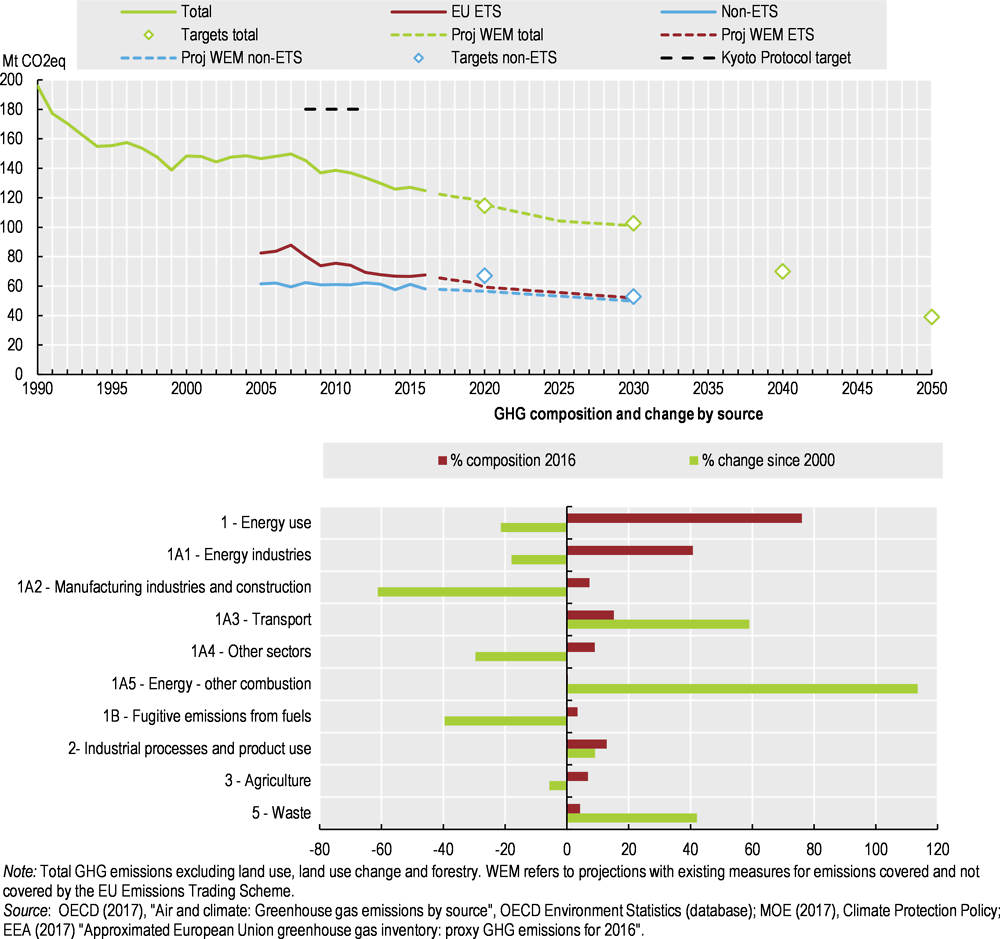
The Czech Republic surpassed its Kyoto target of reducing GHG emissions by 8% over 2008-12, achieving a 30% reduction below 1990 levels (Figure 1.8). The government projects that the country is on track to reach the 2020 and 2030 objectives. However, its forecasts include strong assumptions regarding progress in carbon pricing and energy savings which have yet to materialise in a context of economic recovery and the significant increase in GHG emissions from road transport. While plans call for the Climate Protection Policy to be evaluated every five years, the country must develop integrated national energy and climate plans by early 2019 to be on track to meet the EU climate and energy targets for 2030. Scenarios developed to meet the 80% emission reduction objective for 2050 (high electricity and biomass imports, massive development of carbon capture and storage, and higher development of renewables and nuclear energy) assume large energy savings and necessitate adapting the optimised scenario in the SEP (MoE, 2017a).
In 2016, 349 Czech stationary installations and 5 aviation operators participated in the EU Emissions Trading System (EU ETS), representing slightly more than half the country’s GHG emissions. EU ETS-covered emissions decreased by 18% between 2005 and 2016 (EEA, 2017a; Figure 1.7). An EU-wide cap is in place to reduce emissions in the covered sectors by 21% from the 2005 level by 2020 and by 43% by 2030.
Emissions in sectors not covered by the EU ETS (such as transport other than aviation, buildings, agriculture and waste management) decreased by 5.4% between 2005 and 2016, putting the Czech Republic on track to limit the related emission increase to 9% by 2020 under the EU 2020 climate and energy package. The European Commission proposed a 14% reduction objective for the Czech Republic by 2030 (EC, 2017a).
GHG emissions and intensities have declined
Total GHG emissions5 declined by 16% between 2000 and 2016, after having decreased by 24% in the 1990s due to industrial restructuring and technological updates amid the transition to a market-based economy. GHG emissions were little changed over 2000-07 but dropped by 16% in 2007-14 because of the economic crisis and the decline of fossil fuels in the energy mix. However, emissions started to increase again in 2015 before slowing down in 2016 (Figure 1.7). As in most countries, CO2 accounts for the bulk of emissions (82%), followed by methane, which represents 11% despite declines in coal mining and livestock numbers. Nitrous oxide (5%) and hydrofluorocarbons account for the rest (MoE, 2017d; CENIA, 2016; UNFCCC, 2014).
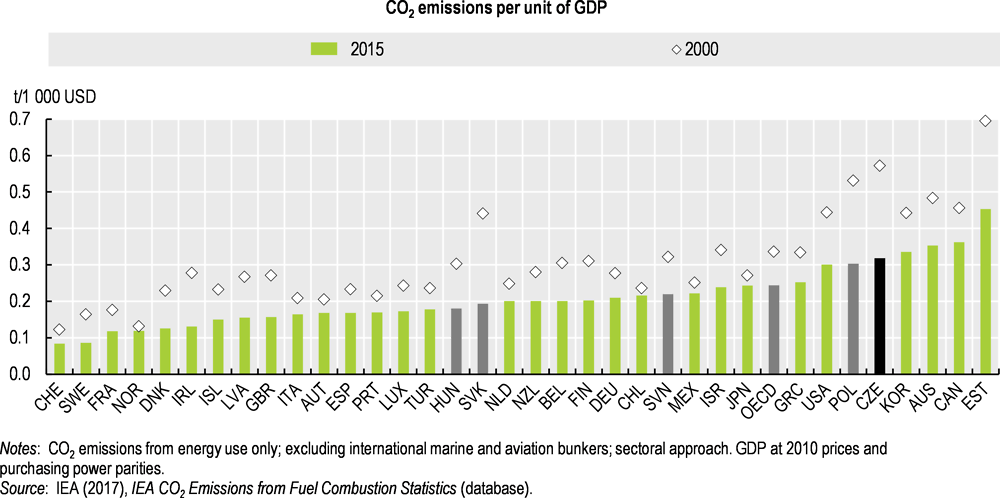
Between 2000 and 2015, the GHG and CO2 emission intensity of the Czech economy declined faster than the OECD average (Figure 1.8). These trends were driven by the decrease in energy intensity of the economy and the lower share of coal in the energy mix. However, the Czech Republic remains one of the most carbon-intensive economies in the OECD, due to the predominance of heavy industries and of coal in the energy mix (Figure 1.8). In this context, the country set the objective to reduce its GHG emissions per capita by 2020 to at least the average of the EU-27 in 2005, meaning a 25% reduction of the intensity per capita, compared to the 2005 level. The country seems on track for meeting its objective as GHG emissions per capita have already decreased by 16% between 2005 and 2015. The level of GHG emissions per capita of 12 tonnes of CO2 eq is nonetheless above the EU average of 9 tonnes (Eurostat, 2017c).
Energy use produces 76% of GHG emissions, in power generation (41%), transport (15%), manufacturing and construction (7%), and other sectors and fugitive emissions from fuels (13%). Since 2000, emissions from energy industries have declined, mainly due to the decreasing share of fossil fuels in the energy mix and to gains in energy efficiency. The drop in emissions from manufacturing and construction was mainly driven by the industrial restructuring and the adoption of more efficient technology, accentuated by the crisis. The decrease in emissions from heating in households and commercial buildings was driven by a shift in heating fuels from coal to natural gas and renewables, more efficient heating technology and, more recently, energy savings from improved performance in buildings. However, emissions from transport increased by nearly 60%, reflecting growing volume and the increasing predominance of road (Figure 1.7; Section 3.2).
Non-energy use includes industrial processes (mainly mineral, metal and chemical production), which are responsible for 13% of total emissions, followed by agriculture (7%) and waste management (4%). Improved technology and a decline in livestock numbers were the main drivers for the reduction of GHG emissions from agriculture. Emissions from waste management increased by 42%. Meanwhile, land use, land use change and forestry, which act as a net sink in the Czech Republic, increased to reach 6.6 Mt CO2 eq in 2015 (MoE, 2017d; CENIA, 2016; Figure 1.7; Section 3.2, Chapter 3).
Climate change outlook
Even though the Czech Republic is not among the countries most affected by climate change, its impact on the environment is already visible and expected to increase. The average annual temperature rose by about 0.3°C in 15 years and the number of days with extreme weather or temperatures grew significantly. It is estimated that by 2050, the average annual temperature will be 2.2°C higher than in 1961-90. Precipitation patterns are changing, with storms and floods alternating with more droughts. Average flow in river basins is expected to decrease, leading to recurring water deficits, as well as changes in surface water quality. Agriculture will be affected by reductions in plant and fodder production and in genetic diversity and soil fertility, as well as by soil erosion and a combination of longer growing seasons and less moisture, leading to lower yields. Ecosystems will be disturbed by an increasing number of endangered species and invasive non-indigenous species, as well as a decline in biodiversity and changes in habitats. Forests will undergo an altitude shift of many tree species and deterioration of health and stability of tree stands. The many other areas in which climate change effects are expected include human health and quality of life, transports systems, and tourism and recreation (CENIA, 2016; MoE, 2015).
The Czech Republic adopted a Climate Change Adaptation Strategy in 2015 and related action plan in 2017. Measures are proposed in ten sectors, with priority given to water management, agriculture, forestry and health. Particular attention is paid to flood risk prevention and improvement in the state of nature and landscape (MoE, 2015; EEA, 2017b; UNFCCC, 2014).
1.3.4. Atmospheric emissions and air quality
Main policies and measures
The 2013 EU Clean Air Policy Package set new objectives for 2030 and revised the National Emission Ceilings (NEC) Directive (2016/2284/EU6) in line with the revised Gothenburg Protocol to the Convention on Long-range Transboundary Air Pollution. The new directive establishes national emission reduction commitments applicable from 2020 and stricter targets from 2030 for nitrogen oxides (NOx), non-methane volatile organic compounds (NMVOCs), sulphur dioxide (SO2), ammonia (NH3) and fine particulate matter (PM2.5).
The Czech Republic met the 2010 targets for NOx, NMVOCs, SO2 and NH3 under the old NEC Directive. The State Environmental Policy 2012–20, the 2014-20 Operational Programme “Environment”, the 2015 National Emission Reduction Programme and the Medium-term Strategy to Improve Air Quality up to 2020 transposed targets set in directives and set priorities and measures to reduce emissions and improve air quality (MoE, 2017d; CENIA, 2016).
Emissions and intensity levels have decreased
Since 2000, emissions from all major air pollutants have decreased in absolute terms and therefore have been decoupled from economic growth. However, SOx intensity (per unit of GDP), although declining, remains above the OECD average and those for nearby countries. NOx emissions have dropped since 2000 to an intensity level slightly below the OECD average but above those of most European countries (Figure 1.9).

The reduction in production levels at power stations and in manufacturing during the economic crisis was one of the main drivers of the emission declines for all pollutants. Other important factors were stricter regulation, the decline in fossil fuels in the electricity mix, desulphurisation of coal-fired power plants and the use of low-sulphur fuels. Coal consumption in residential heating fell over 2002-07, replaced by increasingly popular firewood, leading to lower particulate and SOx emissions. Since 2009, thermal insulation has increasingly been installed on buildings and high-emission heating has been replaced by more efficient technology, subsidised through the Green Savings Programme. So far, however, the measures have had marginal effect on total emissions. The reduction in NOx emissions from transport resulted from a slow but gradual modernisation of the vehicle fleet (CHI, 2016).
NH3 emissions in 2015 were mainly from agriculture (67%), especially livestock and nitrogen mineral fertiliser use. The decrease in livestock, especially swine, led to an 18% reduction in NH3 emissions (Figure 1.9).
Air quality
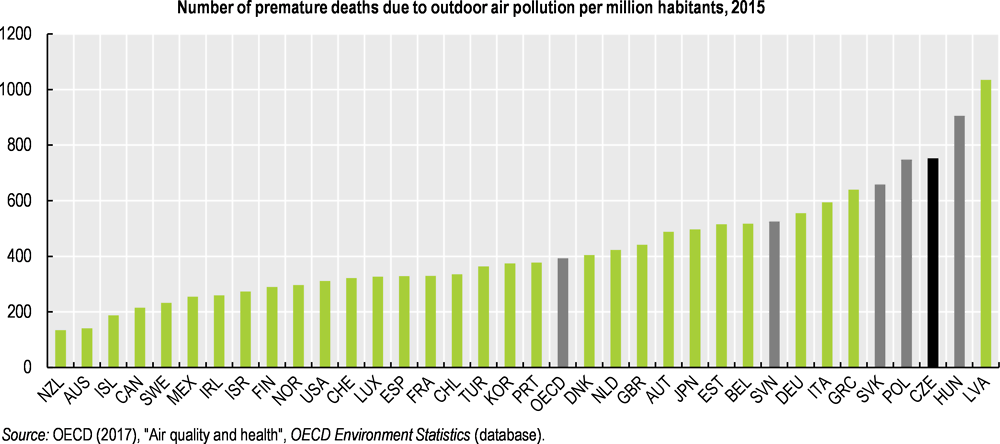
The Czech population is among the most affected by outdoor air pollution in the OECD. The cost of the 7 926 premature deaths due to outdoor air pollution in 2015 is estimated at 7% of GDP, above the 4% average for OECD Europe. Compared to 2005, this represented a 5% rise in premature deaths, and a 24% increase in the associated cost. Although mean population exposure to PM2.5 concentrations declined by 4% over 2000-15,7 the level remains above the OECD and OECD Europe averages (Figure 1.10).
Despite the steady emission decline since 2000, pollutant concentrations, particularly of PM, benzo(a)pyrene and ozone, are still increasing in areas where deterioration already existed. In 2016, EU limit values for PM10, PM2.5, benzo(a)pyrene and ozone were repeatedly exceeded. NO2 limit values were also exceeded at four traffic-loaded locations in Prague and Brno (CHI, 2017). In 2016, the average duration of smog episodes due to high PM10 concentrations was 16 days, down slightly from 2014. The Moravian-Silesian and Olomouc regions were the most affected by PM10 concentrations, while the Karlovy Vary and Ústí nad Labem regions, the Prague agglomeration and the Central Bohemia region were the most affected by ozone. The major sources are fossil fuel combustion in local furnaces, transport, and coke and iron production, as well as tyre abrasion and particulate resuspension. The Moravian-Silesian region is also affected by transboundary air pollution at the Polish border. Meteorological conditions also significantly influence the level of concentration (CENIA, 2016).
1.4. Transition to a resource-efficient economy
1.4.1. Material consumption
Since 2000, material productivity8 has increased by 72%. Domestic material consumption (DMC)9 decreased by 12% over 2000-16: it rose by 8% between 2000 and 2007, then fell by 15% in the years after the crisis (2007-10) and has since remained relatively stable. GDP grew by 51% over 2000-16, which resulted in an overall improvement in material productivity (Figure 1.11). Per capita DMC remains above the OECD Europe average but below that of the OECD.
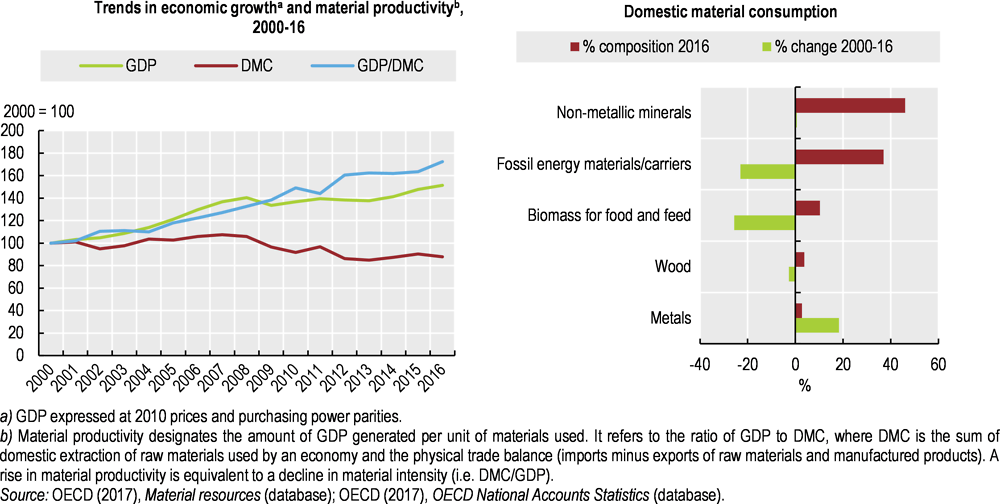
The Czech Republic relies increasingly on imports, especially of oil, gas and metal minerals. Imports accounted for 47% of DMC in 2016, compared to 26% in 2000. The country is self-sufficient in biomass and construction minerals (OECD, 2017e; CENIA, 2016). As in most countries, construction minerals are the most consumed group of materials, followed by fossil fuels, biomass for food and feed, wood, metals and other non-metallic minerals. Consumption of construction minerals has remained relatively stable since 2000 but is expected to have risen in 2015 due to increased construction of railway infrastructure. Consumption of fossil energy carriers materials dropped, mainly on the reduction of coal in the energy mix (Figure 1.11; CENIA, 2016).
1.4.2. Waste management
Waste by sector
The Czech Republic generated about 26 million tonnes of waste in 2016, or 2 427 kg per capita. Total waste generated decreased by 8% between 2008 and 2014 due to the slowdown of construction after the crisis, but jumped by 13% in 2015 due to a rebound in the sector. As in many countries, the construction sector is responsible for the largest share (39%) of waste generated, followed by manufacturing (18%), particularly of computers, electronic and electrical equipment, motor vehicles and other transport equipment, and manufacture of basic metals. Municipal waste accounts for 14%; water supply, sewerage and waste treatment for 14%; other economic sectors for 11%; and energy production for 4%. In 2014, material recovery accounted for 77% of waste treatment, 38% of it being used for backfill. Energy recovery represented 5% of total treatment and landfill 17%.
Municipal waste
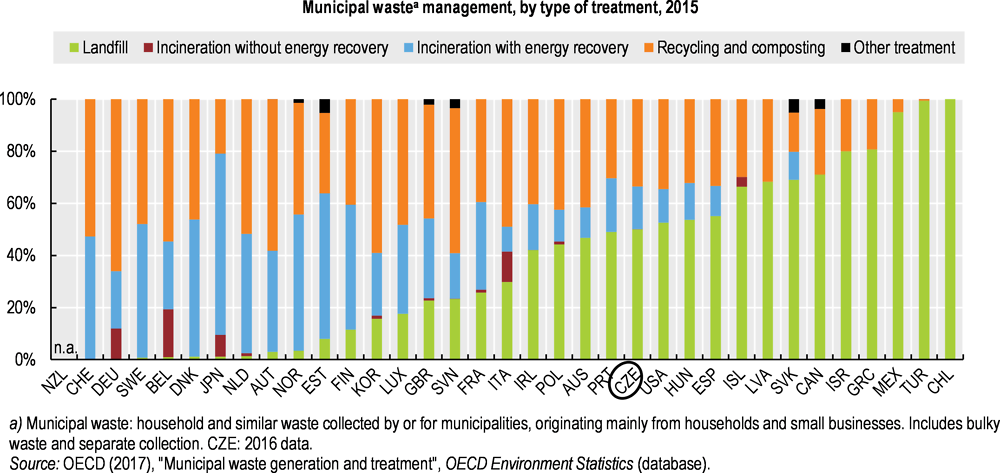
Municipal waste generation increased by 26% between 2004 and 2016, at about the same pace as final private consumption. Per capita municipal waste generation amounted to 337 kg in 2016, but remains much lower than the OECD average of 520 kg and the OECD Europe average of 479 kg. The share of municipal waste sent to landfill decreased by 27 percentage points but still amounted to half of municipal waste treated in 2016. In the meantime, the share of material recovery10 rose from 6% to 34%. Recovery rates in the Czech Republic remain slightly behind those of other OECD countries, where the average share of material recovery accounts for 35% of municipal waste treatment and landfill for 43%. In 2016, only 27% of municipal waste was recycled; the Czech Republic needs much more investment to reach the 2020 EU recycling target11 of 50% (Figure 1.12; EC, 2017b).
The ban on landfilling of recyclable, recoverable and unsorted mixed municipal waste will be difficult to implement in 2024 without adoption of the new Waste Act, which also provides for increasing the landfill tax. In addition, wide discrepancies between the Ministry of the Environment data used in the national Waste Management Plan 2015-24 and the official Czech Statistical Office (CZSO) data used for international reporting hamper assessment of performance. The new Waste Management Plan, envisaging increasing waste to energy capacity to 18% by 2020 and 28% by 2024, claims that only 11% of waste is now incinerated while the CZSO says almost 20% of municipal waste was incinerated in 2014 (Chapter 4; EC 2017c).
Hazardous waste
Since 2005, hazardous waste generation has decreased by 19%; it accounted for 4% of total waste generated in 2016. The largest share, 51%, is chemical and medical waste, followed by mineral and solidified waste (41%), mixed ordinary waste (6%), equipment (2%) and recyclable waste (1%). In 2014, 37% of hazardous waste was recovered, 36% was backfilled, 12% was incinerated (of which 70% with energy recovery) and 6% was landfilled (Eurostat, 2017d).
1.4.3. Chemicals management
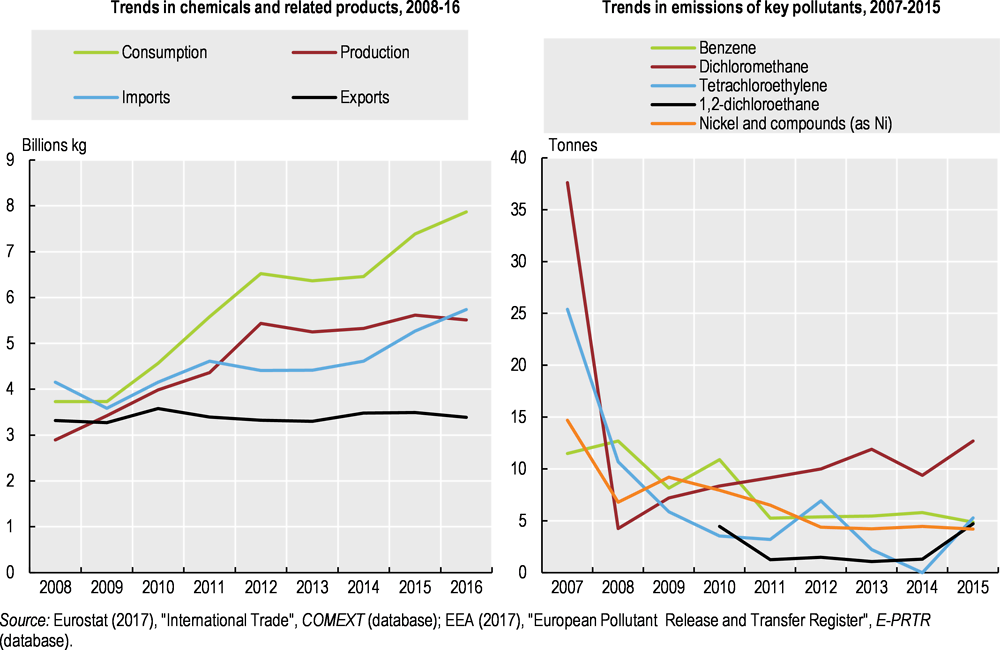
Chemicals consumption doubled between 2008 and 2016, with increase in both production and imports, but thanks to compliance efforts, the release of key pollutants has declined markedly (Figure 1.13). In 2015, manufacture of chemicals and chemical products accounted for 2.4% of employment and 3.6% of value added in manufacturing (OECD, 2017f).
A robust environmental health monitoring system has shown that blood levels of lead and mercury, PCB levels in breast milk and exposure to occupational health hazards have been reduced (NIPH, 2015). Nevertheless, the number of emergencies involving leaks of hazardous chemicals requiring intervention by fire brigade units increased from 5 300 in 2010 to 6 693 in 2015 (CZSO, 2016).
The Czech Republic is a party to the international treaties on chemicals and waste, and hosts the Stockholm Convention Regional Centre. The country complies with the EU Regulation on Registration, Evaluation, Authorisation and Restriction of Chemicals (REACH), as well as the European Classification, Labelling and Packaging (CLP) Regulation and other chemicals-related EU legislation. The number of annual REACH and CLP inspections rose between 2010 and 2014 and the inspection plan was broadened (EC, 2016c). However, ensuring sufficient human and financial resources for enforcement and other enabling activities is a challenge.
1.4.4. Agriculture
Agricultural inputs and pesticides
Agriculture accounts for about 2.5% of GDP and employment, and agricultural land covers more than half the territory. Large farms cover 70% of the agricultural area and small farms (89% of farms by number) account for the remaining 30%. The real net value of agricultural production was stable over the review period, as was the area devoted to agriculture. Since 2000, there has been a slight shift to permanent grassland and meadows, driven by implementation of the EU Common Agricultural Policy (CAP) and the EU milk crisis. Output was stable: while cereal production increased by 38%, other crops by 14% and food production by 5%, livestock production fell by 12% and non-food output by 55% (FAO, 2017; CENIA, 2016).
Since 2000, nitrogen surpluses have decreased12 by 6%. However, consumption of mineral nitrogen per hectare, which accounts for 83% of mineral fertiliser consumption, increased by 70% between 2000 and 2015:13 it was particularly high in 2015 due to extreme drought. Phosphorus surpluses, meanwhile, decreased both in absolute tonnes (by 125%) and in terms of nutrient surpluses per hectare of agricultural land (by 140%); the phosphorus balance has been negative since 2008 (OECD, 2017d; EC, 2015; CENIA, 2016).
Pesticide consumption remained below that of most OECD countries despite increasing by 13% over 2000-15: it fluctuated but generally increased until 2012 (by 33%), then decreased by 15% with the implementation of the National Action Plan to Reduce the Use of Pesticides. Adopting measurable targets would help tracking progress in reducing the risk and impact of pesticide use on human health and the environment (EC, 2017c). Herbicides accounted for the largest share (45%), followed by fungicides (28%), growth regulators (14%), plant protection products (8%) and insecticides (5%) (OECD, 2017d; CENIA, 2016).
In addition to pesticide use, agricultural land is polluted by past and present industry contamination from chemical incidents and leakage of contaminated water, waste discharges directly to the soil, leaching from contaminated sites, landfills, etc. As a result, limit values in soil are repeatedly exceeded for the polycyclic aromatic hydrocarbons chrysene and fluoranthene, and there is a high degree of persistence of chlorinated pesticides in soil. Concentrations of arsenic, cadmium, chromium and nickel in soil are also above limit values (CENIA, 2016).
Agriculture is a major source of diffuse pollution in both surface water bodies and ground reservoirs. It is mainly due to runoff from sprays, plant protection products and fertilisers, exacerbated by unsuitable crop composition, soil processing that increases erosion risk, compaction of the subtopsoil layer, etc. Such pollution is not monitored even though its effects on water quality are significant (CENIA, 2016).
Main policies and measures and organic farming
Environmental considerations have gradually been integrated into the CAP. The 2014-20 CAP enhances the policy framework for sustainable management of natural resources, addresses climate change mitigation and reinforces the resilience of farming. EU countries need to comply with basic environmental requirements to receive full funding, in addition to which they receive financial support as a "green payment" per hectare. They must also allocate part of their budget to measures beneficial to the environment in rural development programmes (RDPs); examples include agro-environment-climate measures and organic farming. The Czech RDP focuses mainly on ensuring sustainable natural resource management and encouraging climate-friendly farming practices while increasing competitiveness in agriculture, forestry and the food industry (EC, 2015).
The share of land under organic farming tripled over 2000-11, then stalled; it accounted for 12% of the agricultural area in 2015. Implementation of the 2016-20 Action Plan for Development of Organic Farming aims to revive the positive trend and ensure that organic agriculture is a stable market by 2020. It follows two earlier organic farming action plans (2004-10 and 2011-15), each of which strengthened targets previously set for total land area under organic farming (10% of the agricultural area by 2010, which was met, and 15% by 2015, which was not). The growth of organic farming has largely been supported by subsidies paid within agro-environmental measures as defined in the RDP. Organic farmers received support either as payments per land area under organic management or in the form of a preferential points allowance according to investment projects. As about two-thirds of subsidies are allocated to livestock production, permanent grassland constitutes most of the land under organic farming (82%). The domestic organic food market remains underdeveloped, accounting for only 0.7% of food and beverage consumption in 2014, with most production exported (CENIA, 2016).
Close to half the agricultural land is potentially threatened14 by water erosion and 11% is extremely threatened. Similarly, 18% of agricultural land is exposed to wind erosion, including 3% of the most vulnerable agricultural soil. This is principally due to intensive agricultural practices, such as large-scale unification of plots, monocultures, removal of landscape elements, lack of grass-covered belts or terraces, land management that disregards the slope of the land and growth of crops potentially vulnerable to erosion, e.g. maize. Heavily eroded soil can, on average, reduce yields by up to 75% and cut land prices by half. In the long term, the biggest problem is soil loss in the areas with the highest soil quality, around the Elbe and in Moravian valleys. The EU Nitrates Directive (91/676/EEC), addressing pollution from agricultural activities, is being implemented. The European Soil Thematic Strategy also aims at preventing soil degradation and preserving soil as an important carbon pool (CENIA, 2016).
1.5. Managing the natural asset base
1.5.1. Physical context and land use
The Czech Republic is medium-sized by European standards, at 78 867 km2. Arable and crop land occupy 42% of the total area, followed by forest (35%), meadows and pasture (13%) and built-up and other land (11%).
Over 2000-15, the surface of mining areas decreased while transport infrastructure and public green areas increased, resulting overall in a relatively stable (+4%) surface of built-up and other areas. The take of agricultural land for road infrastructure accelerated in the early 2000s, peaking in 2008. It decreased after the crisis despite a rebound in 2013.
A major consequence of increasing urbanisation and transport infrastructure is landscape and habitat fragmentation. Between 2000 and 2010, the surface of unfragmented landscape decreased by about 7%, to 63% of the total area. Projections indicate such areas will cover only 53% of the total by 2040 (CENIA, 2016).
1.5.2. Biodiversity and ecosystems
Protected areas and Natura 2000 ecological network
Nature and landscape protection is regulated by national and EU legislation. The 1992 Act on Nature and Landscape Protection defines six national categories of specially protected areas. As of 2016, 4 national parks and 26 protected landscapes and small areas (categorised as national nature reserves, national nature monuments, nature reserves and nature monuments) cover 17% of the territory. Protection is largely aimed at conservation or improvement of the state of a site (MoE, 2016; CENIA, 2016).
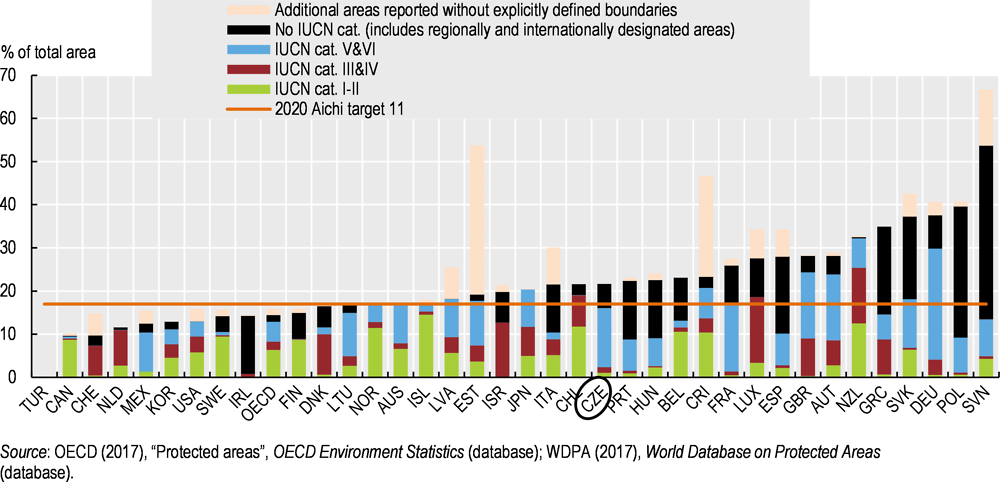
In 2016, national and international protected areas covered 22% of the territory, above the OECD average of 14% and Aichi target 11 for 202015 of 17%. This represents an increase of 39% since 2000. In terms of the International Union for Conservation of Nature (IUCN) categories, protected landscape and protected areas with sustainable use of natural resources (IUCN categories V and VI) were the most widespread designations, totalling 14%. Natural monuments and habitat/species management areas (IUCN categories III and IV) together account for 1% and strict nature reserves, wilderness areas and national parks (IUCN categories I and II) for a further 1%. National (no IUCN category), regional and international designations account for 5% (Figure 1.14).
In 2016, Natura 2000 sites covered 14% of the Czech Republic, below the EU average of about 18%. Under the Habitats Directive, EU countries submit lists of proposed Sites of Community Importance (SCIs), then designate them as Special Areas of Conservation. Special Protected Areas (SPAs) are defined in the 1979 Birds Directive, amended in 2009. Many Natura 2000 sites overlap with nationally designated protected areas. The country had 1 153 Natura 2000 sites at the end of 2016: SPAs covered 9% of the territory, below the EU average of 12%, while SCIs accounted for 10%, below the EU average of 14%. The European Commission has assessed the species and habitat types in the Habitats Directive as insufficiently represented in the Czech Republic and says further areas need to be designated to complete the network. An infringement procedure was initiated in February 2016 (EC, 2017b, 2017d; CENIA, 2016). In response, in 2016, 51 new SCIs were proposed and target feature were added to 70 existing sites (MoE, 2017d).
Under the Habitats Directive, countries must survey and report every six years on habitat and species conservation status. The state of natural habitats of community interest (i.e. those that are in danger of disappearing, have a small natural range or present outstanding characteristics and are of European importance) has improved since 2000-06 but remains poor. In 2007-12, 83% of habitats had "unfavourable-bad" or "unfavourable-inadequate" status, with only 16% deemed "favourable". Most natural and near-natural habitats are in areas with limited or less intensive agricultural production (EC, 2017b). Small coastal and halophytic habitats and forests are the most damaged, while heathlands and temperate zone shrubs are in the most favourable conditions. The state of forests, rocky habitats and caves, and natural and semi-natural grassland formations also improved. However, these positive trends are partly due to improvement in information, data collection and methodology rather than active measures (CENIA, 2016). The quality of habitats is deteriorating, for example, through eutrophication, air and water pollution, and intensification in agriculture, forest management and fish farming.
Threatened species and bird species abundance
The Czech Republic has a relatively wide range of animal and plant species and habitats thanks to its location at the intersection of four bio-geographical subprovinces (Hercynian, Polonian, Western Carpathian and North Pannonian) and its geological diversity. Nearly 80 000 species have been recorded on its territory. Most of the vascular plant species are native or introduced before the 15th century. There are also 886 bryophytes, 1 500 lichens and up to 40 000 fungi species recorded. Over 24 000 insects, about 8 000 other invertebrates and 711 vertebrates species have been also documented (MoE, 2014).
About one-third of species are categorised in the Czech red list as vulnerable and hundreds have disappeared. The shares of threatened mammal and invertebrate species are relatively close to the OECD average, but many others are in greater danger of extinction: 62% of reptile, 59% of amphibian, 53% of bird, 42% of freshwater fish and 33% of vascular plant and moss species are considered threatened. The most endangered species are found in natural watercourses, associated with old and decaying wood, or, most notably, tied to a mosaic of landscape elements (butterflies, amphibians and reptiles) (OECD, 2017e; CENIA, 2016).
Species are increasingly threatened by intensive agriculture, introduction of invasive alien species and loss of semi-natural biotopes to landscape exploitation. However, the Czech list of specially protected species has barely been updated since 1992 and does not reflect current needs. It includes some species no longer needing protection and excludes some species that most need legal protection. In addition, the statutory framework for species protection tends to focus more on knowledge of species than on knowledge of changes to the quality of their habitats (MoE, 2016).
Over 2007-12, the share of animal species under the Habitats Directive with “favourable” conservation status reached 27.4%, an increase of 7.4 percentage points from 2000-06, while the share of those with “unfavourable-bad” status decreased by 1.5 percentage points, though it was still 34%. The relative improvement was accompanied by a decrease in the number of species with “unknown” conservation status. The number of species with “unfavourable-inadequate” conservation status also fell, but they still accounted for 32.5% (CENIA, 2016).
Overall the state of plant species of community interest has also improved, with a growing number given “favourable” conservation status (from 15% in 2000-06 to 18% in 2007-12) and a declining number rated as “unfavourable-bad” (from 37% to 23%), although more than half of species were still categorised as “unfavourable-inadequate”, compared to 37% in 2000-06. Again, it must be noted that better data collection and methodology affected the assessment (CENIA, 2016). Plants remain threatened by habitat destruction, which has reduced the area covered by native vegetation. Direct removal of plants for medicinal purposes and other forms of destruction are also a threat. The status of numerous species, particularly of those dependent on sites formed and managed by humans in the past, is getting worse (MoE, 2014).
The EU Birds Directive aims to protect 500 wild bird species from habitat fragmentation, intensive agriculture, forestry and pesticide use. Between 1982 and 2015, the populations of common, farmland and woodland bird species in the Czech Republic dropped by 6%, 31% and 17%, respectively. Intensification of agriculture, coupled with abandonment of less fertile agricultural land, was a key driver of farmland birds’ decline in the 1990s. Woodland species have dropped steadily, being gradually replaced by more widespread species, though the causes of the decline have not yet been studied (CENIA, 2016).
Forests
Forests cover 35% of the land area, a slight increase from 34% in 2000. Coniferous forests are predominant (72%) due to past widespread planting of spruce and pine monocultures, which are less resistant to damage from disease and environmental pressure. Forests are among the worst-ranked habitats in the Czech Republic. Intense air pollution loads in past decades resulted in a high level of defoliation compared to other EU countries. Young forest growth is impeded by foraging by excessive numbers of game animals. The country is progressively moving towards a more natural and sustainable forest composition, which would entail the share of coniferous trees further decreasing to 64%, along with birch, elm and alder, and that of other deciduous trees, particularly beech, oak and linden, increasing from 8% to 18% (CENIA, 2016; MoE, 2016).
The country has forest management plans focusing on production in forests that account for 75% of the total forest area (EC, 2017b). The volume of growing stock has increased by 13% since 2000, and forest resource use intensity16 is sustainable, meaning the total production volume is lower in the long term than the mean annual increment. Fluctuations in intensity are mainly due to drought, along with insect infestation and fungal disease on windbreaks (OECD, 2017e; FAO, 2017).
Over 61% of the forest area is owned by the state and 15% by municipalities. Protection regimes cover 15% of the forest area. Sustainable forest management certification programmes, such as the Programme for the Endorsement of Forest Certification and the Forest Stewardship Council, cover a declining share, which peaked at 75% in 2006 then dropped continuously to reach 68% in 2015. The decrease is attributed to the demanding certification process associated with a decline in sales of certified wood products, which consumers often considered too expensive after the crisis (CENIA, 2016).
Main policies and measures
The National Biodiversity Strategy (NBS) defines priorities in sustainable biodiversity use and conservation for 2016-25. Built on a comprehensive evaluation of the previous strategy (2005-15), it is also linked to the State Environmental Policy, the Czech Republic 2030 sustainable development strategy and concept documents across all sectors. The NBS focuses on mainstreaming biodiversity protection into decision making at all administrative levels and aims to maintain a given funding level for biodiversity conservation, nature and landscapes after 2020, when current operational programmes end. A midterm implementation review of the NBS objectives will be prepared in 2020 and an overall evaluation in 2025. The NBS is aligned with international commitments: the EU Biodiversity Strategy 2020, the Convention on Biological Diversity Strategic Plan for Biodiversity to 2020 and its Aichi Biodiversity Targets (MoE, 2016, 2014).
The evaluation of the 2005-15 NBS concluded that 28% of its 161 strategic objectives were achieved, 45% were partially met, 19% were not met and 8% could not be evaluated. These results were attributed to half the objectives being too ambitious or not measurable. Consequently, the updated NBS contains fewer objectives and measures, focusing on essential and achievable priorities. It will be supplemented by more detailed measures and more specific tasks in a 2018 update of the State Nature Conservation and Landscape Protection Programme of 2009.
The NBS contains 20 framework objectives in four priority areas, 68 component objectives and 123 follow-up measures, each associated with an assessment indicator. Most indicators currently available are related to financial resources from the EU structural and investment funds; there are very few indicators to monitor the status and evolution of the state of biodiversity. Developing such comprehensive indicators is an NBS objective (MoE, 2014; NCA, 2009).
1.5.3. Water resource management
Main policies and measures
EU requirements have been an important driver of improvement in water management and quality in EU countries. The Water Framework Directive (WFD) and other water-related directives17 established community-wide objectives to address pollution, promote better use and protection of water and mitigate the impact of floods and droughts.
The Czech Republic prepared river basin management plans (RBMPs) for its river basins to comply with the WFD and has used the national Water Act as the main implementation tool. RBMPs were developed for the Danube, Elbe and Oder and for eight sub-basins. The plans in the initial cycle (2009-15) were gradually approved by early 2010. They outline measures aimed at achieving good status for all water bodies. A second river basin management planning cycle (2016-21), this time covering 10 sub-basins, was approved in 2015.
In terms of water management, the Water Act sets targets for flood protection and sustainable water use in addition to those of the RBMPs. Flood risk management plans, approved in 2015 for the following six years, were developed to address the repeated occurrence of large floods (after a century without such floods). Strategic documents such as the Climate Change Adaptation Strategy and Action Plan are also relevant for water use in a changing climate. In this context, the government in 2014 created a water-drought interdepartmental committee to find effective solutions that could be rapidly implemented to address this emerging issue (MOA, 2016).
The Drinking Water and Bathing Water Directives set water quality standards. The Nitrates Directive protects water resources from nitrate pollution from agricultural sources. The Urban Waste Water Directive addresses collection, treatment and discharge of wastewater. In addition to national legislation transposing these directives, the Czech Republic adopted national and regional development plans for water supply and sewerage systems. The national plan defined objectives to 2015, laid down principles for ensuring the long-term public interest in these areas and synthesised information from the regional plans. The Operational Programme “Environment” (2014-20) also aims to address unregulated pollution discharges (MOA, 2016; CENIA 2016).
The Czech Republic is actively involved in the development of International RBMPs in the International Commission for the Protection of the Elbe (ICPE, 1992), the Danube (ICPDR, 1998) and the Oder (ICPO, 1999). During its presidency of the ICPDR in 2016 it had three main priorities: support implementation of the International Danube River Basin Management Plan and Flood Risk Management Plan, be active concerning floods and droughts, and foster co-operation not only between countries in the region but also through other initiatives, particularly the EU macro-regional strategy for the Danube Region (MoE, 2017c). Basin-wide co-operation and transboundary river basin management issues are dealt with through bilateral commissions with the Slovak Republic, Germany, Austria and Poland.
Water resources
The Czech Republic is landlocked but situated in the watersheds of the North, Baltic and Black seas. As almost all its water flows into neighbouring states, renewable water resources are mainly dependent on precipitation. The country lies in the international basins of the Danube, Elbe and Oder rivers. Watercourses make up more than 30% of the national boundary.
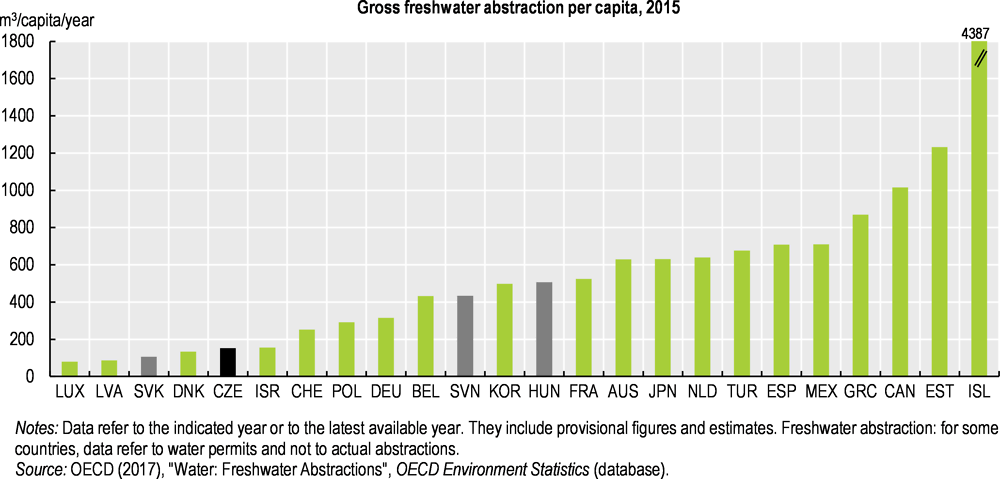
The country has about 1 500 m3 of renewable freshwater resources per capita, the third lowest level in the OECD. However, with only 152 m3 of freshwater abstraction per capita, well below the OECD average of 812 m3, water stress is low. Energy industries account for the largest share (40%), mainly for cooling, followed by public water supply (39%); manufacturing (16%), particularly the food, chemical and paper industries; agriculture (3%); and other (1%). Overall abstraction has declined by 24% since 2003, due to demand reduction from industry and improvements in water use technology, price increases leading to lower households consumption, and reduced water loss in the pipe network. Although room for improvement remains, with losses in the supply system still accounting for 15% of water produced for user consumption in 2016, this is significant progress compared to the 25% lost in 2000 (Figure 1.15; OECD, 2017e; CZSO, 2017; CENIA, 2016).
The largest share of freshwater abstracted (77%) is from surface water bodies, with the remainder from groundwater reservoirs. Most surface water abstraction is for energy, manufacturing and agriculture. As groundwater quality is higher and hence there is less need for treatment to produce drinking water, about half the public water supply comes from groundwater, representing 82% of groundwater abstractions (OECD, 2017e; CENIA, 2016).
Water supply, sanitation and sewage treatment
EU funds helped increase the share of population connected to public sewage treatment plants, which grew from 73% in 2005 to 81% in 2015, in line with the OECD average. The Czech Republic met the Urban Waste Water Directive requirements in terms of collection (Article 3), but not the 2010 objectives on treatment levels. By 2014, 90.5% of wastewater collected underwent secondary treatment (Article 4) and 62.7% of more stringent treatment (Article 5) (MoE, 2017b). Drinking water is of very high quality (the microbiological and chemical conformity rates reach 99.9%).
Water quality
Water quality has improved over the past decade in the context of rising living standards and EU accession. Reduction in quantities of wastewater discharged and increased access to sewage treatment helped improve water quality. Pollutant concentrations in water bodies have decreased. Nevertheless, in the context of the WFD, the status of surface water bodies and groundwater in the Czech Republic is largely unsatisfactory.
Only 19% of surface water bodies met the objective of achieving at least a good ecological status in 2012, while 61% of surface water bodies and 27% of groundwater reservoirs reached good chemical status. The main pressures come from flow regulation and changes in the shape, boundaries and content of water bodies, which affect 67% of surface waters. More than half of water bodies are affected by diffuse source pollution and 44% by point source pollution. The first RBMP presented significant gaps regarding the monitoring system, assessment of pressures and classification methodology for water bodies’ status, resulting in a high level of uncertainty. The European Commission has also cited a lack of transparency in the planning of physical modifications and application of exemptions, and expects the measures taken to have only a marginal impact on water status. Nitrate levels at some of monitoring points remain an issue, as does eutrophication (EC, 2017b; CENIA, 2016).
Reduction in the quantity discharged in the energy sector has contributed to an overall decrease of wastewater discharges since 2010. While wastewater discharges in the energy sector influence water temperature and oxygen regime, municipal wastewater discharges are important point sources of pollution, mainly organic. Industrial wastewater discharges (mainly from the chemical, paper, mining, and food industries) remain another important source of both organic and heavy metal pollution. Agriculture contributes to diffuse pollution in the form of runoff from farmland, which affects both surface water and groundwater quality.
Total concentrations of nitrogen, phosphorus and BOD in watercourses have decreased since 2000, but COD levels remain little changed. Concentrations of pollutants such as halogenated organic compounds, cadmium and thermo-tolerant coliform bacteria have also decreased since 2000. These favourable trends can be attributed to the construction and modernisation of municipal and industrial wastewater treatment plants, as well as to the reduction of phosphates in detergents (CENIA, 2016).
Bathing water quality has generally improved in accordance with the provisions of the Bathing Water Directive (2006/7/EC). As a result, most inland bathing waters (92%) are of at least sufficient quality (EEA, 2017c).
Climate change, air and chemicals management
-
Strengthen political commitment to a low-carbon economy: develop an integrated energy and climate plan to reach the 2030 and 2050 GHG reduction targets, in line with EU climate policy and the Paris Agreement; develop analysis of the economic, environmental and social impact of the underlying scenarios; consider restoring mining limits.
-
Implement the National Adaptation Strategy and complete local strategies in Prague, Brno and Pilsen as a pilot for other cities. Mainstream climate change adaptation into government policies.
-
Implement the National Emission Reduction Programme to comply with standards for protection of human health. Raise awareness of the effects of local air pollution on health.
-
Pursue efforts to monitor chemicals in environmental media and in humans to identify where risk management is required. Allocate sufficient resources for enforcement and other enabling activities under European chemicals legislation (REACH and CLP) to prevent and control chemical pollution. Adopt and implement the 2018-22 National Action Plan to Reduce the Use of Pesticides and assess progress towards targets.
Water and biodiversity
-
Address diffuse pollution from agriculture by reducing the use of fertilisers and pesticides and by speeding up implementation of measures such as information, training, research and funding of environmentally sound agricultural practices. Improve the water quality monitoring system to better measure effectiveness of pollution reduction measures. Develop market opportunities to swiftly achieve the target of 15% of agricultural land under organic farming.
-
Continue to improve information on biodiversity by assessing the extent and values of ecosystem services and promoting the use of these evaluations in policy decisions. Complete the designation of protected areas under the EU Natura 2000 network and ensure their effective management (e.g. by clearly defining conservation objectives and measures and providing adequate resources for their implementation). Consider expanding the national park network to protect the most valuable species and habitats. Prevent habitat fragmentation associated with infrastructure development and develop ecological networks to facilitate wildlife migration.
References
CENIA (2016), 2015 Report on the Environment of the Czech Republic, Czech Environmental Information Agency, Prague.
CHI (2017), Znečištění ovzduší na území České republiky v roce 2016 (Air Pollution in the Czech Republic in 2016), Czech Hydrometeorological Institute, Prague, http://portal.chmi.cz/files/portal/docs/uoco/isko/grafroc/16groc/gr16cz/Obsah_CZ.html.
CHI (2016), “Informative Inventory Report 2014”, Submission under the UNECE Convention on Long-range Transboundary Air Pollution, Czech Hydrometeorological Institute, Prague.
CZSO (2017), “Public water supply systems - Territorial comparison”, Environment (database), Czech Statistical Office, Prague, https://vdb.czso.cz/vdbvo2/faces/en/index.jsf?page=vystup-objekt&pvo=ZPR12&z=T&f=TABULKA&katalog=30842&c=v3~8__RP2016.
CZSO (2016), Statistical Yearbook of the Czech Republic, Czech Statistical Office, Prague, www.czso.cz/csu/czso/statistical-yearbook-of-the-czech-republic-2016.
Dostál, V. (2014), “From Integration to Differentiation: The Czech Republic in the European Union Ten Years On”, DGAPanalyse, No. 9, https://dgap.org/en/article/getFullPDF/25440.
EC (2017a), Climate Action, European Commission website, European Commission, Brussels, https://ec.europa.eu/clima/policies/effort/proposal_en.
EC (2017b), The EU Environmental Implementation Review Country Report: Czech Republic, European Commission, Brussels.
EC (2017c), “Report from the Commission to the European Parliament and the Council on Member State National Action Plans and on progress in the implementation of Directive 2009/128/EC on the sustainable use of pesticides, COM(2017) 587 final”, European Commission, Brussels.
EC (2017d), “Natura 2000: nature and biodiversity”, February newsletter, European Commission, Brussels, http://ec.europa.eu/environment/nature/info/pubs/docs/nat2000newsl/nat41_en.pdf.
EC (2016a), Fourth report on progress achieved towards meeting national energy efficiency targets in the Czech Republic, European Commission, Brussels, https://ec.europa.eu/energy/sites/ener/files/documents/CZ%202016%20Energy%20Efficiency%20Annual%20Report_en.pdf.
EC (2016b), “Decline in energy intensity in the Czech Republic: due to structural change or energy efficiency improvement?”, European Economy Economic Briefs, European Commission, Luxembourg, https://ec.europa.eu/info/sites/info/files/file_import/eb007_en_2.pdf.
EC (2016c), Service contract for technical assistance to review the existing Member State reporting questionnaire under Article 117 REACH, including the evaluation and configuration of an appropriate IT tool for the reporting - Final Report, Ref. Ares(2016)2178823 - 10/05/2016, European Commission, Brussels, http://ec.europa.eu/environment/chemicals/reach/pdf/final_report_2016.pdf.
EC (2015), Factsheet on 2014-2020 Rural Development Programme for the Czech Republic, European Commission, Brussels.
EC (2014), European Commission Assessment of the 2014 national reform programme and convergence programme for Czech Republic, European Commission, Brussels.
EEA (2017a), EU Emissions Trading System (ETS) data viewer, European Environment Agency, Copenhagen, www.eea.europa.eu/data-and-maps/dashboards/emissions-trading-viewer-1.
EEA (2017b), European Climate Adaptation platform, Country Information: Czech Republic, European Environment Agency, Copenhagen, http://climate-adapt.eea.europa.eu/countries-regions/countries/czech-republic.
EEA (2017c), “European bathing water quality in 2016”, European Environment Agency, Copenhagen, www.beaches.ie/wp-content/uploads/2017/06/European-bathing-water-quality-in-2016.pdf.
EEA (2016), “Trends and projections in the Czech Republic 2016” Tracking progress towards EU Member States' climate and energy targets, European Environment Agency, Copenhagen.
EEA (2014), “Air pollution fact sheet 2014: Czech Republic”, European Environment Agency, Copenhagen.
Eurostat (2017a), “Population connected to wastewater collection and treatment systems by NUTS 2 regions”, Water statistics (database), (accessed May 2017).
Eurostat (2017b), “Greenhouse gas emissions in ESD sectors”, Tables by theme, http://ec.europa.eu/eurostat/tgm/table.do?tab=table&init=1&plugin=1&language=en&pcode=t2020_35 (accessed June 2017).
Eurostat (2017c), “Greenhouse gas emissions per capita”, Tables by theme, http://ec.europa.eu/eurostat/tgm/table.do?tab=table&init=1&language=en&pcode=t2020_rd300&plugin=1 (accessed June 2017).
Eurostat (2017d), “Generation of waste by waste category, hazardousness and NACE Rev. 2 activity”, Waste generation and treatment (database), http://ec.europa.eu/eurostat/data/database?p_p_id=NavTreeportletprod_WAR_NavTreeportletprod_INSTANCE_nPqeVbPXRmWQ&p_p_lifecycle=0&p_p_state=normal&p_p_mode=view&p_p_col_id=column-2&p_p_col_count=1 (accessed June 2017).
FAO (2017), FAOSTAT (database), Food and Agriculture Organization of the United Nations, Rome www.fao.org/faostat/en/#home (accessed May 2017).
IEA (2017a), "Emissions per kWh of electricity and heat output", IEA CO2 Emissions from Fuel Combustion Statistics (database), International Energy Agency, https://doi.org/10.1787/data-00432-en (accessed June 2017).
IEA (2017b), "OECD - Renewables balance", IEA Renewables Information Statistics (database), International Energy Agency, Paris, https://doi.org/10.1787/data-00468-en (accessed 24 October 2017).
IEA (2016a), Energy Policies of IEA Countries: Czech Republic 2016, International Energy Agency, Paris, https://doi.org/10.1787/9789264268685-en.
IEA (2016b), “Energy efficiency indicators”, Highlights 2016, International Energy Agency, Paris, www.iea.org/publications/freepublications/publication/EnergyEfficiencyIndicatorsHighlights_2016.pdf.
MIT (2014), State Energy Policy of the Czech Republic, Ministry of Industry and Trade, Prague, www.mpo.cz/assets/dokumenty/52841/60946/636123/priloha001.pdf.
MIT (2012), National Renewable Energy Action Plan of the Czech Republic, Ministry of Industry and Trade, Prague.
MOA (2016), Report on Water Management in the Czech Republic in 2015, Ministry of Agriculture, Prague.
MoE (2017a), Politika ochrany klimatu v ČR (Climate Protection Policy of the Czech Republic, Ministry of the Environment, Prague, www.mzp.cz/C1257458002F0DC7/cz/politika_ochrany_klimatu_2017/$FILE/OEOK-POK-20170329.pdf.
MoE (2017b), Implementation Report on the Urban Waste Water Treatment Directive, 16.02.2017, Ministry of the Environment, Prague.
MoE (2017c), Main website of the Ministry of Environment, Prague, www.mzp.cz/en.
MoE (2017d), “Response to the questionnaire for the OECD Environmental Performance Review of Czech Republic”, Ministry of the Environment, Prague.
MoE (2016), National Biodiversity Strategy of the Czech Republic 2016–2025, Ministry of the Environment, Prague, www.cbd.int/doc/world/cz/cz-nbsap-v2-en.pdf.
MoE (2015), Strategy on Adaptation to Climate Change in the Czech Republic, Ministry of the Environment, Prague, www.mzp.cz/C125750E003B698B/en/strategy_adaptation_climate_change/$FILE/OEOK_Adaptation_strategy_20171003.pdf.
MoE (2014), The Fifth National Report of the Czech Republic to the Convention on Biological Diversity, Ministry of the Environment, Prague. www.cbd.int/doc/world/cz/cz-nr-05-en.pdf.
MOT (2017), Transport yearbook 2016, Ministry of Transport, Zlín.
NIPH (2015), Environmental Health Monitoring System in the Czech Republic, Summary Report: 2015, National Institute of Public Health, Prague, www.szu.cz/uploads/documents/chzp/souhrnna_zprava/Souhrnna_15_CD.pdf.
NCA (2009), State Nature Conservation and Landscape Protection Programme of the Czech Republic, Nature Conservation Agency, Prague, www.ochranaprirody.cz/en/about-us/conceptions/nature-and-landscape-protection-strategy.
Odyssee-Mure (2015), Energy Efficiency trends and policies in the Czech Republic, www.odyssee-mure.eu/publications/national-reports/energy-efficiency-czech-republic.pdf.
OECD (2017a), Measuring distance to the SDG targets: An assessment of where OECD countries stand, OECD Publishing, Paris, www.oecd.org/std/OECD-Measuring-Distance-to-SDG-Targets.pdf.
OECD (2017b), OECD Economic Outlook, Volume 2017 Issue 2: Preliminary version, OECD Publishing, Paris, https://doi.org/10.1787/eco_outlook-v2017-2-en.
OECD (2017c), "Regional demography", OECD Regional Statistics (database), https://doi.org/10.1787/a8f15243-en (accessed June 2017).
OECD (2017d), “Agri-Environmental indicators”, OECD Agriculture Statistics (database), www.oecd-ilibrary.org/agriculture-and-food/data/oecd-agriculture-statistics_agr-data-en (accessed June 2017).
OECD (2017e), OECD Environment Statistics (database), www.oecd-ilibrary.org/environment/data/oecd-environment-statistics_env-data-en.
OECD (2017f), "STAN Indicators ISIC Rev. 4", STAN: OECD Structural Analysis Statistics (database), https://doi.org/10.1787/data-00651-en.
OECD (2016a), OECD Environmental Performance Reviews: France 2016, OECD Publishing, Paris, https://doi.org/10.1787/9789264252714-en.
OECD (2016b), OECD Economic Surveys: Czech Republic 2016, OECD Publishing, Paris.
OECD (2016c), “Czech Republic”, in OECD Regional Outlook 2016: Productive Regions for Inclusive Societies, OECD Publishing, Paris, https://doi.org/10.1787/9789264260245-20-en.
OECD (2016d), Fossil Fuel Support Country Note: Czech Republic, OECD Publishing, Paris, www.oecd.org/site/tadffss/data/.
OECD (2015a), “Trade in Value Added: Czech Republic” , OECD Publishing, Paris, www.oecd.org/sti/ind/tiva/CN_2015_CzechRepublic.pdf.
OECD (2015b), National Climate Change Adaptation: Emerging Practices in Monitoring and Evaluation, OECD Publishing, Paris, https://doi.org/10.1787/9789264229679-en.
Roy, R. and N. Braathen (2017), “The Rising Cost of Ambient Air Pollution thus far in the 21st Century: Results from the BRIICS and the OECD Countries”, OECD Environment Working Papers, No. 124, OECD Publishing, Paris, https://doi.org/10.1787/d1b2b844-en.
UNFCCC (2014), Report of the technical review of the sixth national communication of the Czech Republic, United Nations Framework Convention on Climate Change, http://unfccc.int/resource/docs/2014/idr/cze06.pdf.
Notes
← 1. As measured by the Gini index.
← 2. In terms of the OECD Framework for Measuring Well-Being and Progress.
← 3. The new targets are 32 million tonnes of CO2 equivalent (Mt CO2 eq) of GHG emission reduction by 2020 and 44 Mt CO2 eq by 2030, compared to 2005 levels (a reduction of about 40%, or 48% compared to the 1990 level).
← 4. The Visegrád group consists of the Czech Republic, Hungary, Poland and Slovakia.
← 5. Figures in this paragraph exclude land use, land use change and forestry.
← 6. Amending Directive 2003/35/EC and repealing Directive 2001/81/EC.
← 7. Based on three-year average values: 1999-2001 and 2013-15.
← 8. The amount of economic wealth generated per unit of material used.
← 9. The sum of domestic raw material extraction used by an economy and its physical trade balance (imports minus exports of raw materials and manufactured products).
← 10. Including material recycling and composting.
← 11. This report refers to the Eurostat method of calculating recycling rates and tracking compliance with the 2020 target of 50% recycling of municipal waste, but countries may choose a different method.
← 12. Based on three year average values: 2000-02 and 2012-14.
← 13. Based on three year average values: 2000-02 and 2013-15.
← 14. Potential vulnerability expressed as long-term average soil loss (G) higher than 2.1 t.ha 1.year-1.
← 15. Under the 2011-20 Strategic Plan for Biodiversity of the Convention on Biological Diversity, Aichi target 11 is to conserve 17% of the terrestrial and inland water area and 10% of the coastal and marine area by 2020 through protected area systems and other area-based measures.
← 16. The indicator relates actual fellings to annual productive capacity (i.e. gross increment).
← 17. The main directives on water issues are the Water Framework Directive (2000/60/EC), Drinking Water Directive (98/83/EC), Bathing Water Directive (2006/7/EC), Urban Waste Water Directive (91/271/EEC), Nitrates Directive (91/676/EEC), Groundwater Directive (2006/118/EC) and Floods Directive (2007/60/EC).