Chapter 4. Austria
This chapter presents 2015 road safety data for Austria along with provisional data from 2016. It looks at trends in traffic and road safety from the years 1990 to 2015 and road user behaviour patterns, with a special focus on the ageing population. Sections include data on speed, drink driving, drugs and driving, distracted driving, fatigue and seat belt usage. The chapter reviews Austria’s road safety strategy and national targets to 2020 and the progress achieved so far. It also provides details of all recently implemented safety measures and current and ongoing research.1
Following the lowest year on record for fatalities in 2014, Austria recorded an increase of 11.4% in 2015, totalling 479 deaths, equivalent to a rate of 5.6 deaths per 100 000 inhabitants. Car occupants, pedestrians and motorcyclists were most affected by the increase, as were the 18-24 year old age group and those over 65. Provisional data from 2016 indicate a new decrease of 10.9% in fatalities with a total of 427 road deaths, just under the 2014 level. Once confirmed this would mark a new record in Austrian road safety since monitoring began in 1950.
Road safety data collection
Definitions applied in Austria
Data included in this report correspond to the consolidated set of police data.
-
Road fatalities refer to deaths within 30 days of the crash.
-
Injury crashes are crashes resulting in at least one injured or killed person.
-
Since 2012 injured persons are subdivided into seriously injured and slightly injured. (Prior to 2012, a third category, “unknown degree of severity”, existed).
-
Slightly injured are all other injured persons.
-
Seriously injured persons are those suffering an injury resulting in an inability to work or health problems for more than 24 days.
-
-
Since 2015, the number of people seriously injured with a Maximum Abbreviated Injury Scale of three or more (MAIS3+) injuries is being reported.
Data collection
In Austria, crash data are collected by the police. The crash data acquisition process was completely transformed in January 2012 from paper forms to integrated data input including geographic information system (GIS) support. It is believed that this has significantly reduced underreporting rates, especially for less severe road crashes (see resulting increase in the number of injury crashes in Table 4.1 from 2010 to 2013). However, due to a change in the collection method, data for injuries and crashes since 2012 cannot be directly compared with previous figures. This does not apply to the number of fatalities.
Injury severity is assessed by the police at the crash scene, with only occasional feedback from hospitals. It is not possible to link police and hospital data directly on the basis of the present data architecture.
Regular estimates for the number of serious injuries are required by the European Commission, based on a Maximum Abbreviated Injury Scale (MAIS) score of 3 or more (MAIS3+). In 2015, for the first time in Austria, this estimate was derived from the International Classification of Diseases-10 (ICD-10) hospital data on road traffic victims. The process was repeated in 2016 and will from now on be carried out on a regular annual basis.
Most recent safety data
Road crashes in 2016 – final data
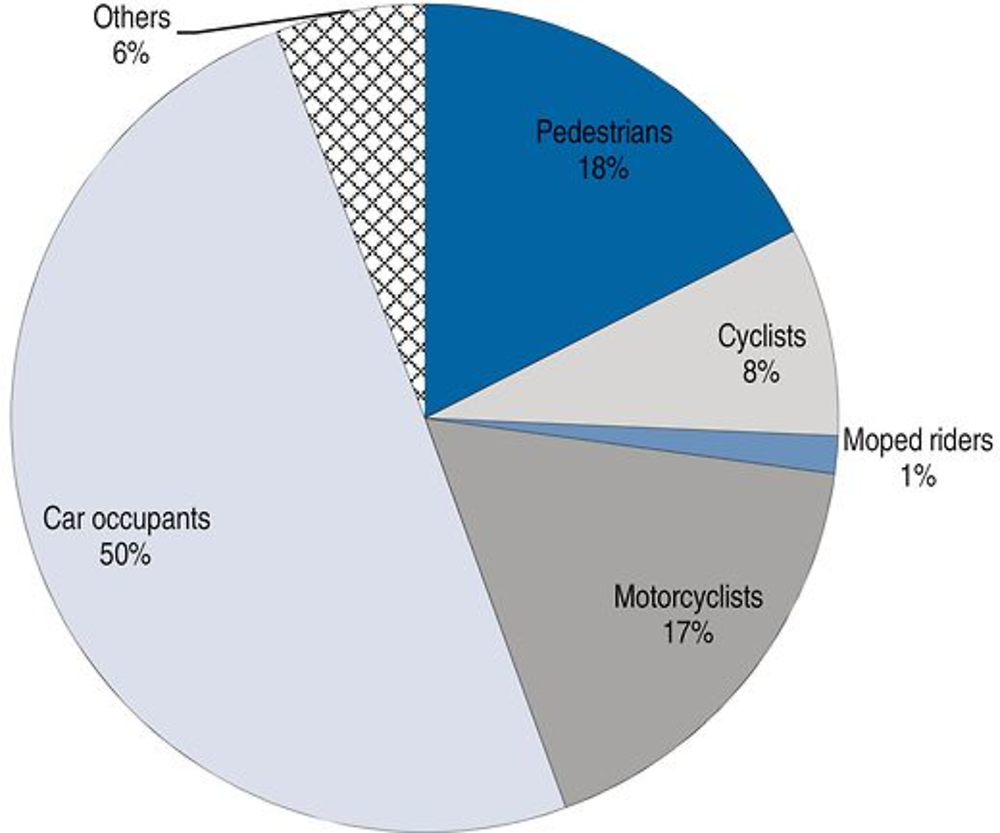
In 2016, 432 persons were killed on Austrian roads, 9.8% less than in 2015. Therefore, 2016 marks the year with the lowest fatality count since recording started in the Austrian Home Office in 1950. Among the road deaths, 44% were car occupants, 20% motorcyclists, 11% cyclists (nearly one-third of which were on electric bicycles), and 17% pedestrians. The proportion of vulnerable road users has increased and now accounts for around half of all fatalities – a trend that has also been observed in many other countries over recent years.
Road crashes in 2015
The number of fatalities in 2015 was 11% higher than the previous year. This increase was predominantly seen among car occupants (+26%) and pedestrians (+18%), as well as powered two-wheeler (PTW) riders (+9%).
This relatively bad performance is in part explained by the fact that 2014 had been an extraordinarily good year and had broken all-time records for months June through September. The usual summer high in fatality counts was much less pronounced in 2014 (potential contributors being cool and rainy weather and rising unemployment rates) whereas 2015 had largely returned to average seasonal values. Analysis confirmed that exposure on the high-level road network was higher in 2015 than in 2014 for the months June through September, especially on weekends.
In 2015, the police recorded 37 960 injury crashes, virtually the same as in 2014.
Trends in traffic and road safety (1990-2015)
Traffic
Since 1990, the number of vehicles has increased by 54% and traffic has increased by 69% (2015 data). Until 2008, the average yearly increase in kilometres driven was nearly 3%; in 2009, the trend shifted downward and growth since then has been about 1.1% annually. However, in 2014 and 2015 an annual increase of nearly 3% was re-established.
Road safety
Crashes and casualties
Between 1990 and 2015, the number of road fatalities decreased by 69%. More recently (2000 to 2015), the number of fatalities has decreased by 51%. A rise of crash figures in 2012 was artificially induced by the new data collection methodology. As a result, injury crash counts for 2012 and later cannot be compared to previous years.
The substantial decline in road mortality since 1990 was marked by the implementation of the first two integrated road safety programmes in Austria incorporating a variety of measures including:
-
second phase education for novice drivers after granting the driving licence
-
automatic section control of average speeds along stretches of motorways and rural roads
-
awareness campaigns in such areas as seat belt and child restraint use, alcohol, child safety and choice of adequate speed on rural roads
-
large-scale roadside testing for alcohol using alcohol screening devices
-
penalty point system.
Rates
The road death rate per 100 000 inhabitants has decreased by 73% since 1990, while the number of vehicles per 1 000 inhabitants has increased by 38%.
Analysis of seriously injured data
In 2014 and 2015, KFV carried out a feasibility study on MAIS3+ assessment on behalf of the Austrian Transport Ministry (BMVIT). The study covered two methods of estimating the number of serious road injuries:
-
application of a (hospital data based) correction factor to the police reported number of serious injuries
-
use of hospital data alone to arrive at an estimate for serious injuries.
The latter method was selected for further use. For 2014 and 2015 the numbers of MAIS3+ injuries were estimated at 1 410 and 1 309, resulting in ratios of 3.28 and 2.73 between MAIS3+ injuries and fatalities.
The accuracy of the estimation procedure may be substantially influenced by data quality and the accuracy of the Hospital Discharge Register.
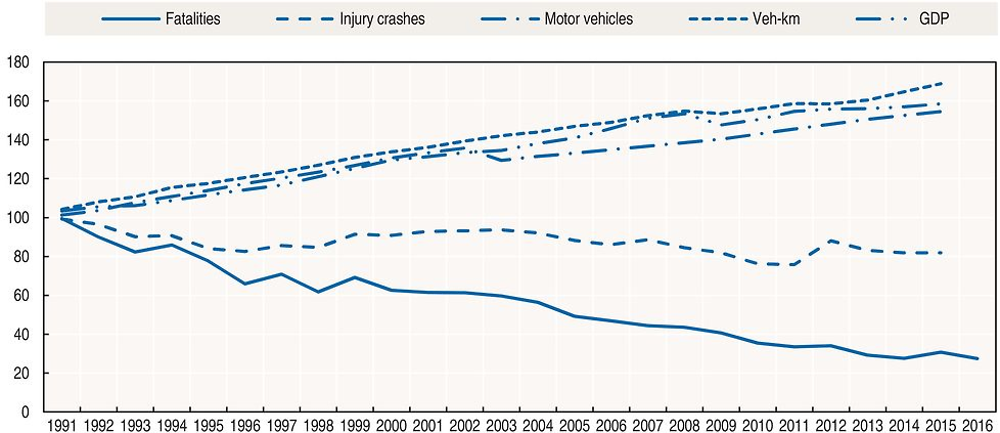
Note: A direct comparison of data on injury crashes, or injured road users, with data recorded before 2012 is not possible. Source: World Bank (2017) (GDP; constant prices).
Road safety by user group
Since 1990, all road users in Austria have benefited from improvements in road safety. By 2015, there was a 74% reduction in fatalities among the largest group, car occupants. Among the second largest group, pedestrians, fatalities were reduced by 68% since 1990. This positive development is contrasted by an increase since 2010 in motorcycle fatalities (22%). Motorcyclists now represent 17% of road fatalities in Austria.
Cycling popularity is increasing in Austria and municipalities are providing additional and safer cycling infrastructures. Cyclists accounted for 8% of all fatalities in 2015.
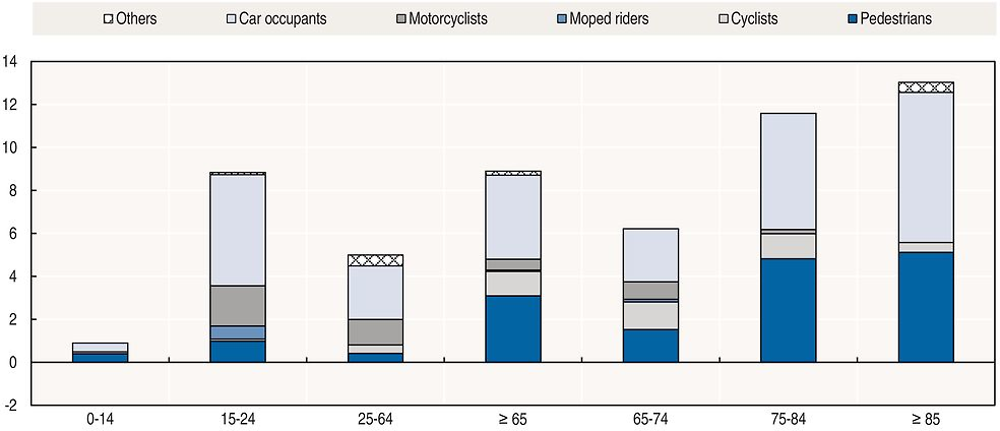
Road safety by age group
Since 1990, a reduction in fatality rates of more than 60% has been observed in all age groups, except the older population of 65 years of age and over (-49.3%). Historically, young people represent a high-risk group in road safety. In 1990, the highest number of fatalities per 100 000 inhabitants was recorded for persons 18-20 years old (59), followed by the 21-24 year old group (35). In 2015, this rate decreased to 11 and 9, respectively.
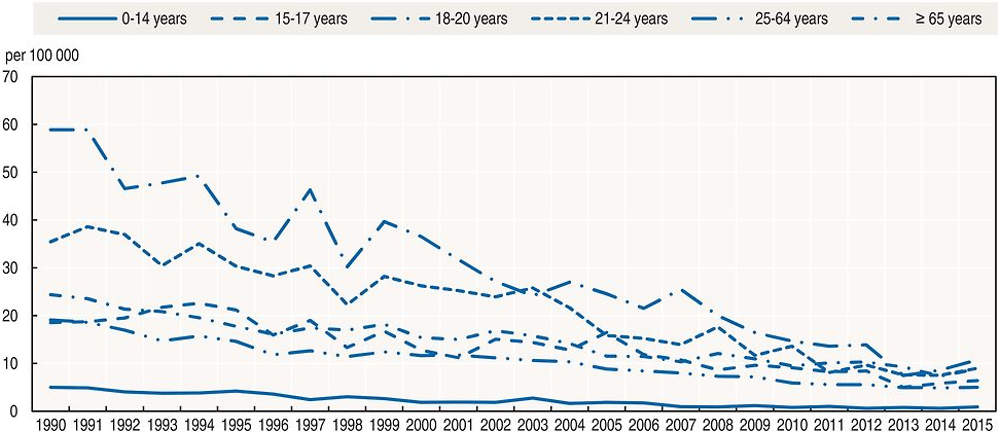
In 2015, people aged 65 and above represented 19% of the total population. This share is estimated to reach almost 30% in 2050 (Statistik Austria, Bevölkerungsprognose, 2016). This has important consequences for road safety policy.
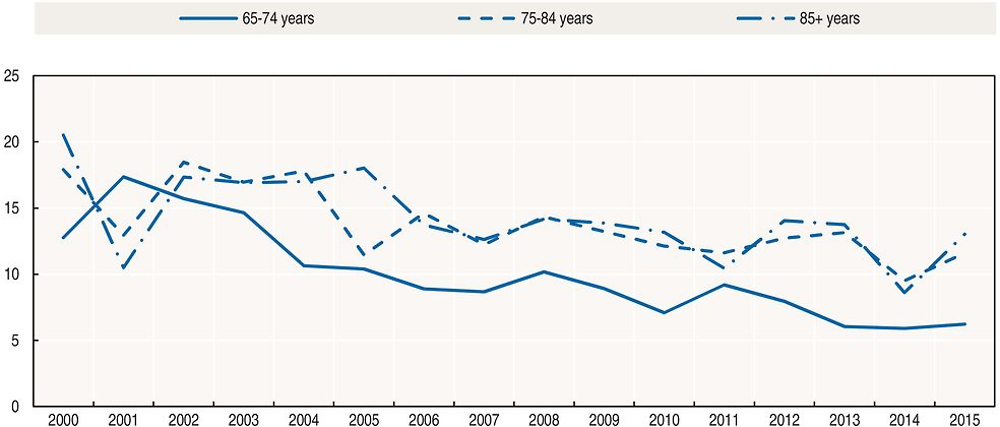
Compared to other age groups, since 1990, the mortality rates decreased the least for the 65+ age group, and increased in 2015, after the marked decrease in 2014. Consequently, the share of fatalities of the 65+ age group of all road fatalities has been steadily increasing, from 19% in 2000 to 29% in 2015. An increasing share of older people are also killed as car occupants: 31% in 1990, 36% in 2000 and 44% in 2015. In 2015, almost 80% of these car occupants were drivers, as compared to only 51% in 1990, and 62% in 2010 (for women, the ratio of car drivers among car occupant fatalities was 20% in 2000 and 50% in 2015).
In Austria, there are no age-specific tests for drivers; only the general EU licence renewal rules apply.
In 2012, KfV piloted voluntary risk competence training for senior motorists as a promising alternative to performance tests and health checks. The common perception from research results is that scrutinising all older drivers from a certain age is not a cost-beneficial measure, as age is a very unreliable predictor for fitness to drive.
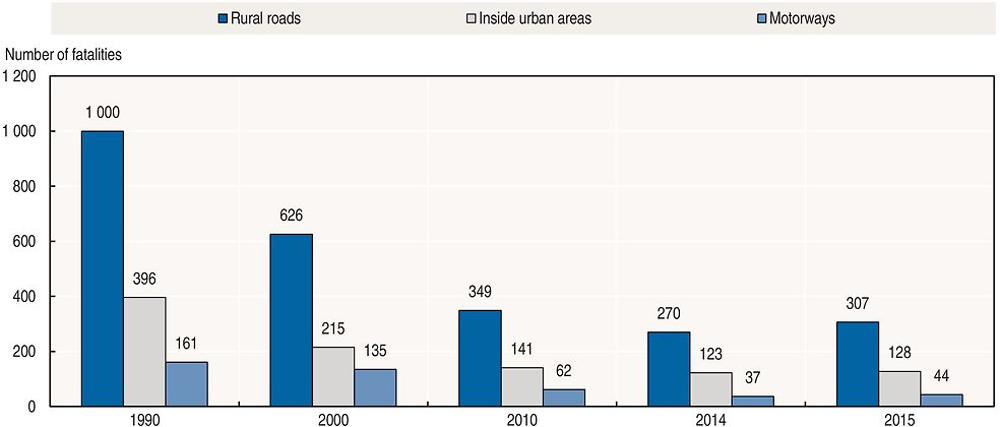
Road safety by road type
In 2015, 64% of fatalities occurred on rural roads, nearly 27% in urban areas and about 9% on motorways. While the overall fatalities have been reduced by 69% since 1990, fatalities on motorways decreased by the highest rate (73%) followed by rural roads (69%) and urban areas (68%). In 2015, compared with the previous year, the number of fatalities has increased on all road types.
Economic costs of traffic crashes
Traffic crashes represent a very significant cost for the Austrian society, estimated at around EUR 10 billion (about 3.4% of GDP).
There are no regular updates of the economic costs of traffic crashes in Austria. According to the most recent study (Herry et al., 2013), the costs of human suffering make up almost half of the crash costs (48% using the “willingness to pay” approach), while the most important other costs are material damage (25%), loss in achievement potential (15% using human capital approach), insurance administration (7%) and legal costs (2%).
Recent trends in road user behaviour
Speed
Speed, and especially inappropriate speed, is one of the main causes of crashes in Austria. According to a police assessment in 2015, 14% of all injury crashes and 24% of all road fatalities were caused by speeding.
Due to restrictions in manpower, increases in speed surveillance by traffic police cannot be expected in the future, but automatic speed enforcement including section controls will be further developed. The table below summarises the main speed limits in Austria.
In 2016, the Austrian Ministry of Transport launched a nation-wide campaign on adequate speed choice on rural roads that has been continued into 2017. KfV will evaluate the impact of the campaign once it is finalised.
Drink driving
To define drink-driving crashes, Austria uses the definition recommended by the European Union project SafetyNet: any crash in which any active participant had a blood alcohol content level (BAC) above the legal limit.
The maximum permissible blood alcohol level for drivers in Austria has been 0.5 g/l since 1998. The level is 0.1 g/l for moped drivers under 20 years’ old, novice drivers (holding a licence for less than two years), drivers of trucks over 7.5 tonnes and drivers of buses with more than nine seats.
Since 2002, every driver involved in an injury crash is tested for alcohol. However, it is not permitted in Austria to test a dead or an unconscious person (unless the prosecutor requires it). Therefore, the number of unreported cases is believed to be substantial.
In 2015 there were 2 226 recorded drink-driving crashes (+0.6% compared to 2014) with 2 834 injured persons (-2%) and 27 fatalities (-15.6%). The share of fatalities in crashes involving an alcohol-intoxicated person decreased from 7.4% in 2014 to 5.6% in 2015. However the actual share is probably much higher, as deceased persons are not tested.
Drink driving remains a predominantly male problem. However, the share of drunk females in alcohol-related crashes has been on a steady increase since 2000 (8%), reaching 13% in 2015.
An alcohol interlock rehabilitation programme for offenders was introduced in 2017.
Drugs and driving
Austrian regulations provide no specific thresholds for drug concentrations. It is forbidden to drive or ride a motor vehicle while under the influence of drugs.
Little is currently known about the prevalence of drugs as a causal factor in accidents. According to a subjective assessment of the Austrian police, in 2015, 4.2% of all injury crashes and 3.8% of all road fatalities were caused by impairment due to alcohol and illicit or pharmaceutical drugs.
In 2017, the Austrian police started trialling roadside drug testing devices (saliva tests) in all of the nine Austrian regions.
Distraction
In 2015, about 38% of all road traffic crashes and 31% of all road fatalities were attributed to inattentiveness or distraction as the main cause of the crash.
In Austria, it is not permitted to drive while using a hand-held mobile phone. However, the use of hands-free devices is tolerated. The use of hand-held mobile phones while cycling was prohibited in 2013.
Since 2016, the prohibition of hand-held mobile phone use during driving also includes texting, dialling, social media etc., with the exception of navigation. KFV has developed “distraction workshops” for Austrian schools, of which the first pilot projects were successfully deployed in all Austrian provinces in 2016.
Sleepiness and fatigue
The share of fatigue as a causal factor in crashes is especially challenging to detect. According to the Austrian Statistics Bureau (Statistik Austria) and based on police assessment, in 2015, 1.5% of all injury crashes and 4.6% of all road fatalities were caused by drowsiness in drivers. The real figures may be significantly higher.
Seat belts and helmets
Seat belt wearing has been compulsory in Austria since 1984 in front seats and from 1990 for rear seats. The seat belt wearing rate on front seats has been steadily increasing and was around 95% in 2016, whereas rear seat belts are used by only 88% of adult car occupants.
The use of dedicated child restraint devices has been mandatory in Austria since 1994 for children under 14 years of age or less than 150 cm tall.
The share of fatally injured car occupants not using a seat belt has dropped from about 50% in 2000 to 34% in 2015.
Helmets are compulsory on all powered two-wheelers. The helmet-wearing rate of riders of powered two-wheelers is not surveyed regularly, but it is believed to be at practically 100%.
Since June 2011, bicycle helmets have been compulsory for children up to 12 years of age.
National road safety strategies and targets
Organisation of road safety
Primary responsibility for road safety in Austria lies with the Federal Ministry for Transport, Innovation and Technology (BMVIT). BMVIT co-operates with the Federal Ministry of the Interior (BM.I) and other government ministries, regional and local authorities, interest groups, chambers of commerce and industry, trade and labour associations and road safety organisations through the Road Safety Programme.
The Road Safety Advisory Council, established at BMVIT, serves as the institutional platform for partners in the Road Safety Programme. It was established in 2006 as the forum for decision makers in matters relating to road safety and, in particular, for the preparation, ongoing evaluation and development of road safety programmes for all modes of transport. Members are transport spokespersons for the parliamentary political parties, representatives of government ministries, local and regional authorities, automobile clubs, chambers of commerce and industry, trade and labour associations, interest groups and research institutions.
The Austrian Road Safety Fund, also established at BMVIT, was set up with the aim of promoting and furthering road safety. The Road Safety Fund is funded with revenues from personalised vehicle number plates. The Road Safety Fund plays a key role in financing road safety related research and activities relating to the Road Safety Programme. Funding priorities are aligned to Road Safety Programme targets.
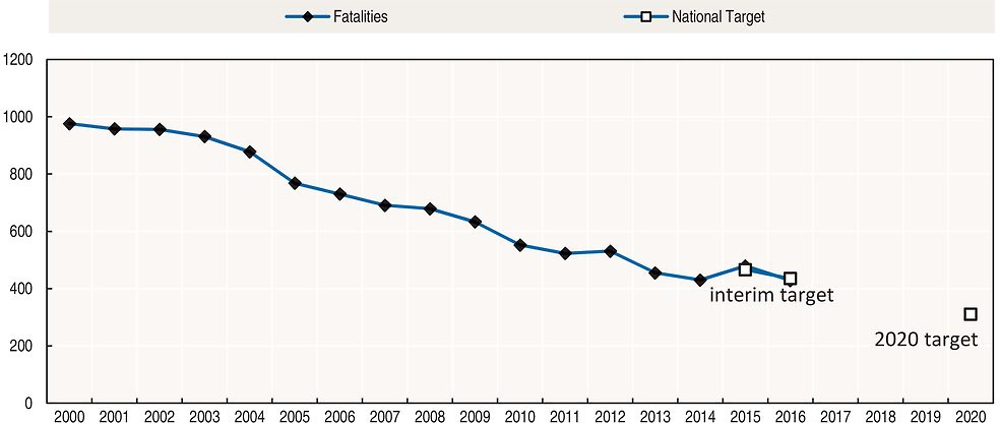
Road safety strategy for 2011-2020
Despite significant progress in the last decade, Austrian road safety figures are still only average compared to the European Union as whole and below average for the EU15 countries. The Road Safety Programme 2011-2020 aims at “making Austria one of the five safest countries in Europe”. It is based on the Safe System approach and has an increased focus on reducing the number of serious injuries on Austrian roads. The Programme features 17 main fields of action.
Road safety targets
-
50% reduction in fatalities by 2020, based on the average for the years 2008-10 (Interim target: -25% by 2015)
-
40% reduction in serious injuries by 2020, based on the average for the years 2008-10 (Interim target: -20% by 2015)
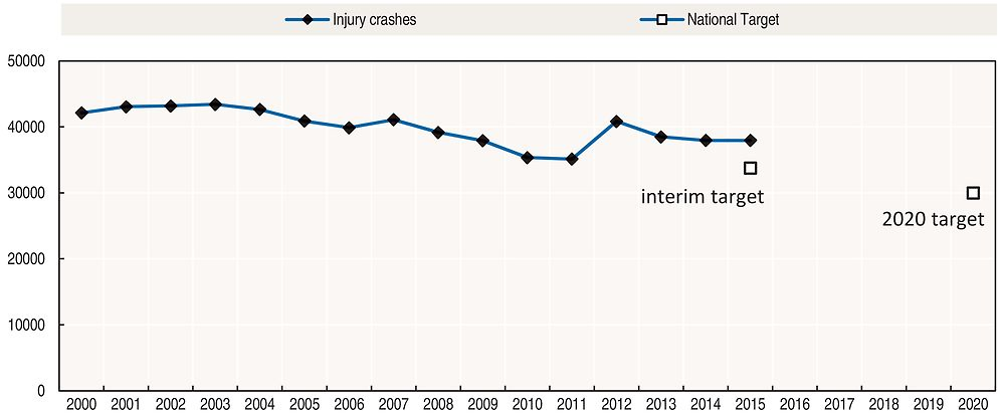
-
20% reduction in injury crashes by 2020, based on the average for the years 2008-10 (Interim targets: -10% by 2015).
The targets are based on the EU fatality reduction target as well as the European Transport Safety Council’s proposal for a serious injury reduction target.
To ensure the Road Safety Programme is successfully implemented, the Road Safety Advisory Council provides support in all 17 fields of action throughout the duration of the programme. It gathers and analyses available annual crash statistics, behaviour parameters and safety indicators. Based on this information, measures are adjusted as required to accommodate changes in road behaviour and crashes.
The Annual Report 2015 by the Federal Ministry for Transport, Innovation and Technology (BMVIT, 2015) provides the most recent overview of the implementation status of the Road Safety Programme and therefore serves as an ongoing programme evaluation tool.
1. Crash data acquisition process changed in 2012.
Recent safety measures (2014-17)
Road safety management
-
An updated version of the Austrian Road Safety Programme 2011-2020 was published in 2016 (BMVIT 2016) www.bmvit.gv.at/en/service/publications/transport/downloads/rsp2020_ 2016.pdf.
Road users
Driving licence
-
A “late starter” motorcycle driving licence (for age group 39+) was introduced in 2014, featuring new modules on risk competence and practical handling of heavy bikes.
-
A risk competence course for all driving instructors of A-category licences was introduced in 2015.
-
Second phase (post-licence) driving licence education: all involved bodies (incl. driving schools) now to take part in a quality assurance process.
Distraction
-
Since 2016, the prohibition of hand-held mobile phone use during driving also includes texting, dialling, social media etc., with the exception of navigation.
Driving under the influence
-
A maximum BAC level of 0.1 g/l for non-commercial school transport was introduced in 2016.
-
Implementation of the EU Directive requiring expert certificates and regular monitoring of sleep apnoea patients
-
An alcohol interlock rehabilitation programme for offenders was introduced in 2017.
-
In 2017, the Austrian police started testing of roadside drug test devices (saliva tests) in all of the nine Austrian regions.
Protective equipment for motorcyclists
-
The Supreme Court ruled that motorcycle riders not wearing appropriate protective clothing (in addition to a safety helmet) will not receive full compensation in case of an accident.
Speed Management/Education and Awareness
-
In 2016, the Austrian Ministry of Transport launched a nation-wide campaign on adequate speed choice on rural roads, which continues into 2017. KFV will evaluate the impact of the campaign once it is finalised. https://infothek.bmvit.gv.at/verkehrssicherheitskampagne-lenken-sie-ihr-schicksal-selbst/ (accessed 11 May 2017)
Infrastructure
-
In 2014, trucks above 7.5 tons were prohibited from using fast lanes on motorways with three or more lanes.
-
Since 2016, automated driving pilot projects in real traffic are possible in Austria (but require decree by the transport ministry).
Recent and ongoing research
The Austrian Road Safety Fund (RSF) has been issuing thematic calls for tenders since 2010. The respective themes are defined by BMVIT in line with Road Safety Programme goals and current accident trends. For all RSF projects, reports are available on the BMVIT website at www.bmvit.gv.at/verkehr/strasse/sicherheit/fonds/vsf/index.html (in German, with English abstracts; accessed 11 May 2017). Some examples are listed here:
-
Co-driver: Reduction of children car passenger injuries” (in German with English abstract): www.bmvit.gv.at/bmvit/verkehr/strasse/sicherheit/fonds/vsf/downloads/49_codriver.pdf.
-
Cognitive training for older cyclists to improve vigilance and multitasking performance (in German with English abstract): www.bmvit.gv.at/bmvit/verkehr/strasse/sicherheit/fonds/vsf/downloads/50_spielerischestraining.pdf.
-
Role Model: reducing accidents through role models and by considerate driving (in German with English abstract): www.bmvit.gv.at/bmvit/verkehr/strasse/sicherheit/fonds/vsf/downloads/51_rolemodel.pdf.
-
The KFV has published the following recent studies on its website:
-
100-Car Study Austria: Naturalistic observation of driving behaviour (German with English abstract): http://www.kfv.at/fileadmin/content/Taetigkeitsbereich/Publikationen/100-CarStudy_ web.pdf.
-
Strategic goals in European road transport policies (German with English abstract): http://www.kfv.at/fileadmin/content/Taetigkeitsbereich/Publikationen/KFV_Publikation_ Strategische_Themen_EU_Final.pdf.
-
References
BMVIT (2015), Road Safety in Austria Annual Report 2015, Federal Ministry for Transport, Innovation and Technology, Vienna, www.bmvit.gv.at/en/service/publications/transport/downloads/roadsafety_ report2015.pdf (accessed 11 May 2017).
BMVIT (2016), “Austrian Road Safety Programme 2011-2020”, 2nd edition for 2016-2020, Federal Ministry for Transport, Innovation and Technology, Vienna, www.bmvit.gv.at/bmvit/en/verkehr/roads/safety/publications/index.html (accessed 11 May 2017).
Herry, M. et al., (2013), Studie im Auftrag des VSF/bmvit: Unfallkostenrechnung Straße 2012 unter Berücksichtigung des menschlichen Leids, Federal Ministry for Transport, Innovation and Technology, Vienna.
World Bank (2017), “GDP (constant US$)”, World Development Indicators, http://databank.worldbank. org/data/reports.aspx?source=world-development-indicators (accessed 23 February 2017).
Websites (all accessed 11 May 2017)
-
Austrian Ministry for Transport, Innovation and Technology : www.bmvit.gv.at.
-
Austrian Road Safety Board (KFV): www.kfv.at.
-
Statistik Austria: www.statistik.at/web_en/statistics/transport/road/road_traffic_accidents/index.html.
-
Information site on child safety in cars: www.autokindersitz.at/content/index.php.
-
Automobile, Motorcycle and Bicyclists Club Austria: www.arboe.at.
-
Austrian Automobile, Motorcycle and Touring Club: www.oeamtc.at.
Note
← 1. All data stem from KFV (Kuratorium für Verkehrssicherheit, based on disaggregated police data provided by Statistik Austria) and IRTAD unless otherwise noted. For more information please contact: [email protected].