Chapter 28. New Zealand
This chapter presents 2015 road safety data for New Zealand along with provisional data from 2016. It looks at trends in traffic and road safety from the years 1990 to 2015 and road user behaviour patterns with a focus on the ageing population. Sections include data on speed, drink driving, drugs and driving, distracted driving, fatigue and seat belt usage. The chapter reviews New Zealand’s road safety strategy and national targets to 2020 and the progress achieved thus far. It also provides details of all recently implemented safety measures and current and ongoing research.1
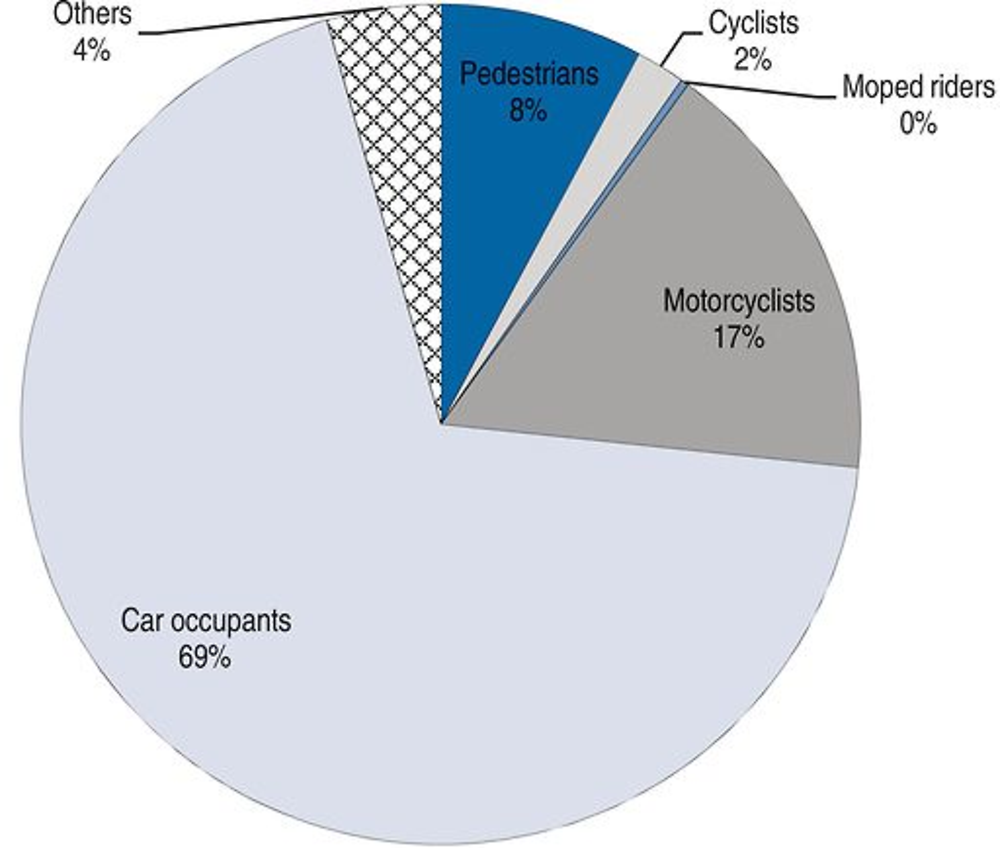
Following the all-time low in fatalities achieved in 2013, New Zealand registered two consecutive years of increases, with preliminary data from 2016 indicating a continuing trend. In 2015, 319 people died on the roads in New Zealand, a 9% increase over 2014, a fatality rate of 6.9 per 100 000 inhabitants. Car occupants and motorcyclists were the groups most affected by the increases, with car occupants accounting for 69% of all fatalities.
Road safety data collection
Definitions applied in New Zealand
-
Road fatality: Any person killed immediately or dying within 30 days as a result of a road crash.
-
Serious injuries: Fractures, concussion, internal injuries, crushing, severe cuts and lacerations, severe general shock necessitating medical treatment, and any other injury involving removal to and detention in hospital, as recorded in police records.
-
Minor injuries: Injuries such as sprains and bruises.
New Zealand does not collected data based on the Maximum Abbreviated Injury Score (MAIS).
Data collection
New Zealand’s road crashes are usually attended by police officers. Police complete traffic crash reports, which are forwarded to the New Zealand Transport Agency to be coded and the information entered into the Crash Analysis System.
Fatal crashes are all reported. When a traffic crash results in injuries, the law requires that the crash be reported, but comparisons with hospital data indicate that only about two-thirds of such crashes are reported to the New Zealand Transport Agency.
Statistical linking is done to derive reporting rates needed to calculate social costs of crashes.
Most recent safety data
Road crashes in 2016 – provisional data
Based on provisional data, in 2016, 328 people lost their lives in a traffic crash, an increase of almost 3% when compared to 2015. There were 9 959 injury crashes, a 2.3% increase from 2015. Some of this increase may be due to an improvement in crash reporting by police as the result of a change from a paper traffic crash report form to an electronic form. This will be investigated as other injury data sources become available for comparison.
Road crashes in 2015
In 2015, 319 people died on New Zealand’s roads. This represents a 9% increase compared to the same period in 2014 and is the second consecutive year with a marked increase in the number of road fatalities.
Since 2013, the number of road deaths has increased by 26%. While this increase needs to be analysed in the light of the good results of 2013 (when the lowest toll since 1952 of 295 fatalities was reached), it represents nevertheless a worrying trend. Preliminary data from 2016 show a 2.8% increase when compared to the same period in 2015. There is no immediate explanation for this increase. There have been increases in the amount of travel in the last two years but the increase in the road fatality toll is much greater.
Trends in traffic and road safety (1990-2016)
Traffic
Between 1990 and 2015, the number of motorised vehicles increased by 60%. Since 2000, the number of registered vehicles increased by 35% and the overall vehicle kilometres driven by 27%. However, since 2007, there has been a marked slowdown in the growth of road traffic. It started to pick up again in 2014, with an increase of 2.3% compared to 2013, with a further increase of 3.3% observed in 2015.
Figures for 2014 indicate that the vehicle fleet has also increased by nearly 3% over 2013 with a further increase of 3.4% recorded between 2014 and 2015.
Road safety
Crashes and casualties
Between 1990 and 2015, the number of fatalities decreased by 56%. Fatalities declined by 31% between 2000 and 2015. The reported number of injury crashes has increased since 2000, which can be partly attributed to better crash reporting by the police after 2001. However, injury crashes have decreased over the last seven years, with some year-to year fluctuations. In 2015, crash numbers were 9.6% higher than in 2014.
New Zealand has made substantial changes to its land transport policy since 1990 to reduce road trauma. Main measures include:
-
graduated driving licence system and a photo licence
-
compulsory breath testing carried out through road side testing
-
speed cameras
-
new drug driving laws
-
increased penalties for serious offences
-
increased minimum driving age from 15 to 16 years
-
lowered blood alcohol concentration (BAC) – to zero for drivers less than 20 years of age and to 0.5 g/l for drivers aged 20 and over
-
introduction of alcohol interlocks as part of the penalty regime
-
development of a speed management programme.
The development and subsequent implementation of the “Safer Journeys” strategy adopted in 2010 and based on the Safe System approach has been a major change in the way New Zealand addresses road safety (see road safety strategy section below).
Rates
Between 1990 and 2015, the mortality rate, expressed in terms of deaths per 100 000 population, decreased by nearly 68%. In 2015, it was at 6.9. The mortality rate, in terms of deaths per 10 000 registered vehicles, has halved compared to 2000.
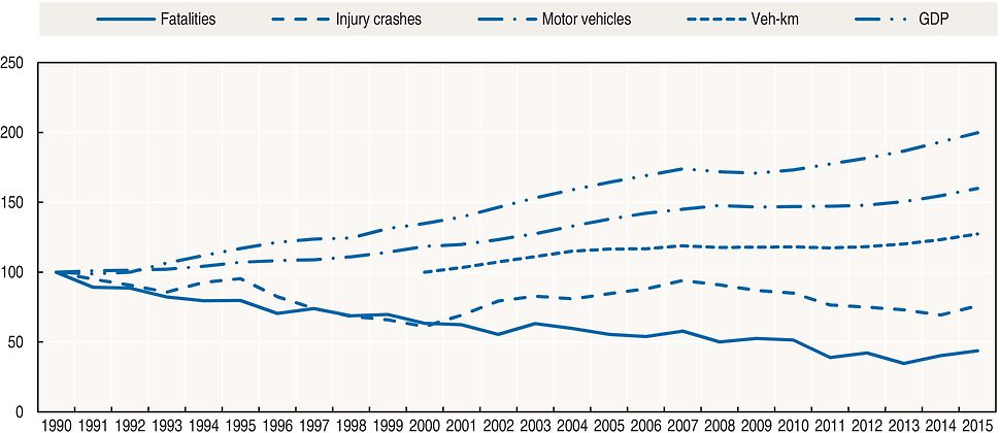
Source: World Bank (2017) (GDP; constant prices).
Road safety by user group
All user groups have benefited from improvement since 1990.
Since 2000, there has been a mixed picture. There has been a marked decrease in the fatalities among cyclists (-68%) and car occupants (-38%); improvements were less among pedestrians (-28.6%). However the number of motorcyclists killed has increased significantly (+77%). The increase in motorcyclists’ mortality is due in part to an increase in motorcycle ownership and to the increasing power of motorcycles being purchased.
In 2015, the situation deteriorated again for motorcyclists, with a 26% increase in fatalities, but also for car occupants. The numbers of killed vulnerable road users – pedestrians and cyclists - have decreased compared to 2014, by 42% and 40%, respectively.
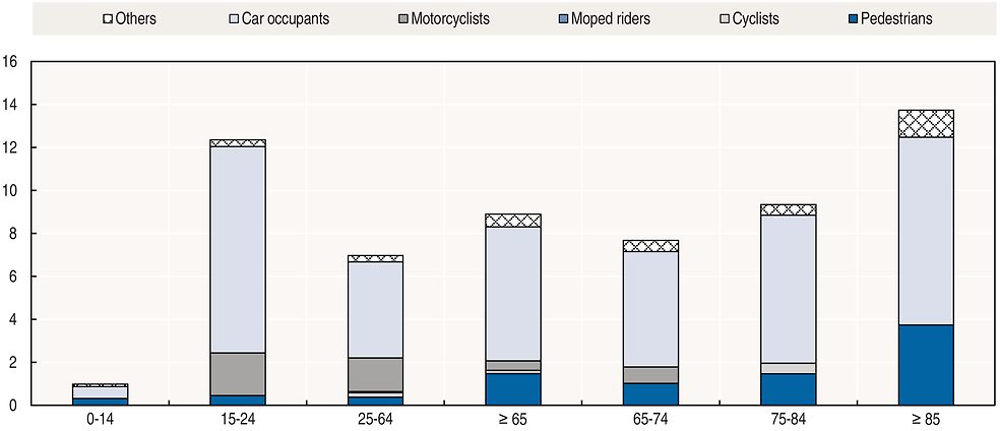
Road safety by age group
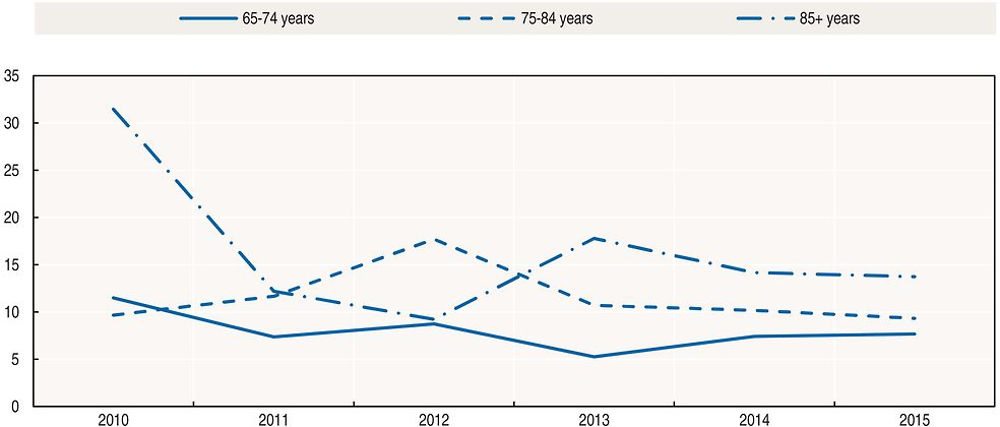
Since 1990, the reduction in fatalities has benefited all age groups; however, the improvement for senior citizens was much less than the other age groups. This is partly explained by demographic changes. Since 2000, the over 65 age group has risen from 15% to 18% of the population and from 12% to 15.5% of driver licence holders. The senior population are particularly vulnerable as pedestrians.
In 2015, the number of fatalities increased among all age groups except the 0-17 year olds.
The fatality rate of young people aged 18-24 is very high (approximately 16 deaths per 100 000 inhabitants), two and half times more than the rate of the average population, despite a significant decrease for 21-24 year olds in 2012 and 2013.
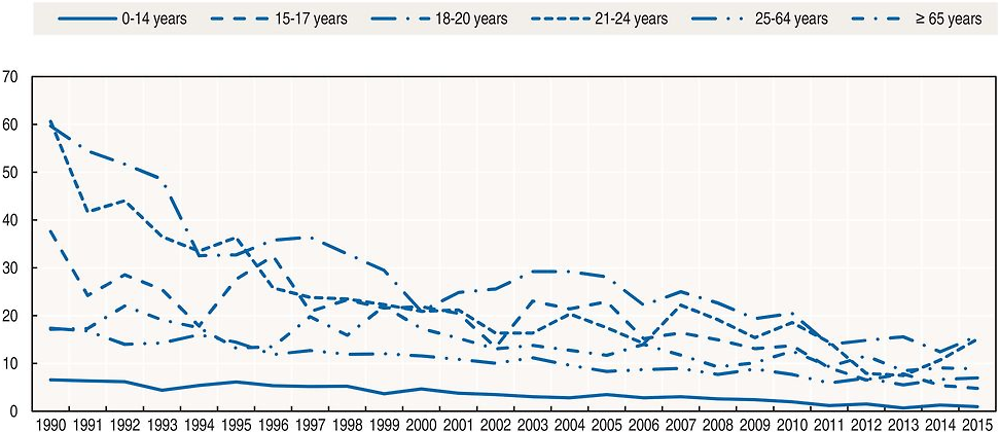
The population aged 65 and over is forecast to more than double by 2043. This compares to a 27% increase for the population as a whole.
Since 1990, the reduction in fatalities among the older population was much smaller than the other age groups. This is partly explained by demographic changes. Since 2000, the over 65 age group has risen from 15% to 18% of the population and from 12% to 15.5% of driver licence holders. Senior citizens are particularly vulnerable as pedestrians.
Most driver licences are valid for 10 years, after which they must be renewed if the licence holder wishes to continue driving. All licence holders renewing their licence must apply at a driver licensing agent. The applicants are required to prove their eyesight meets the required standard (through an on-site eyesight test or a recent medical or eyesight certificate.
Senior drivers who wish to continue driving must renew their driver licence at age 75, 80 and every two years thereafter. These drivers can apply to renew their licence up to six months before the expiry of their current licence.
In addition to general licence renewal requirements, senior applicants (from age 75) must present a medical certificate from their doctor that is no more than 60 days old. The medical certificate will advise if the licence holder is medically fit to drive, requires further testing to be declared fit to drive, or is fit to drive only under certain conditions (e.g. wearing corrective lenses or only during daylight hours).
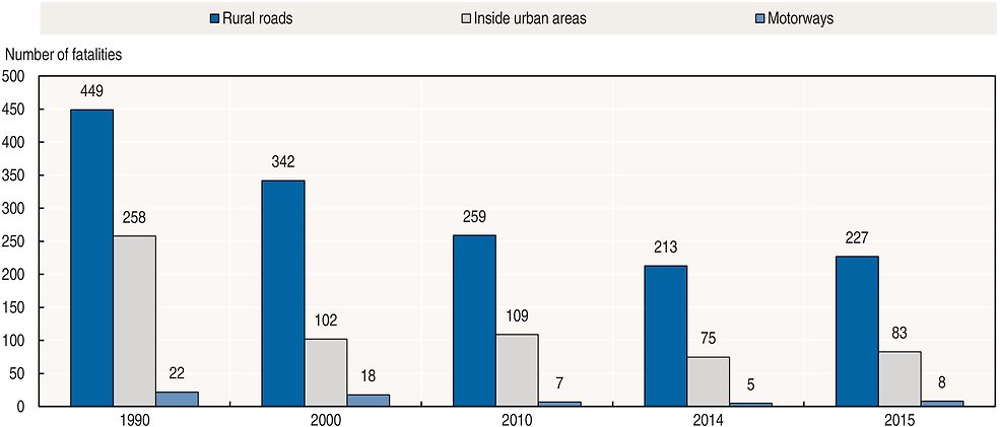
Road safety by road type
In 2015, 71% of fatalities occurred on rural roads, 26% inside urban areas, while motorways accounted for only 2.5% of the road deaths.
Improvements over the last 30 years have been more rapid on urban roads and motorways.
Economic costs of traffic crashes
In New Zealand, the social cost of a road crash or a road injury includes the following components:
-
loss of life and life quality
-
loss of output due to temporary incapacitation
-
medical costs
-
legal costs
-
vehicle damage costs.
Social cost components are either measurable or can be estimated in dollar terms. A “willingness-to-pay” valuation technique is used to express pain and suffering from loss of life or life quality in dollar terms. Various methodologies have been developed to estimate the value of other social cost components.
The New Zealand Ministry of Transport released its report “Social Cost of Road Crashes and Injuries 2016” in March 2017. The total social cost of motor vehicle injury crashes in 2015 is estimated at NZD 3.79 billion, at June 2016 prices. This represents an increase of 7.4% compared to the previous year.
Loss of life and/or life quality due to permanent impairment accounted for approximately 91% of the total social cost of injury crashes. Vehicle damage accounted for around 5%, and other cost components (medical costs, legal and court costs and loss of output costs) for around 4%.
Full information is provided at: www.transport.govt.nz/research/roadcrashstatistics/the socialcostofroadcrashesandinjuries/.
Published social costs take into account the estimated under reporting of crashes.
Recent trends in road user behaviour
Speed
The tables below illustrate the main speed limits in New Zealand and the percentage of drivers above the speed limit. Much progress has been accomplished since 2001 in reducing the number of violations. However, nearly half (46%) of drivers exceed the 50 km/h limit in urban areas, which is a cause for concern when it comes to ensuring the safety of vulnerable road users.
In 2015, speed was a contributing factor in 32% of road fatalities.
Drink driving
In 2014, New Zealand lowered the blood alcohol content (BAC) level from 0.8 g/l to 0.5 g/l. Drivers with a BAC over 0.8 g/l must appear in court; a BAC between 0.5 g/l and 0.8 g/l results in a fine and demerit points. In 2011, a zero drink-drive limit was introduced for drivers under 20. The earlier limit was 0.3 g/l.
Alcohol-related road deaths are those in which any motor vehicle driver was found with a BAC above the legal limit, or where the reporting officer suspected alcohol was a contributing factor. Over a quarter of road fatalities are attributed to an alcohol-related crash.
Drugs and driving
Drug-related crashes include crashes where the reporting officer suspected drug use was a contributing factor based on the crash investigation. In 2015, there were 24 road deaths (7%) for which the presence of drugs was found.
A number of recent studies have been undertaken on the issue of drugs and driving.
Seat belts and helmets
Seat belt use has been compulsory in front seats since 1972 and in rear seats since 1979.
In November 2013, the mandatory use of child restraints in vehicles was extended by two years, with all children required to be correctly secured in an approved restraint until they reach the age of seven.
Based on the most recent roadside surveys, the rate of seat belt use is about 96.5% in front seats (2016), 92% for adults in rear seats (2014), and 93% for children in appropriate child restraints (2016). In the three years 2013 to 2015, 34% of vehicle occupant deaths in road crashes were not wearing a safety belt.
Helmet wearing has been compulsory on motorcycles since 1956 if travelling over 50 km/h and since 1973 at all speeds. Compliance is virtually 100%. Helmet wearing has been compulsory on mopeds (up to 50 cc, maximum speed 45 km/h) since 1973.
A helmet has been compulsory on bicycles since 1994.
Distraction
The Land Transport Road User Rule was amended in August 2009 to include a ban on the use of hand-held mobile phones while driving. Based on police records, fatal crashes due to the use of cell phones are not frequent. Mobile phone use continues to be a problem with 60% of New Zealand drivers admitting to using their phone while driving. Publicity campaigns addressing the problem were introduced in 2015.
Fatigue and sleepiness
In 2015 fatigue was identified as a contributing factor in 43 fatal crashes, which resulted in 45 deaths (14%).
National road safety strategies and targets
Organisation of road safety
Road safety in New Zealand is managed through five transport partners. The Ministry of Transport is the government’s principal transport policy adviser and has a dedicated team focused on road safety policy. The Ministry is the lead agency for road safety.
The New Zealand Transport Agency is a Crown agency responsible for the planning and funding of land transport. It produces road safety campaigns and implements road safety policy, integrating road safety aspects into road design and maintenance. It is responsible for developing, constructing, maintaining and operating the state highway network.
The New Zealand Police are responsible for road policing and enforcement. The Accident Compensation Corporation provides “no fault” cover for anyone in New Zealand who is injured in or by a motor vehicle on a public road. It has a major role in accident prevention activities.
Local government is responsible for developing, maintaining and operating the network of local roads, including setting of speed limits and delivering public transport infrastructure and services. Decisions on construction, maintenance and management of the road networks must take into account road safety.
In 1993, road safety policy development was separated from delivery with the creation of a new entity called the Land Transport Safety Authority, now called the New Zealand Transport Agency. Around the same time, traffic policing was absorbed into the New Zealand Police.
Road safety strategy for 2011-20
“Safer Journeys” is New Zealand’s Road Safety Strategy 2010-20, which was released in March 2010. The strategy’s vision is a safe road system increasingly free of death and serious injury, and introduces the Safe System approach to New Zealand.
The government released a 2011-12 Action Plan outlining actions to help achieve the Safer Journeys’ objectives. The action plan assigned responsibility to specific agencies, and progress was monitored by the National Road Safety Committee. A second action plan for 2013-15 was completed in 2015 and a third action plan for 2016-20 was released in May 2016. An interim evaluation was undertaken in 2015. In summary, the evaluation found that “Safer Journeys” was a professionally developed, well regarded, sound road safety strategy, supported by action plans and that it was having a significant and positive impact on wider road safety partnerships; achieving good to excellent results in its priority areas. It recommended that the next action plan focus on motorcycle safety, heavy vehicle and workplace safety, pedestrian and cyclist safety, and technology. The third action plan was informed by this evaluation.
Road safety targets
The Road Safety Strategy 2010-20 does not include a general fatality target, but has several sub-targets and performance indicators.
Crash outcomes and road user behaviour that relate to Safer Journeys’ focus areas are regularly monitored. Other targeted studies are carried out for specific areas such as young driver crashes.
Recent safety measures (2014-17)
Road safety management
Safe System
A series of “signature projects” started in 2014 for challenging public and private, national and regional issues. The Safer Journeys Signature Programme was one of the key actions in the second Safer Journeys Action Plan 2013-15. The programme has a learning focus and demonstrates innovation, while applying safe system principles with the ultimate aim of reducing road casualties. There are currently three projects in the Programme, which involve a number of organisations working in partnership:
-
Visiting Drivers Project – aims to improve road safety for all road users including visitors (domestic and international) while maintaining New Zealand’s reputation as an attractive and safe tourist destination.
-
Future Streets Project – aims to make cost effective changes to urban streets that improve road safety and make walking and cycling easier and safer.
-
Behind the Wheel /Young Drivers Project – aims to support young people to become safe and fully licensed drivers.
A fourth project focused on rural road safety was formally disestablished by the National Road Safety Committee in September 2015. A review of the project identified key lessons learnt including the importance of partners reaching a shared understanding of problems and goals, the need for effective project governance and leadership, and communicating effectively with stakeholders and the wider community.
-
A Safe System film was released in November 2014 to change approaches to and understanding of road safety: www.saferjourneys.govt.nz/about-safer-journeys/the-safe-system-approach/ (accessed 4 July 2017).
Some 400 sector professionals around New Zealand have been trained in the Safe System approach to road safety.
Driving licence
-
Time limits of five years were applied to learner and restricted driver licences in 2014.
-
The NZ Transport Agency and the Accident Compensation Corporation collaborated to produce Drive (www.drive.govt.nz), an online learning tool to help young people become safe, skilled and capable drivers. Drive went live in June 2016. Drive was designed to support individuals on their journey through the Graduated Driver Licensing System (GDLS). There is also information and tools for parents/coaches, instructors and teachers as they are important supporters and key influencers of our young people.
-
A review of the driver licensing system was undertaken in 2015-16. It found that the Driver Licensing Rule could be updated and modernised to make the driver licensing system more customer-focused and reduce compliance costs. Proposals for public consultation closed in June 2016 and law changes are expected in 2017 The proposals included:
-
reductions in eyesight testing requirements to enable online licence renewals
-
streamlining heavy vehicle licensing processes
-
standardising rules around the operation of “special-type” vehicles, such as forklifts, and removing some endorsements
-
strengthening the powers for NZTA to manage course providers.
-
Speed management
-
A speed management programme called Safer Speeds includes a new framework to align travel speeds with road function, design, safety and use. Geospatial data provided mean speeds and traffic volumes for every public road in New Zealand, which was analysed with accident rates. The aim of Safer Speeds is to have a consistent and evidenced-based approach to speed management that is supported by community engagement and better conversations on road risk.
-
One of the initiatives within Safer Speeds was the development of the Speed Management Guide. The Guide provides a national framework that helps road controlling authorities make informed, accurate and consistent speed management decisions in their communities, www.pikb.co.nz/assets/Uploads/Documents/Speed-management-guide-first-edition-Nov2016.pdf (accessed 4 July 2017).
-
The full network of new generation digital static cameras is being gradually expanded. There will be a total of 56 new cameras rotated around up to 200 locations with a history of speed-related crashes.
-
The Better Conversations on Road Risk programme aims to build understanding of road risk resulting in safer choices by communities and individuals. Its approach is based on evidence and focused on quality engagement with stakeholders, media and communities. The New Zealand Transport Agency works closely with Road Controlling Authorities to develop resources that help them engage with their communities, www.nzta.govt.nz/safety/speed-management-resources/better-conversations-on-road-risk/ (accessed 4 July 2017).
Road users
Impaired driving
-
The New Zealand government lowered the BAC for driving from 0.8 g/l to 0.5 g/l for drivers aged over 20 years of age on 1 December 2014.
Cycling safety
-
A Cycling Safety Panel was created in response to a 2013 Coronial Inquiry, which investigated 13 cycling fatalities. The panel made 35 recommendations for central and local government. The NZ Transport Agency published a cycle safety action plan “Making cycling safer and more attractive”. Highlights included the delivery of complete urban cycle networks, nationally consistent design guidance for cycle facilities, the safer speeds programme, and review of the land transport rules including an investigation into a minimum overtaking gap when passing cyclists. The delivery of the Urban Cycleways Programme is well underway in 2017, with the 4-year project ending June 2018. Many of the Programme’s 54 cycleways will be underway or completed by the end of 2017.
Visiting drivers
-
Over the last few years, crashes involving visiting drivers, particularly those from overseas, have gained considerable media and public attention. The Visiting Drivers Project was established with the aim of improving road safety for all road users including visitors (both domestic and international), while maintaining New Zealand’s reputation as an attractive and safe tourist destination.
-
A notable initiative outside of the Visiting Driver Project is the ongoing Bluetooth audio safety messaging trial, which began in June 2016. This technology can deliver audio safety messages to rental car drivers on the Christchurch to Queenstown route. Feedback from the initial research phase of the trial was positive, and transport officials are looking at the next steps for the technology, including possibilities for expanding the route network where the technology is available.
Infrastructure
-
A classification system for the entire road network categorises roads according to their function and sets a consistent and predictable level of service for each category. This can help drivers understand what to expect and how to behave on different categories of road.
-
Investment in operations and maintenance associated with safety improvements will be prioritised to ensure optimal road safety.
Vehicles
-
Electronic Stability Control (ESC) is mandatory on all new and used imported vehicles progressively from 1 July 2015. By 2020, every light vehicle entering the New Zealand fleet will have ESC.
-
The Vehicle Standards Map describes the vehicle technologies and performance standards that government transport officials believe have the greatest potential to improve the safety and resource efficiency of vehicles in New Zealand. Transport officials will use the map to help decide which vehicle features should be promoted or mandated. The map will also keep stakeholders such as road users and the vehicle industry up to date with vehicle policy developments.
-
On 1 February 2017, the new Land Transport Rule: Vehicle Dimensions and Mass 2016 (the Rule) came into force. The Rule regulates the size and weight of vehicles and loads allowed on roads with an emphasis on heavy and very large vehicles. Key changes provided by the new Rule were modest increases in allowable maximum size and weights of vehicles and some additional requirements for managing the movement of very large vehicles and loads.
-
As part of the Government’s Electric Vehicles Programme, the NZ Transport Agency and WorkSafe (New Zealand’s work health and safety regulator) are working with local councils and the private sector to enable a network of public charging stations throughout New Zealand, and are providing information about the regulations people will need to follow if they choose to buy an electric vehicle.
Recent and ongoing research
The following are safety research projects currently active under NZTA’s research programme:
-
the prevalence and impairment effects of drugged driving in New Zealand
-
human factor considerations for driver licensing point system
-
the crash performance of seagull intersections and left turn slip lanes
-
electric bicycle and low-powered vehicle standards and safety
-
post impact care – the fifth pillar – how well New Zealand delivers post impact care through to hospitalisation.
Projects published in 2016 are:
-
Why are some urban traffic signals much less safe than others?
-
Improving safety for people who cycle on rural roads
-
Quantifying the likelihood of barrier strike maintenance
-
Research reports from the New Zealand Transport Agency can be downloaded at: www.nzta.govt.nz/resources/research/reports (accessed 4 July 2017).
References
World Bank (2017), “GDP (constant US$)”, World Development Indicators, http://databank.worldbank.org/data/reports.aspx?source=world-development-indicators (accessed 23 February 2017).
Websites
-
Ministry of Transport: www.transport.govt.nz/ (accessed 4 July 2017).
-
New Zealand Transport Agency (NZTA): www.nzta.govt.nz (accessed 4 July 2017).
-
New Zealand’s road safety strategy to 2020: www.saferjourneys.govt.nz (accessed 4 July 2017).
-
New Zealand Road Assessment Programme KIWIRAP: www.kiwirap.org.nz (accessed 4 July 2017).
Note
← 1. All data stem from the New Zealand Ministry of Transport and IRTAD unless otherwise noted. For more information please contact [email protected] or [email protected].