Chapter 11. Finland
This chapter presents 2015 road safety data for Finland along with provisonal data from 2016. It looks at trends in traffic and road safety from the years 1990 to 2015 and road user behaviour patterns with a special focus on the ageing population. The following sections include data on speed, drink driving, drugs and driving, distracted driving, fatigue and seat belt use. The chapter reviews Finland’s road safety strategy and national targets to 2020 and the progress achieved thus far. It also provides details of all recently implemented safety measures and current and ongoing research.1
The positive safety trend observed over recent years in Finland experienced a downward turn in 2015 with an increase in the number of fatalities by nearly 18% to 270. However, there was a decrease in the number of injury crashes (-2.6%) and those seriously injured (-8.1%). Decreases in fatalities were also seen amongst pedestrians and moped riders. In 2015, the mortality rate per 100 000 inhabitants as well as per billion vehicle-kilometres was at 4.9. Provisional data from 2016 indicate an 11% decrease in fatalities to 240.
Road safety data collection
Definitions applied in Finland
-
Road fatality: A person who died immediately in a crash or within the following 30 days. Suicides and presumed suicides are not removed from the statistics.
-
Injured person (as defined in police reports): A person not fatally injured in a traffic crash, but requiring medical care or observation in hospital, treatment at home (sick leave) or surgical treatment, such as stitches. Persons who sustain bruises or scratches that do not require the aforementioned treatment are not accounted for as “injured”. The classification “injured” is determined by the police officers present at the scene of the crash.
-
Seriously injured person: A person who suffers injuries with a score of three or above on the Abbreviated Injury Scale (MAIS3+).
Data on serious injuries have been reported from 2014 onwards and are integrated into the Statistics Finland database. This contains crash data reported by the police, complemented by injury severity information coming from the health care database.
Data collection
Traffic crash data in Finland are collected through two different channels: the police and the insurance companies.
Statistics Finland receives data on road traffic crashes from the police. Local police districts transfer the data to a central register, from which new data are processed and transferred to Statistics Finland three times a month. Statistics Finland verifies the data, makes further enquiries to the police districts and, where necessary, supplements the data with data from other registers.
Statistics Finland supplements its annual data with data on deaths derived from statistics on causes of death. The data are also supplemented with information on crash locations from the Finnish Transport Agency’s Digiroadzp information system; data from the Rescue Services’ PRONTO statistics on resources and crashes; data on coercive measures from Justice Statistics; and data on fatal drink-driving crashes from the road crash investigation teams. Data on road traffic crashes are also supplemented annually by the Finnish Transport Safety Agency’s data on driving licences and motor vehicles.
Statistical coverage of fatal crashes is 100%. Reporting is controlled using death certificates. Coverage of injury crashes is about 20%. Coverage is worst for cyclists injured in single crashes. Many of the injury crashes are not reported to the police because, in a number of cases, the injuries are slight and compensation is settled between the parties involved.
In addition to statistics based on police reporting, the Traffic Safety Committee of Insurance Companies (VALT) compiles and publishes statistics on crashes investigated by the road crash investigation teams and crashes for which insurance compensation has been paid. The road crash investigation teams investigate nearly all fatal road traffic crashes in Finland. It is most useful in the case of damage-only crashes, as many minor crashes are reported to the insurance company but not to the police.
Hospitals and health centres also compile statistics on cases of traffic crashes, but the data collected are mainly intended for health-care services and cannot be properly used for traffic safety purposes. These data can be used as supplementary material, as they contain information excluded from other statistics, such as injuries caused in pedestrian and bicycle traffic.
Since 2014, police and hospital data have been linked to facilitate correct estimation of the number of serious injuries (defined as MAIS3+). More information can be found at: http://tieliikenneonnettomuudet.stat.fi/tieliikenneonnettomuudet_en.html (accessed 4 May 2017).
Most recent safety data
Road crashes in 2016 – provisional data
Based on provisional data, there were 240 road fatalities in 2016, 30 less than in 2015 representing a decrease of 11%. The number of reported injury crashes decreased by 9% compared to 2015.
Road crashes in 2015
Overall, the positive safety trend observed in the past years was reversed in 2015, as the number of road deaths increased by nearly 18%, compared to 2014. However, there was a decrease in the number of injury crashes (-2.6%) and those seriously injured (-8.1%).
While the numbers of fatal crashes involving cyclists, motorcycles and passenger cars increased, the number of those killed amongst moped riders and pedestrians decreased.
The number of fatal moped crashes has been decreasing since 2011, when a mandatory training and driving test for moped riders was introduced, reaching a record low of 2 fatalities in 2015.
Trends in traffic and road safety (1990-2016)
Traffic
In the last 25 years (1990-2015), the distance travelled has increased by almost 39%. More recently, over the last 10 years, the distance travelled by cars and vans has increased by 7% only. In 2012 and 2013, it decreased slightly from the 2011 level, probably as a result of the economic downturn. In 2014 and 2015, the distance travelled once again increased.
Road safety
Crashes and casualties
Between 1990 and 2015, the number of deaths decreased by 58%. In recent years (2000-15), deaths decreased by about 32%. Overall, pedestrian, cyclist and moped rider fatalities and those in urban areas decreased more than fatalities for car occupants or motorcyclists and those in rural areas, with slight variations in the trends for pedestrians and cyclists for some recent years.
No single measure can be identified as the main reason for this positive road safety development. Between 2000 and 2015, a number of measures were implemented, including:
-
lower speed limits in most urban areas
-
construction of pedestrian and bicycle paths
-
construction of 260 km of motorways
-
installation of automatic speed cameras on nearly 2 000 km of main roads
-
reform of driver education
-
renewal of the car fleet, with better safety performance and occupant protection than 15 years ago.
Rates
Since 1990, the death rate per 100 000 inhabitants has decreased by more than 62% and the death rate per billion vehicle-kilometres by 70%. In 2015, the death rates per 100 000 inhabitants as well as per billion vehicle-kilometres were at 4.9.
Analysis of seriously injured data
Data on serious injuries have been reported and integrated into the Statistics Finland database since 2014. In 2015, 477 persons injured in a traffic crash reported by the police had an MAIS of 3 or above and were considered seriously injured. This is 8% less than in 2014. In 2010, there were around 800 seriously injured persons (Trafi, 2014); however the conversion from the International Statistical Classification of Diseases (ICD10) to the Abbreviated Injury Score (AIS) was somewhat different in the 2010 estimation.
Statistics Finland have also provided unofficial figures for serious injuries found in hospital data with the reason code “traffic accident” but they do not match police data. In 2014, 434 seriously injured people were reported in hospital data and 399 in 2015. Of those seriously injured 55% were cyclists.
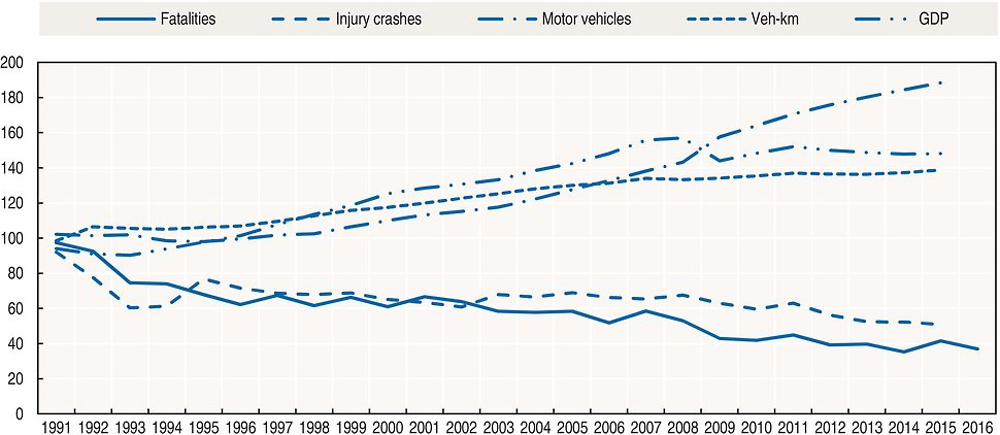
Source: World Bank (2017) (GDP; constant prices).
Road safety by user group
All user groups have benefited from important safety improvements since the 1990s. Cyclist and pedestrian user groups benefited the most from the progress in safety. There has also been a sharp drop in fatalities among moped riders.
However, the safety situation for motorcyclists has deteriorated since 2000. There were 10 motorcyclists killed in 2000 and 20 in 2015. Motorcycling grew rapidly in the 2000s and the number of registered motorcycles increased by 150% between 2000 and 2010 (from 90 000 to 226 000 units). A positive change was observed in 2014, with 7 fewer motorcyclists killed. However, in 2015 the number of fatality crashes among motorcyclists increased again. There is no data on motorcycle traffic volume, and therefore it remains unclear whether the positive or negative trend in motorcycle fatalities and crashes is due to changes in traffic volume.
Injury crashes involving mopeds more than doubled between 2000 and 2008, probably due to the increase of the moped fleet, which increased by more than 150% between 2000 and 2010. In 2012-16 there were significantly fewer moped crashes, due to new legislation requiring mandatory driving lessons and a driving test for moped riders, along with a decrease in registration of new mopeds.
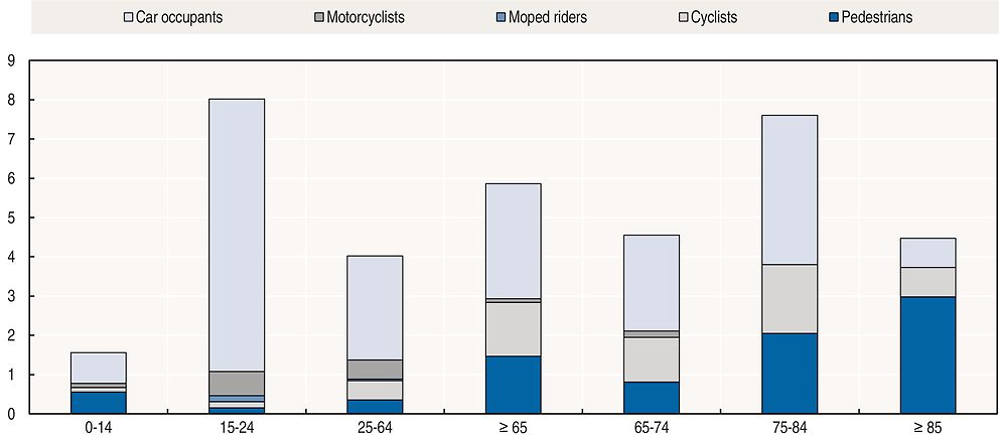
Road safety by age group
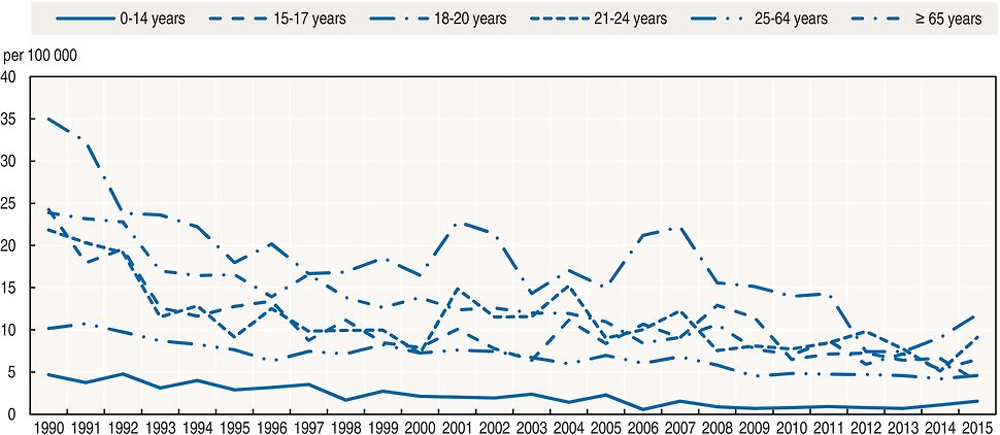
Since 1990, the reduction in fatalities has benefited all age groups, with the most impressive reduction for the youngest groups of 0-14 and 15-17. In these groups fatalities decreased between 70% and 84% respectively.
While the 18-20 age group has a mortality rate much higher than the other age groups, it has been reduced by 50% between 2010 and 2012-13, with a fatality rate of 7 per 100 000 population in 2012-13. In 2014 and 2015, however it increased again with a fatality rate of 12 per 100 000 in 2015.
For the over 65 population, the mortality rate has been reduced by 3.5 times since 1990, from 24 deaths per 100 000 population in 1990 to 7 in 2015.
In 2015, the 65+ age group represented 20.5% of the population compared to only 15% in 2000. The share of senior citizens in the population increased rapidly in the 2000s when the baby boomers entered this age group, and is expected to reach 27% by 2050.
The number of driving licence holders over 65 has also increased. There were 388 000 in 2005 and 705 000 in 2015, and their number is expected to increase.
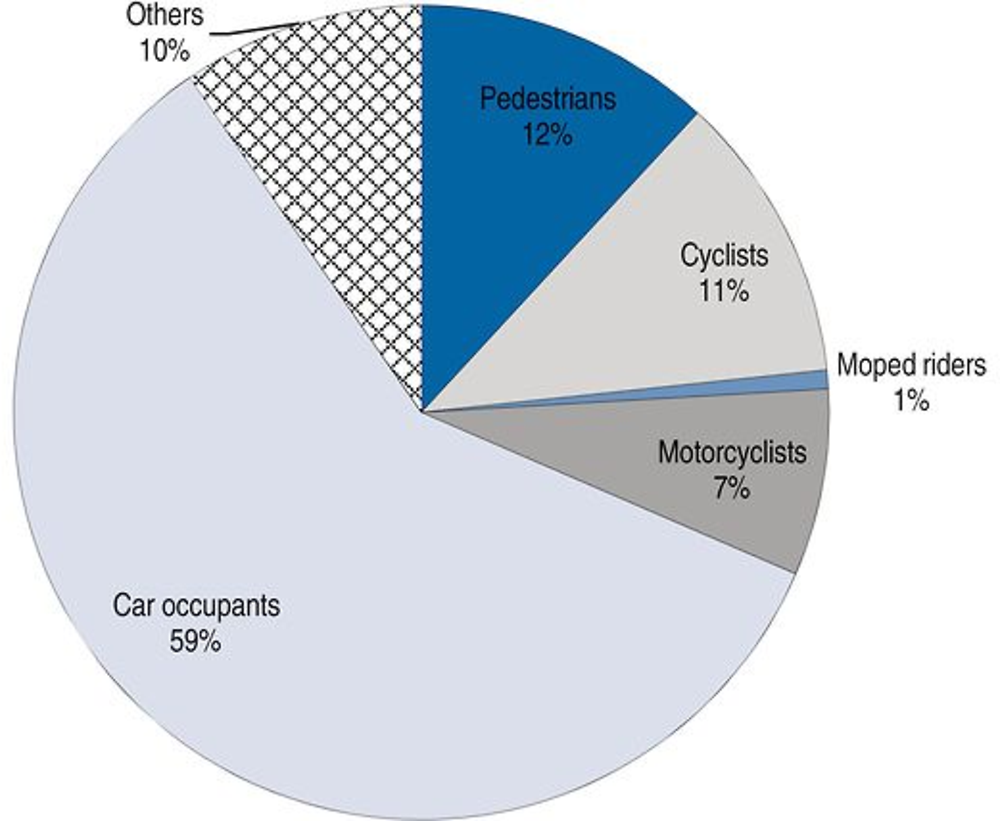
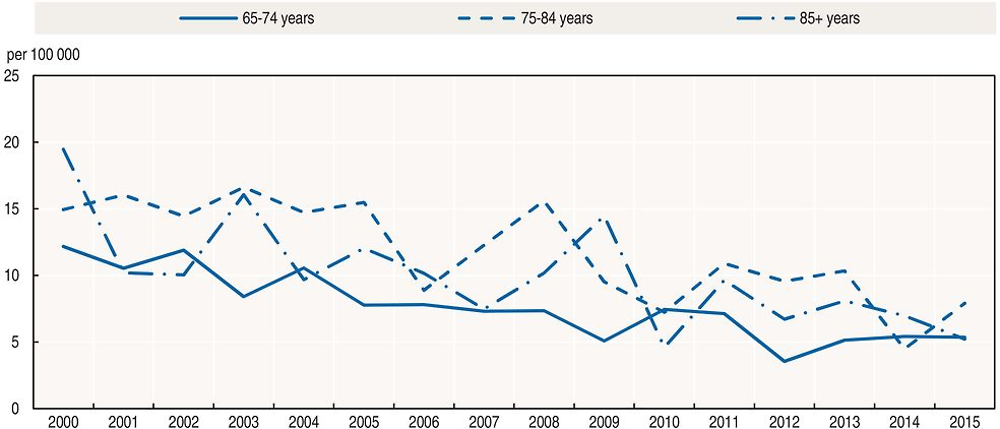
Traffic fatalities among the older population has declined by 38% since 2000, while the total number of deaths declined by 32%. The number of injured people has remained approximately the same. The majority (52%) of older persons killed are car occupants.
Car driving licences are valid until the licence holder reaches the age of 70. To renew their licences, older drivers must provide a medical certificate or a comprehensive medical report. The license is then renewed for a period of 5 years, or less if the medical report requires so. If there is reason to believe that the holder of a driving license no longer meets the health requirements or that he/she is no longer able to drive safely due to his health, the police may order the driver to submit a medical report or new driving test. More information can be found at: www.trafi.fi/en/road/i_have_a_driving_licence/renewing_your_driving_licence (accessed 5 May 2017).
There has been some discussion on the effectiveness of medical tests. A study was made in 2014 which suggested that age-based medical examinations for elderly drivers are more likely to have a negative impact on traffic safety and infringement-free driving than a positive one (Trafi, 2014).
Recent important measures to improve the safety of the senior population include:
-
Better intersection designs so that they are easier to perceive. In particular this concerns ramp designs at the entrance of motorways to prevent entering via the wrong direction.
-
Similar infrastructure measures which are beneficial for all pedestrians and cyclists: lower speed limits in built-up areas together with infrastructure which supports lower speeds.
-
Better assessment of the fitness to drive. Transport Medicine Units have been established in the largest hospitals.
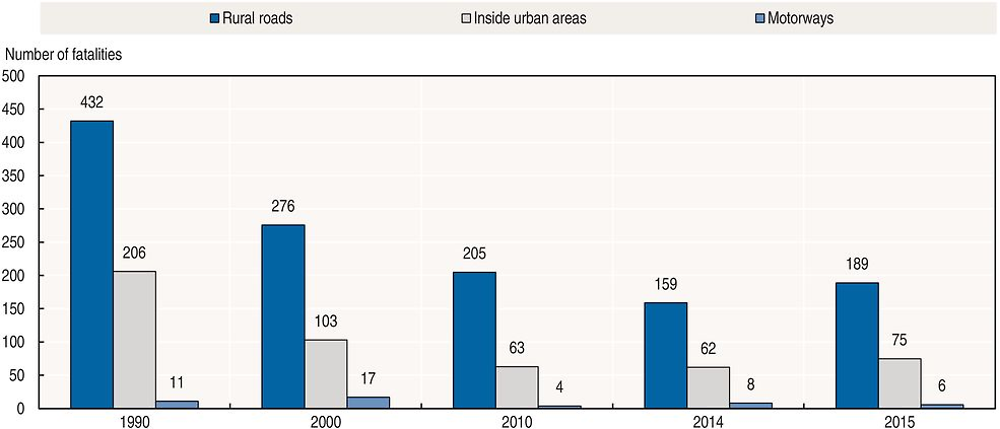
Road safety by road type
In 2015, 70% of fatalities occurred on rural roads, 28% in urban areas and 2% on motorways. Since 1990, the reduction in deaths has been greater on urban roads.
Approximately one-third of fatalities are due to frontal crashes, which typically occur on main roads outside built-up areas. Another third of fatalities are run-off-road crashes, typically on small country roads. Finland only has about 890 kms of motorway, and they account for a minor share of crashes. High-risk roads are usually those with a single carriageway, no central fencing and 80 km/h or 100 km/h speed limits.
Economic costs of traffic crashes
The economic and social cost of road crashes is estimated based on actual medical and intervention costs (health care, police, fire brigade, etc.); loss of production calculated through an estimate of lost labour time; and loss of human well-being estimated on the basis of a willingness-to-pay method using values from other Nordic countries.
Cost analysis is conducted and updated every five years. In the latest update, health care information on crash severity was integrated to improve the estimates of health costs.
In 2015, the cost of road crashes based on police reported crashes was EUR 1.3 billion. This does not include costs associated with non-reported crashes.
Trafi is currently working in defining a monetary value for MAIS3+ (TRAFI, 2016).
A new estimation of road crash costs, based willingness-to-pay estimates from Sweden, will be conducted in the coming years.
Property damage costs are probably underestimated, as property damage only crashes, which do not require further police investigation, are not included in the crash database.
Recent trends in road user behaviour
Speed
According to reports from the road crash investigation teams, speeding or inappropriate speed is a contributing factor in 30% of all fatal crashes.
There have not been any major changes in mean speed over the past 10 years. Reduction of the mean speed by 1-3 km/h has been observed on road sections where speed cameras have been installed. While a high proportion of drivers exceed the speed limit, especially during the winter months when speed limits are lowered, the percentage of drivers speeding 10 km/h above the limit is relatively low. In 2015, 10% of drivers exceeded the speed limits by more than 10 km/h in summer and 14% in winter on main roads.
Speed cameras, implemented mainly during the 2000s, cover around 3 000 km of main roads. There are less speeding offences at police speed camera sites.
The table below summarises the main speed limits in Finland.
Drink driving
The maximum authorised blood alcohol content (BAC) is 0.5 g/l for all drivers. In 2015, it was estimated that 21% of fatal crashes involved a driver with a BAC above the 0.5 g/l limit (this share was 24% in 2010, 25% in 2011, 17% in 2012 and 22% in 2013). It is typical in alcohol-related fatal crashes that the driver is strongly intoxicated. In 2015, 84% of drivers responsible for a fatal crash exceeded 1.2 g/l, the limit of aggravated drunk driving.
Those who die in drunk-driving crashes are most often the drunk drivers themselves. From 2014-16, 71% of killed persons were drunk drivers, 20% were their passengers and 9% were others.
The percentage of drivers under the influence of alcohol in traffic has slowly decreased from 0.25% in 1990. In 2015 and 2016, 0.13% of drivers had a BAC above the legal limit.
Drugs and driving
In 2015, 14 drivers involved in fatal crashes were suspected of driving under the influence of drugs.
Distraction
In Finland, it is forbidden to drive with a hand-held mobile phone, while hands-free devices are tolerated. Around three fatal crashes every year are related to mobile phone use while driving (Jääskeläinen, 2014).
Seat belts and helmets
Seat belt use has been compulsory for front seats since 1975 and for rear seats since 1987. There has been a significant increase in seat belt use by car drivers since 1980.
Based on monitoring by Liikenneturva, in 2016, the seat belt wearing rate was 96% for front seats on rural roads, 95% for front seats on urban roads, and 85% for rear seats on urban roads.
According to the road crash investigation teams, 41% of car or van occupants killed were not wearing a seat belt. It is estimated that 100% seat belt usage would have saved 19 lives in 2015.
Under Finnish law, children under 135 cm in height must wear a safety device determined by their weight when in a car.
Helmet wearing is compulsory for all motorcycle and moped riders.
Although, since 2003, the traffic law has strongly recommended cyclists to wear helmets, this is not enforced. The bicycle-helmet usage rate was 25% in 2004 and reached 43% in 2015. Most small children wear helmets, but teenagers and elderly people tend not to do so. The usage rate in the Helsinki area is about 70%, but rates in northern Finland are much lower.
National road safety strategies and targets
Organisation of road safety
The Ministry of Transport and Communications is responsible for drafting legislation concerning road safety.
The Ministry’s main agencies involved in road safety are:
-
The Finnish Transport Agency, which is responsible for road design, construction and maintenance, and for road and traffic signs.
-
The Finnish Transport Safety Agency, which is responsible for vehicle registration, supervision of driving schools and driving licence operations, and organisation of matters related to vehicle inspection. The agency’s responsibilities also include campaigning for road and traffic safety.
-
Liikenneturva (Finnish Road Safety Council) which implements campaigns for road and traffic safety, disseminates information, contributes to road safety education for various age groups and provides further training for drivers.
Road safety strategy
The road safety programme for the years 2012-14 ended. A new resolution on road safety was approved by the Government on 15 December 2016 (www.lvm.fi/en/-/government-resolution-on-road-safety-looks-into-the-future-914474; accessed 5 May 2017). The long-term vision of the resolution is that no-one would be killed or seriously injured on the road. The resolution outlines measures that will promote road safety related to drivers, vehicles and roads alike and creates preconditions for increasing automation and the use of digital data in transport.
Road safety targets
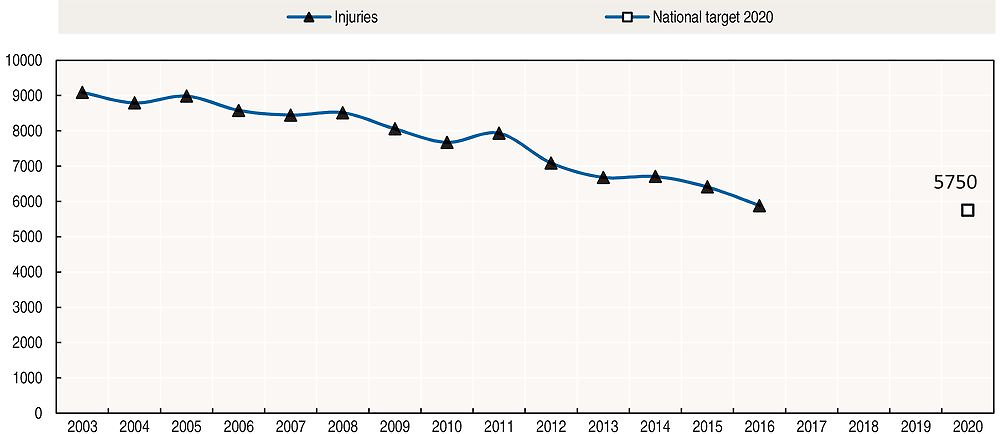
The target for 2020 is based on the target set by the European Commission to reduce by half the number of fatalities by 2020 compared to 2010 level. In addition, there is a target to reduce by 25% the number of persons seriously injured.
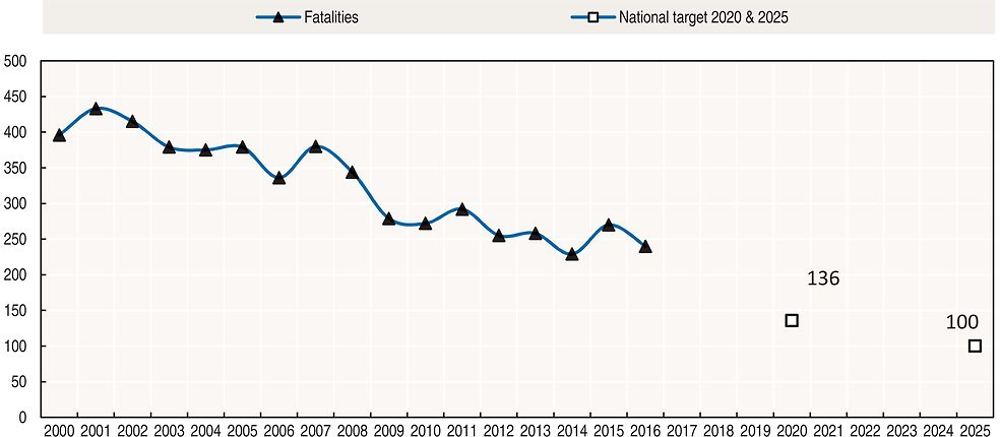
The corresponding numerical targets are:
-
fewer than 137 fatalities (or 24 fatalities per million inhabitants) by 2020
-
fewer than 5 750 police-reported injuries by 2020
-
long-term target of fewer than 100 fatalities by 2025.
At the current pace, it is estimated that the 2020 target will be reached for injuries but not for fatalities.
Recent safety measures (2014-17)
Road safety management
Transport companies
-
The Transport Safety Agency has developed a voluntary management and practice model for road transport companies. It provides practical guidance for responsible, economic, safe, and high-quality operating.
Driving license
-
In October 2016, the Ministry of transport published a memo on a new driver education reform which is open for comments. The memo proposes a single-phase education with less regulation on education’s contents, in comparison to current graduated driving license.
-
Some driving schools are now permitted to test after a lower amount of mandatory theory and driving lessons for the first phase of the passenger car driving licence. In this test the minimum number of theory lessons is 10 hours (instead of 19) and the minimum number of driving lessons is 10 hours (instead of 18).
Traffic rules
-
The total overhaul of the Road Traffic Act has transitioned to the statement phase. The draft proposal contains, among other things, the traffic rules as well as the regulations affecting traffic management, vehicle behaviour and breaking the law. The current valid law dates from 1981, and it has been supplemented by innumerable statutes from various years. With this big renewal, the regulatory framework will be streamlined to replace the ambiguities and shortcomings of the old legislation as well as prepare road transport for rapid technical advancement and automation.
Road users
Enforcement
-
Almost all fixed fines were doubled in September 2015. Now the lowest fine is EUR 20 and the largest EUR 200. Speeding is the most common reason for a fixed fine.
-
Installation of plate-recognition devices in police cars started in 2014. As of November 2016 around 300 devices were in use.
Vehicles
-
Finland’s vehicle fleet is one of the oldest in the European Union. The average age of passenger cars in traffic is 11 years. A trial incentive programme for car scrappage was conducted in 2015 to promote the replacement of old vehicles with modern vehicles. Around 8 000 old cars were replaced by new vehicles producing carbon dioxide emissions of 120 g/km or less. This was not continued in 2016.
-
At the beginning of 2016, a new classification for new types of very light electric vehicles came into force. Vehicles such as senior scooters and electric skateboards with a maximum speed of 15 km/h and a maximum power of 1 kW are considered as “pedestrians”. These devices are allowed on the sidewalk when travelling at walking speed and on bicycle paths when travelling at higher speeds. Vehicles with a maximum speed of 25 km/h and a maximum power of 1 kW power are considered as “bicycles”. In 2017, the number of these vehicles remained low.
-
Winter wheels became mandatory for heavy vehicles from January 2017.
-
Finland is developing an Arctic Intelligent Transport System (ITS) test site for automated driving, designed for verifying and validating new ITS solutions and innovations in Arctic conditions with extreme seasonal changes. An Arctic testing ecosystem for intelligent transport and automated driving is being built in Finnish Lapland. The improvement of highway E8 is underway to meet the requirements of the public test area (see www.snowbox.fi/, accessed 5 May 2017).There are now several automated driving or other ITS tests and test sites in Finland:
-
Aurora test site in Lapland, www.liikennevirasto.fi/web/en/e8-aurora#.WN4v42_yjIU (accessed 5 May 2017).
-
Nordicway Coop connected vehicle pilot project in southern Finland, www.trafi.fi/en/about_trafi/news/3472/finland_joins_a_nordic_connected_vehicle_pilot (accessed 5 May 2017).
-
Living Lab Bus – Open innovation and test platform for the development, testing and demonstration of various services and technologies in public transport, http://livinglabbus.fi/ (accessed 5 May 2017).
-
Robot bus experiment in real traffic, http://sohjoa.fi/in-english (accessed 5 May 2017).
-
High capacity vehicles
-
Special permits for High Capacity Transport vehicle combinations have been granted since November 2013. In spring 2017, there were 26 vehicle combinations in use, transporting sea containers, timber and foodstuff.
Recent and ongoing research
-
Suicides in road and rail transport: A feasibility study. www.trafi.fi/filebank/a/1474275404/fefaba00bf78053625648cb56e0a994e/22452-Trafin_tutkimuksia_7_2016_Itsemurhat_ liikenteessa.pdf (accessed 5 May 2017).
-
Calming traffic and to improving the safety of pedestrian crossings: Case Turenki. www.trafi.fi/filebank/a/1473313266/66eba0b5ec6adaceab5cf51da341f2b2/22378-Turengin_ suojatieselvitys_loppuraportti_FINAL.pdf (accessed 5 May 2017).
-
Automatic speed enforcement on Ring Road I in Helsinki area: A before-after-study. www.trafi.fi/filebank/a/1484560717/4ff0370cd96a15b00e783cf4bc3e6ef7/23805-Trafi_01_ 2017_Keha_I_ennen-jalkeen-tutkimus_raportti_.pdf (accessed 5 May 2017).
-
Road safety in Finland and Sweden: A comparison of associated factors. www.trafi.fi/filebank/a/1453805909/bf0e9e4f3f9492480bc0b561d4d99217/19608-Trafin_tutkimuksia_2-2016_-_FINENS_report_20_01_2016.pdf (accessed 5 May 2017).
-
Cost-effective middle barrier solutions. www2.liikennevirasto.fi/julkaisut/pdf8/lts_2016-02_ kustannustehokkaat_keskikaideratkaisut_web.pdf (accessed 5 May 2017).
-
Safety of road intersections: A review of accidents from 2011 to 2015. www2.liikennevirasto. fi/julkaisut/pdf8/lts_2016-57_maanteiden_tasoliittymien_web.pdf (accessed 5 May 2017).
References
Official Statistics of Finland (OSF), Statistics on road traffic accidents, www.stat.fi (accessed 5 May 2017).
Finnish Transport Safety Agency (Trafi), Finnish Road Traffic 2015: Safety and environmental impacts, http://katsaukset.trafi.fi/media/katsaukset/tieliikenne/finnish-road-traffic-2015.pdf (accessed 5 May 2017).
Finnish Transport Safety Agency (Trafi), Finnish Road Traffic 2014: Safety and environmental impacts, http://pinnalla.trafi.fi/e-julkaisut/finnish_road_traffic_2014/pdf/Trafi__Finnish_roadtraffic_2014_EN.pdf (accessed 5 May 2017).
Finnish Transport Safety Agency (Trafi) (2014), Ajokortin uusintaan liittyvien ikäkausitarkastusten vaikutus liikennemenestykseen (The impact of driving license revision related to road traffic offsets), www.trafi.fi/filebank/a/1394024746/d14a9dd33fc059d7bfde272b04cd2fab/14340-Trafin_tutkimuksia_02-2014_-_Ikakausitarkastusten_vaikutus_liikennemenestykseen.pdf (summary in English; accessed 5 May 2017).
Finnish Transport Safety Agency (Trafi) (2014), Tieliikenteessä vakavasti loukkaantuneiden määrän arviointi VAAKKU (Evaluation of the number of people seriously injured in road traffic), www.trafi.fi/filebank/a/1416923679/b8f9e9b07b0dca1231c3958a3c995e52/16298-Trafin_tutkimuksia_10-2014_-_Vakavasti_ loukkaantuneet.pdf (accessed 5 May 2017).
Finnish Transport Safety Agency (Trafi) (2016), Tieliikenteen onnettomuuskustannusten tarkistaminen (Validating road traffic accident costs), www.trafi.fi/filebank/a/1465820007/76d4b29cc 9424288b707133f5259494d/21751-Trafin_tutkimuksia_5_2016_Tieliikenteen_onnettomuuskustannusten_ tarkistaminen.pdf (summary in English; accessed 5 May 2017).
World Bank (2017), “GDP (constant US$)”, World Development Indicators, http://databank.worldbank.org/data/reports.aspx?source=world-development-indicators (accessed 23 February 2017).
Websites
-
Finnish Transport Safety Agency (Trafi): www.trafi.fi (accessed 5 May 2017).
-
Ministry of Transport and Communications: www.lvm.fi (accessed 5 May 2017).
-
Finnish Transport Agency: www.liikennevirasto.fi (accessed 5 May 2017).
-
Liikenneturva – Finnish Road Safety Council: www.liikenneturva.fi (accessed 5 May 2017).
-
Statistics Finland: www.stat.fi/index_en.html (accessed 5 May 2017).
Note
← 1. All data stem from the Finnish Transport Safety Agency (Trafi) and IRTAD unless otherwise noted. For more information please contact: [email protected].