Chapter 8. Chile
This chapter presents 2015 road safety data for Chile along with provisional data from 2016. It looks at trends in traffic and road safety from the years 2000 to 2015 and road user behaviour patterns with a special focus on the ageing population. Data on speed, drink driving, drugs and driving, distracted driving, fatigue and seat belt and helmet use is also included. The chapter reviews Chile’s road safety strategy and the most recently implemented safety measures.1
Between 2000 and 2015, fatalities in Chile fluctuated with no clear trend emerging. This can be explained in part by the exponential increase in the number of vehicles (124%) and motorcycles (515%) on the roads during this same period. In 2015, there were 2 140 road deaths in Chile, a 1% increase over 2014, equalling a fatality rate of 11.9 per 100 000 inhabitants. Provisional data from 2016 indicate a further increase of 1.7% to 2 176 fatalities.
Despite a reduction in pedestrian fatalities in 2015, this group still represents 34% of all fatalities, second only to car occupants, with the 25-34 year age group most affected. In 2015, motorcyclists became the focus of a new government safety plan following a dramatic increase (80%) in fatalities since 2010 with a 24% increase seen in the year between 2014 and 2015.
Road safety data collection
Definitions applied in Chile
-
Road fatality: A person who dies from injuries within 24 hours of the crash. To conform to international definitions being a death within 30 days, the National Road Safety Commission (CONASET, Comisión Nacional de Seguridad de Tránsito) applies a correction factor of 1.3. Fatality data in this report correspond to the corrected data.
-
Person seriously injured: A person injured and hospitalised for more than 24 hours.
Data collection
Following a traffic crash, the police (Carabineros de Chile) attending the site of the accident are responsible for filling out a Data Collection Form of Road Traffic Accidents (SIEC 2), which is used throughout the country. The information is later entered and stored in a road traffic crash database available to the police. In cases of crashes involving deaths or serious injuries, the crash report is sent by the police to the relevant judges. The police records only include data for the first 24 hours after the crash has occurred.
The official data, on the other hand, is generated through the National Vital Statistics Agreement (CNEV, whose members are the National Statistics Institute, the Ministry of Health and the Civil Registry and Identification Service). The cause of death is coded by the Ministry of Health using the International Statistical Classification of Diseases and Related Health Problems (ICD-10). The most recent information from the National Vital Statistics Agreement is from 2014. The collection and validation process also involves cross checking with police data. This process is not yet automated, which explains the delay in reporting data on vital statistics.
Due to these challenges, to standardise the number of deaths to those occurring up to 30 days after the crash and in accordance with the criteria set by the World Health Organisation (WHO), a correction factor of 1.3 is applied to the death data received from the police. CONASET is currently working together with the police and other relevant institutions to develop an improved form and to create a new database with automated linkage between police and health data. The new system is expected to start its trial phase in 2017.
Most recent safety data
Road crashes in 2016 – provisional data
Based on provisional data, there were 2 178 road fatalities in 2016, an increase of 1.8% when compared to 2015.
Road crashes in 2015
In 2015, there were 2 140 reported road deaths in Chile, 1% more than in 2014. The number of injury crashes also slightly increased by 0.7%.
Despite a reduction in pedestrian fatalities in 2015, pedestrians are the second user group the most affected by traffic crashes and represented 34% of all road fatalities. The 25‐34 year age group is the most impacted.
Trends in traffic and road safety (2000-15)
Traffic
Between 2000 and 2015, the number of motorised vehicles more than doubled (124%), with the number of motorcycles multiplied by more than five times from approximately 30 000 to over 170 000 (515%).
There is a greater vehicle concentration in the main cities. As a consequence, congestion is increasing, especially during rush hours. Infrastructure is being developed and new public transportation alternatives are under construction.
Road safety
Crashes and casualties
Between 2000 and 2015, fatalities have fluctuated with no clear trend emerging. The lowest value of 1 960 was observed in 2009 and the highest at 2 317 was observed in 2008.
Two important measures were implemented in 2014: the reform of the driving licence procedure, with new theoretical and practical exams; and the adoption in September 2014 of “Emilia’s Law” which increases the severity of punishment for drunk drivers who cause serious injuries or death.
Rates
In 2015, Chile had a fatality rate of 11.9 fatalities per 100 000 inhabitants. Since 1990 the rate has decreased by 24%.
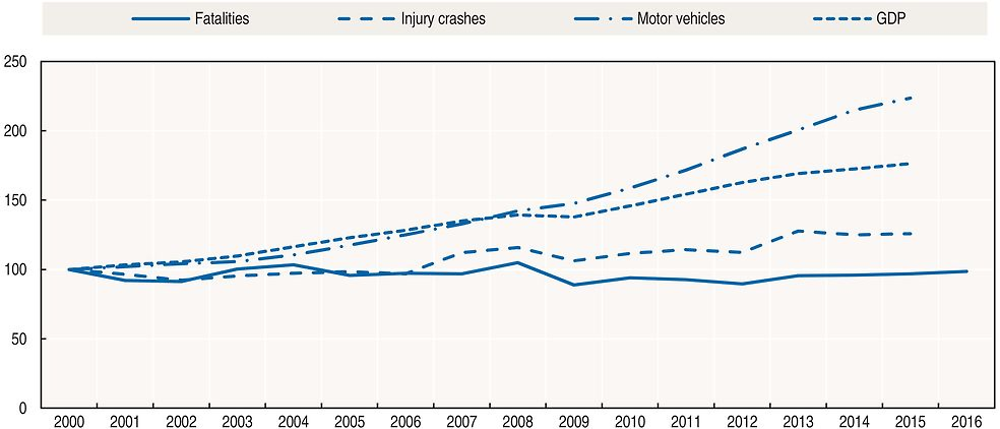
Source: World Bank (2017) (GDP; constant prices).
Road safety by user group
Pedestrians are the second user group, after car occupants, most affected by road crashes, representing in 2015, 34% of all road deaths. This is a very high proportion when compared with other OECD countries. In 2015, an improvement was observed with a reduction of 8% in the number of pedestrians killed.
As in many Latin American countries, the safety of motorcyclists is a growing concern. While the motorcycle fleet is still relatively small, it is expanding rapidly. As a consequence, since 2010 the number of motorcyclists killed has increased by 80%. Between 2014 and 2015, i.e. in just one year, it increased by 24%. To respond to this new challenge, in 2015, the government launched a national plan to improve the safety of motorcyclists. It includes 35 targeted measures, including a graduated licensing system, a more rigorous driving exam and infrastructure improvement (see also the section on recent road safety measures).
Overall in 2015, the number of road deaths increased for all user groups, except pedestrians, the highest increase being observed for motorcyclists (+24%) followed by cyclists (+15%).
Road safety by age group
Road crashes are the primary cause of external death in children aged between 1 and 14.
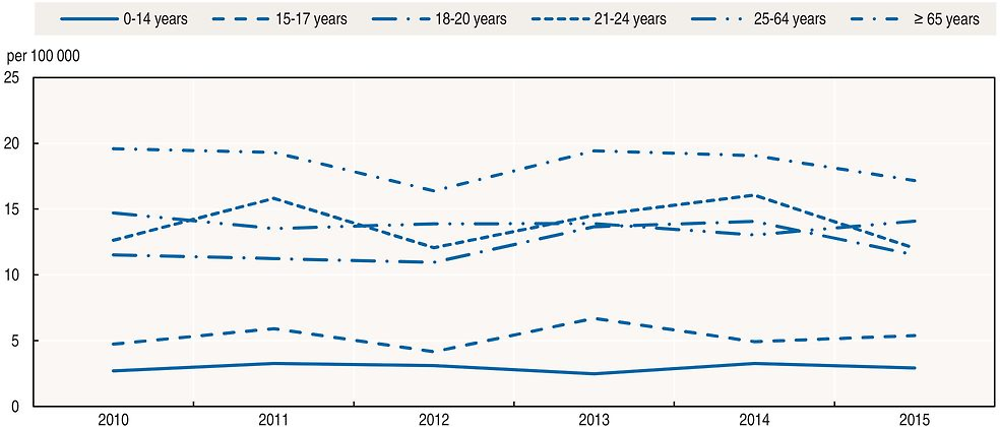
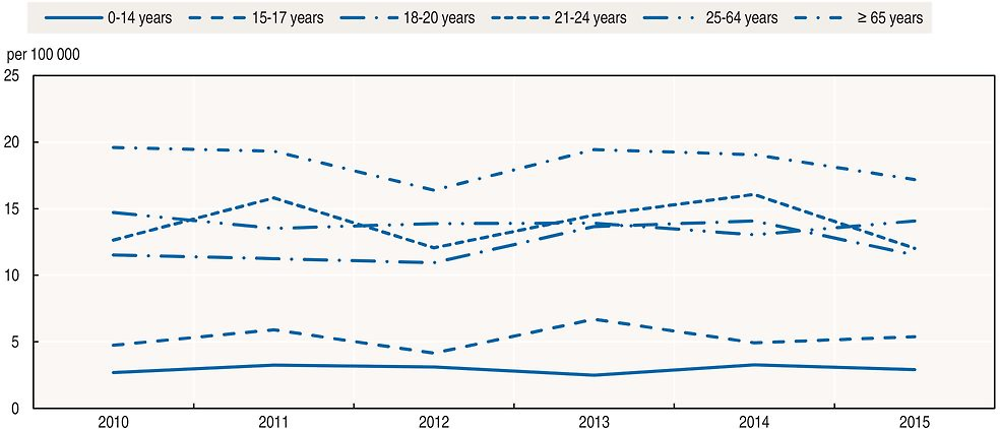
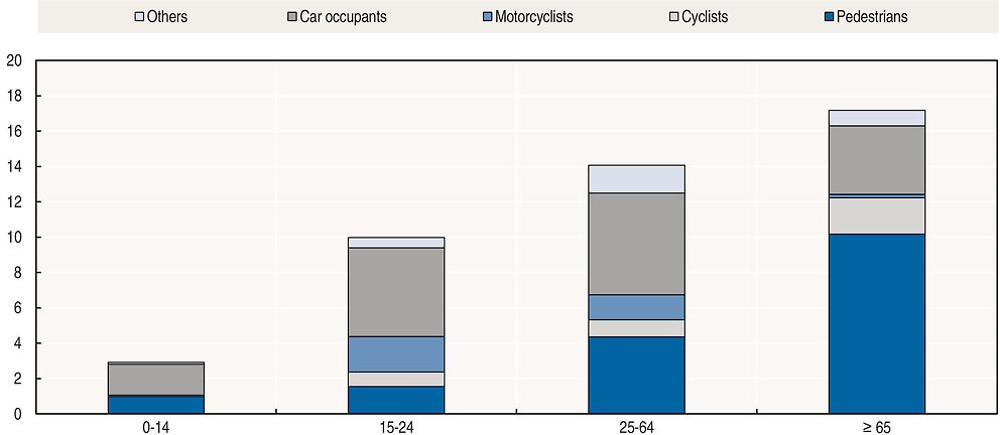
Senior citizens (65+ years old) are the most at risk in traffic, with a mortality rate of 17 deaths per 100 000 inhabitants. They are particularly vulnerable as pedestrians and cyclists. Unlike many other OECD countries, young people have a relatively low mortality rate when compared to the other age groups.
In 2015, fatalities decreased markedly for young people (18-24 years old). Also since 2010, they are the only age group for which the number of fatalities decreased.
In 2015, the over 65 age group represented around 10% of the total population. The population growth rate was at 1.04% but is expected to drop to 0.89% by 2020. In 2015, there were 73 people over 65 for 100 people under 15. This rate is expected to grow to 88 in 2020.
Elderly people are particularly vulnerable as pedestrians. More than 60% of the over 65s killed in traffic are pedestrians.
In Chile, the driving licence must be renewed every six years and every four years for professional licenses (trucks and buses). There is no age limit set by law to renew a driver’s license and the requirements for renewal are the same regardless of age. To renew their licence, drivers must pass a medical exam, including a vision and hearing evaluation. The doctor in charge of the evaluation can recommend not renewing the licence or renewing it for a shorter period, based on the driver’s fitness. The doctor can also request additional exams to evaluate the driver’s mental state. Mental acuity tests were introduced in 1985, and to date there is no evidence of their effectiveness in evaluating drivers.
Road safety by road type
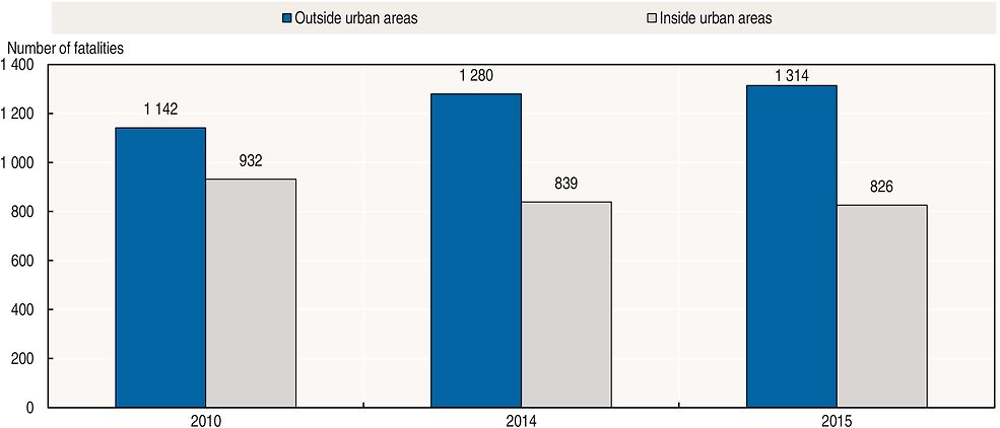
In 2015, 61% of road fatalities occurred on roads outside urban areas.
Economic cost of traffic crashes
To assess the cost of road crashes, CONASET has reviewed several methodologies. As a starting point, it uses the 2011 “simplified methodology of estimates of social benefits due to the reduction of accidents in interurban roads” from the Road and Urban Transport Program (SECTRA-MDS [2011]) of the Ministry of Transportation and the Ministry of Social Development. This methodology takes into account material damage to vehicles, treatment of injured people, administrative costs and loss of productivity (human capital approach). In addition, CONASET uses the “willingness to pay” (WTP) approach to evaluate the benefit of preventing a road death, based on a 2014 study “Estimation of the statistical value of life related to atmospheric pollution and traffic accidents” commissioned by the Environment Vice Ministry (GreenLabUC, 2014).
As a result, the estimated cost of traffic crashes for 2015 was USD 4.9 billion equivalent to approximately 2.5% of Chile’s GDP.
Recent trends in road user behaviour
Speed
A study conducted in 2014-15 revealed that at any given time 50% of drivers exceed the speed limit on interurban roads and 40% in urban areas. The research also showed speeding was more prevalent during the night and at weekends. Another study (CONASET, 2014-15) also found that roads with a median barrier separation contributed to speeding.
It is roughly estimated that speeding is responsible for around 30% of fatal crashes.
In August 2015, the Ministry of Transportation and Telecommunications submitted a bill to congress that proposes reducing the urban speed limit from 60 to 50 km/h. This law is expected to be voted on by parliament in 2017.
Drink driving
In 2012, the government of Chile introduced a new law to support the zero tolerance policy for drunk driving. It sets the maximum permissible blood alcohol content (BAC) at 0.3 g/l. The law defines:
-
driving under the influence of alcohol as driving with a BAC between 0.3 g/l and 0.8 g/l
-
driving while intoxicated, which entails much tougher sanctions, as driving with a BAC of 0.8 g/l or higher.
A traffic crash is defined as alcohol-related when either a driver, or another person involved in the crash (including motorcyclists, cyclists or pedestrians), has a measurable or estimated BAC of 0.3 g/l or above.
The number of fatalities due to drink driving declined significantly in 2012, when the zero tolerance law was implemented. This decline has stabilised and has remained at 9% of total fatalities over recent years.
In 2014, “Emilia’s Law” (Ley Emilia) was implemented to more severely punish drunk drivers responsible for serious injury or fatal crashes. This new law complements the zero tolerance law enacted in 2012 and increases sanctions for drunk driving, such as disqualifying the driver for life. The driver is also subject to at least one year of actual imprisonment. In addition, fleeing the scene or refusing an alcohol test is now a criminal offence. More information can be found at www.conaset.cl/ley-emilia.html (accessed 28 April 2017).
Following the first year of the implementation of “Emilia’s Law” the number of fatalities, crashes and those injured due to the influence of alcohol decreased respectively by 16%, 12% and 13%.
Drugs and driving
Currently there is no proper drug test process following a crash. Therefore, the attribution of only 0.1% of deaths to driving under the influence of drugs is largely underestimated. This situation can be explained because a road crash is defined as caused by drugs only when the police see the act of consuming or any physical evidence of drugs.
Distraction
Chilean traffic law considers driving while using a mobile phone a serious traffic violation, unless the person is using a hands-free device.
A large behavioural study was undertaken in 89 cities in 2015. It revealed that 4% of light vehicle drivers use their cell phone while driving (CONASET, 2015).
Police data reported that 7% of crash deaths in 2015 were related to distracted driving.
Sleepiness and fatigue
According to police data less than 1% of traffic deaths in 2015 were related to fatigue. This figure is low because it is difficult for the police to discern the physical condition of the drivers when the crash occurred.
Seat belts and helmets
Seat belt use has been compulsory for front seats since 1985 and rear seats since 2006. A major survey in all 15 regions of the country was undertaken in 2015 and showed that the wearing rate was 76% for drivers, 59% for front seat passengers and around 15% for rear seat passengers (CONASET, 2015). The survey also revealed wide disparities between regions. As an example, the wearing rate for drivers varies from 57% (in Araucania Region) to 92% (in Los Lagos Region), showing the important progress that could be made in this area.
Until 2015, children under 8 years of age had to be seated in the rear seat and be adequately restrained. Since March 2016, this applies to children up to 12 years of age. As of 2017, the obligation to use child restraints will be applied to children from 4 to 8 years of age or those below 1.35 m height and lighter than 33 kg of weight.
Helmet use by all riders of motorised two-wheelers has been compulsory since 1985 when the transit law was published. The helmet wearing rate is high at 99% for drivers and 98% for passengers.
For cyclists, wearing helmets has been required from 2005, but only in urban areas.
National road safety strategies and targets
Organisation of road safety
CONASET is an interministerial body created as a presidential advisory commission through Supreme Decree 223, of 27 December 1993.
CONASET has a board of 10 ministers (Ministry of Interior Affairs, Ministry of the General Secretariat of the Presidency, Ministry General Secretariat of Government, Ministry of Education, Ministry of Justice, Ministry of Public Works, Ministry of Health, Ministry of Housing and Urban Development, Ministry of Labour and Ministry of Transportation) plus the National Police Director. CONASET is led by the Minister of Transportation, and CONASET’s Executive Secretary is in charge of the National Road Safety Strategy, which is agreed by the board.
In 1993, CONASET began working on a framework policy declaration, which has served as the general strategic guide.
Road safety strategy
Chile is currently updating its National Road Safety Policy, which will have a strategy and action plan that will be based on the five pillars of the Global Plan for the Decade of Action for Road Safety 2011-2020. In particular, the scope of action of the new strategy will be: enforcement, regulatory framework, research and innovation, and education and promotion.
In 2015 a special evaluation was made for the first half of the decade. Its results will guide the elaboration of the updated National Road Safety Policy and the development of new strategies and plans. In particular, the evaluation highlighted the need to develop safety plans for the most vulnerable road users, including children, teenagers and motorcyclists.
Recent safety measures (2014-17)
Road safety management
Road users
Driving license
-
The new practical exam for vehicle drivers requires candidates to demonstrate their ability to drive safely and does not only evaluate a set of determined manoeuvres.
-
In order to educate citizens on the benefits of eco-driving, this topic was included in the knowledge exam from 2015.
-
Since 2014, the knowledge exam can be also taken in English throughout all of Chile.
-
CONASET developed a handbook (Libro del Nuevo Conductor) to help candidates study for their tests.
Pedestrians
-
In Chile, pedestrians account for around 35% of all road fatalities. They remain a target for awareness campaigns which focus on respect, self-care and civic coexistence to improve people’s quality of life (More information can be found at www.conaset.cl/todos-somos-peatones/ [accessed 28 April 2017]).
Motorcycle road safety plan
-
The Motorcycle Road Safety plan was launched in 2015. This plan contains 35 measures including short, medium and long term initiatives. (More information can be found at: www.conaset.cl/programa/motociclistas/plan-de-motos [accessed 28 April 2017]).
Children and teenagers’ road safety plan
-
In Chile, road crashes are the first cause of external death for children between 1 and 14 years of age. To demonstrate the urgent need to improve road safety in this area, Chile joined the UN’s #SaveKidsLives initiative and started to develop a road safety plan for children and teenagers. The plan was based on consultation with citizens, parents and children throughout Chile and some of the measures have been implemented such as the change in Child Restraint Systems age requirement.
Speed management
-
In August 2015 the Ministry of Transportation and Telecommunications submitted a bill to congress that proposes reducing urban speed limits from 60 to 50 km/h. In 2002, the speed limit was increased to 60 km/h and the following year crashes in urban areas increased, as well as fatalities (by 25%). The bill has priority and will be discussed during the first semester of 2017.
Road safety education and campaigns
-
In the last three years CONASET in collaboration with the Ministry of Education has added road safety activities to primary school programs.
-
CONASET is continuously developing road safety awareness campaigns.
-
More about campaigns from CONASET can be found at: www.facebook.com/conaset/www.youtube.com/user/Manejateporlavida (accessed 28 April 2017).
Vehicles
Recent improvements to vehicle safety include:
-
Mandatory frontal airbags (for drivers and passengers) on new light vehicles sold in Chile (2015)
-
ISOFIX or LATCH anchoring systems for vehicles of 2 700 kg or less to simplify correct installation of child restraint systems without the need of seat belts (2014)
-
Reflective vests in cars starting as of January 2016
-
Increased safety requirements for motorcycles, including standards for motorcycle features in line with international regulations (2014)
Recent and ongoing research
-
A speed survey was carried out in 2014 and 2015 on different road types of Chile. Speed data was collected by radars continuously for 24 hours a day, seven days a week at 50 control points. In short, the data showed that 5 out of 10 drivers exceed speed limits in intercity roads and 4 out of 10 exceed the limits in urban roads.
-
Behavioural studies were conducted in 89 cities from 15 regions in 2015, focusing on seat belt use, helmet use and distracted driving by car or motorcycle drivers. These studies showed that 76% of drivers and 59% of the front seat passengers use their seat belt and that the use of helmets is 99% for the drivers and 98% for the passengers. The study also showed that 62% of motorcyclists wear gloves and 33% use proper shoes. Regarding distracted driving, 4% of light vehicles drivers use their cell phones while driving. More information can be found at: www.conaset.cl/programa/observatorio-datos-estadistica/biblioteca-observatorio/estudios/ (accessed 28 April 2017).
References
CONASET (2015), Estudio Observación de uso de sistema de retención y casco, distractores presentes en la conducción de vehículos livianos, www.conaset.cl/programa/observatorio-datos-estadistica/biblioteca-observatorio/estudios/ (accessed 28 April 2017).
CONASET (2014-2015),“Caracterización perfil de velocidades de vehículos motorizados en rutas representativas del país”.
SECTRA-MDS (2011), Metodología Simplificada de estimación de beneficios sociales por disminución de accidentes en proyectos de vialidad interurbana, www.ministeriodesarrollosocial.gob.cl/btca/txtcompleto/mideplan/metod.benef.soc-accidentab.vialurb.pdf (accessed 28 April 2017).
GreenLabUC (2014), Estimación del valor de la vida estadística asociado a contaminación atmosférica y accidentes de tránsito, www.greenlabuc.cl/wp-content/uploads/2016/04/2014-VVE-Informe-Final-23Dic2014-1125-casos.pdf (accessed 28 April 2017).
World Bank (2017), “GDP (constant US$)”, World Development Indicators, http://databank.worldbank.org/data/reports.aspx?source=world-development-indicators (accessed 23 February 2017).
Websites
-
National Road Safety Commission‒ CONASET: www.conaset.cl (accessed 28 April 2017).
-
Ministry of Transport and Telecommunications: www.mtt.gob.cl (accessed 28 April 2017).
Note
← 1. Data included in this report are under validation by IRTAD. All data stem from National Road Safety Commission (CONASET) unless otherwise noted. For more information please contact: [email protected].