Chapter 17. Ireland
This chapter presents 2014 road safety data for Ireland along with provisional data from 2015. It looks at trends in traffic and road safety from the years 1990 to 2015 and road user behaviour patterns. This includes data on speed, drink driving, drugs and driving, distracted driving, fatigue and seat belt usage. The chapter reviews Ireland’s road safety strategy and national targets to 2020 and the progress achieved thus far. It also provides details of all recently implemented safety measures and current and ongoing research.1
In 2014, there were 179 fatal collisions on Irish roads which resulted in 193 deaths, an increase of 3% in deaths compared to 2013. This is the second consecutive year with an increase in fatalities. However, between 2013 and 2014 the economic situation improved with increased employment, vehicle registrations, fuel consumption and volume of traffic which could in part explain this recent change. Provisional data from 2015 show a 14% reduction in fatalities, thus appearing to reverse this short negative trend. In 2014, the death rate per 100 000 inhabitants was 4.2 and the death rate per 10 000 registered vehicles was 0.8. Ireland’s road safety strategy has as its target less than 25 fatalities per million inhabitants by 2020.
Road safety data collection
Definitions applied in Ireland
-
Road fatality: A death resulting from a road crash within 30 days.
-
Serious injury: An injury for which a person is detained in hospital as an inpatient, or, whether or not detained in hospital, having any fractures, concussion, internal injuries, crushing, severe cuts and lacerations, or severe general shock requiring medical treatment.
-
Slight injury: An injury of a minor character, such as a sprain or bruise.
In 2012, the Road Safety Authority (RSA) commissioned a study examining the feasibility of adopting the Maximum Abbreviated Injury Scale of three or more (MAIS3+) definition of a serious injury and linking Irish hospital data to police data. The report concluded that it is feasible, and the RSA is working with the Health Intelligence Unit (HIU) of the Health Services Executive to develop an appropriate methodology. While work is ongoing on the longer term goal of data linkage, the RSA have conducted the first transformation of hospital data to MAIS3+ and provided these data to the European Commission (EC). Further work is required to improve the methodology which is taking place with partners in the HIU and the EC.
Data collection
In Ireland, official road crash data is generated by two agencies. Members of the Irish Police Force (An Garda Siochana) complete detailed road crash reports that are subsequently forwarded to the RSA for analysis and publication. Reporting of fatalities is comprehensive in Ireland, but serious injury crashes are likely to be underreported.
From 1 January 2014 reporting and collection of road crash data moved from a paper‐based system to an electronic format. This change will improve recording in terms of the number of variables collected and the accuracy of the data. This changeover is almost complete.
Most recent safety data
Road crashes in 2015 – provisional data
Based on provisional data, as of 31 December 2015, there were 159 fatal collisions with 166 fatalities. This represents 27 fewer deaths (-14%) compared to the same period in 2014 with reductions in all road-user groups (Road Safety Authority, 2015a).
An analysis of longer term trends by road user group shows progress has been greater in reducing car driver and car passenger deaths, compared to vulnerable road users.
The reduction in fatalities seen in 2015 is welcome in light of the increases seen in the previous two years. Interventions and initiatives which took place in 2015 were the RSA International Conference on Child Safety in April 2015, transfer of the Road Safety Authority/An Garda Síochána’s “Go Slow” Campaign to the high risk period of summer, a high profile launch of the July Fatality Review, increased media reporting on road safety in second half of 2015 in particular, and an extensive range of public awareness campaigns.
Road crashes in 2014
In 2014 there were 179 fatal collisions which resulted in 193 deaths on Irish roads, an increase of 3% in deaths compared to 2013 when 188 people were killed. This represents the same number of collisions, but 5 more deaths compared to 2013. The year 2014 was the second consecutive year with an increase in the number of road fatalities since 2005 (Road Safety Authority, 2014a).
Trends in traffic and road safety (1990-2015)
Traffic
After a number of years of declining figures for new vehicle registrations, fuel consumption, as well as rising unemployment figures, 2014 saw an overall improvement in the economy. New vehicle registrations increased by 14.5% between 2013 and 2014. Unemployment fell from 12.6% in September 2013 to 11.1% by September 2014. Fuel consumption increased by 6% in 2014. Overall traffic volume increased in 2014 by 2% compared to 2013.
Road safety
Crashes and casualties
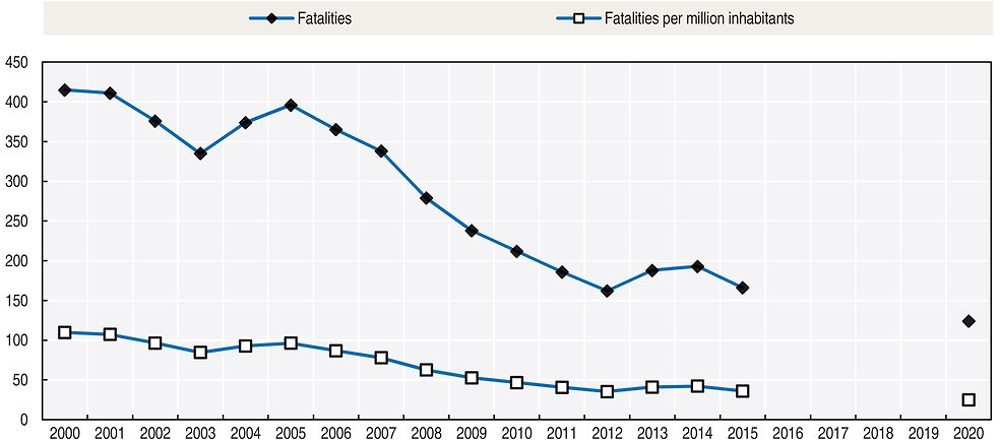
The number of road fatalities peaked in 1972 with 640 deaths. Since crash data was first recorded road deaths reached their lowest level in 2012 with 162 fatalities and the second lowest level was seen in 2015 with 166 fatalities. Between 2000 and 2012, the number of road deaths declined by more than 60%. There were increases in 2013 (16%) and 2014 (3%) in the number of road fatalities but this appears to have been arrested in 2015. It will take another couple of years of data to be able to ascertain if this was a statistical fluctuation in the numbers.
The Road Safety Authority was established in 2006 with the remit to provide a co‐ordinated approach to improving Ireland’s road safety and thus saving lives. The decrease seen over this time would have been influenced by road safety initiatives adopted as part of a strategic approach to road safety. The Road Safety Authority is responsible for the co-ordination and oversight of the Government Road Safety Strategy.
The strategic approach to road safety was first adopted in 1998 with the introduction of the first Road Safety Strategy (1998–2002). The RSA are currently implementing the fourth Government Road Safety Strategy (2013–20). The main changes in policies and legislation in the past 10 years that have influenced road safety include the following.
Enforcement and legislative changes:
-
Introduction of the penalty points system for speeding offences in November 2002.
-
Expansion in August 2012 and August 2014 of the range of road safety-related offences covered by penalty points and administrative fines.
-
Operation of mandatory alcohol testing checkpoints introduced in July 2006.
-
Lowering the maximum authorised blood alcohol content (BAC) level from 0.8 g/l to 0.5 g/l (0.2 g/l for young drivers and professional drivers) in 2010.
-
Operation of the safety camera network to produce more than 7 000 hours of enforcement per month beginning in November 2010.
-
Targeted operations of traffic law enforcement with a particular emphasis on safety offences including speeding, impaired driving, restraint/helmet misuse, mobile phone use and defective vehicles.
Media and communication campaigns:
-
Implementation of mass media campaigns to target the main causal factors for crashes, deaths and serious injuries for all road users, but in particular the high risk groups based on research evidence.
-
Integrating social media messaging with mass media campaigns to better target specific messages to the younger age groups.
-
Integrating mass media campaigns to complement policing plans of An Garda Síochána and other enforcement agencies.
Education initiatives:
-
Implementation of educational interventions aimed at the high risk 17-24 year old age group (e.g. “He drives she dies” campaign) and community based interventions for older road users (Mobility Matters).
-
Implementation of a suite of schools-based initiatives to teach children at primary and secondary schools about road safety through programmes such as “Be Safe” and “Streetwise”.
-
Introduction of a Nationwide Road Safety Education Service. A team of road safety educators who travel to schools, colleges, communities, and places of work, to deliver established and effective programmes to everyone. These programmes tackle all elements of road safety and the practicing of safe road behaviour in general.
-
The RSA “Check it Fits” team help parents and guardians to correctly fit their child car seats. Trained experts deliver the service all over Ireland on a full-time basis which is fast, convenient and free of charge.
-
Implementation of specific educational measures aimed at vulnerable road users, such as use of high visibility material for pedestrians, cyclists and motor cyclists; awareness of intoxicated pedestrians; use of personal protection equipment for cyclists and motorcyclists; awareness of blind spots on heavy good vehicles and care for younger and older people
Driver education:
-
Introduction of novice plates for learners and newly qualified drivers in 2014 as part of Ireland’s Graduated Driver Licensing programme.
-
Regulation of professional driver training for novice drivers
-
Introduction of compulsory lessons for learner car drivers known as Essential Driver Training (EDT) which is part of the Graduated Driver Licensing system (GDL). Car learners must complete 12 mandatory lessons before attempting their practical driving test.
-
Introduction of compulsory lessons for new learner motorcyclists known as Initial Basic Training (IBT) which is part of the Graduated Driver Licensing system (GDL). New motorcyclists must complete IBT which is a modular based training programme covering theory and practical off and on-road riding, before being permitted to ride unaccompanied on a public road and taking their practical driving test.
-
Introduction of compulsory periodic refresher training for professional bus and truck drivers (Drivers CPC).
Vehicle standards:
-
Introduction of a national commercial vehicle testing system forcing greater compliance with the legal obligation to have commercial vehicles tested annually and improving quality and consistency of the test.
-
Investment in commercial vehicle and driver enforcement, with a 400% increase in the roadworthiness inspections, with 8% of the fleet checked at the roadside in 2015; a doubling of driver’s hours and tachograph enforcement inspections at the roadside and operator premises.
-
Enhancement of commercial vehicle operator vehicle safety obligations through the introduction of explicit maintenance obligations for commercial vehicle operators and powers of inspection.
Rates
Since 2000, the risk has been more than halved for the rate indicators of deaths per 100 000 inhabitants and deaths per 10 000 registered vehicles. In 2014, the death rate per 100 000 inhabitants was 4.2 and the death rate per 10 000 registered vehicles was 0.8.
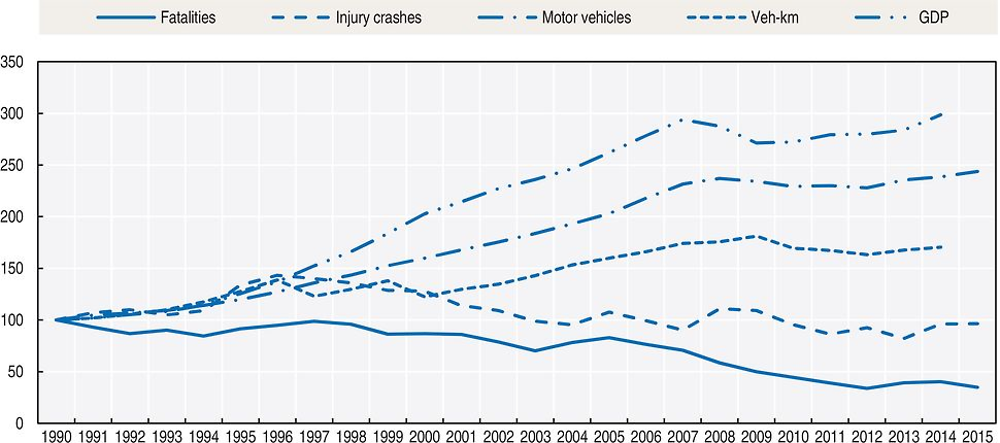
Source: World Bank for Gross Domestic Product (GDP; constant prices).
Road safety by user group
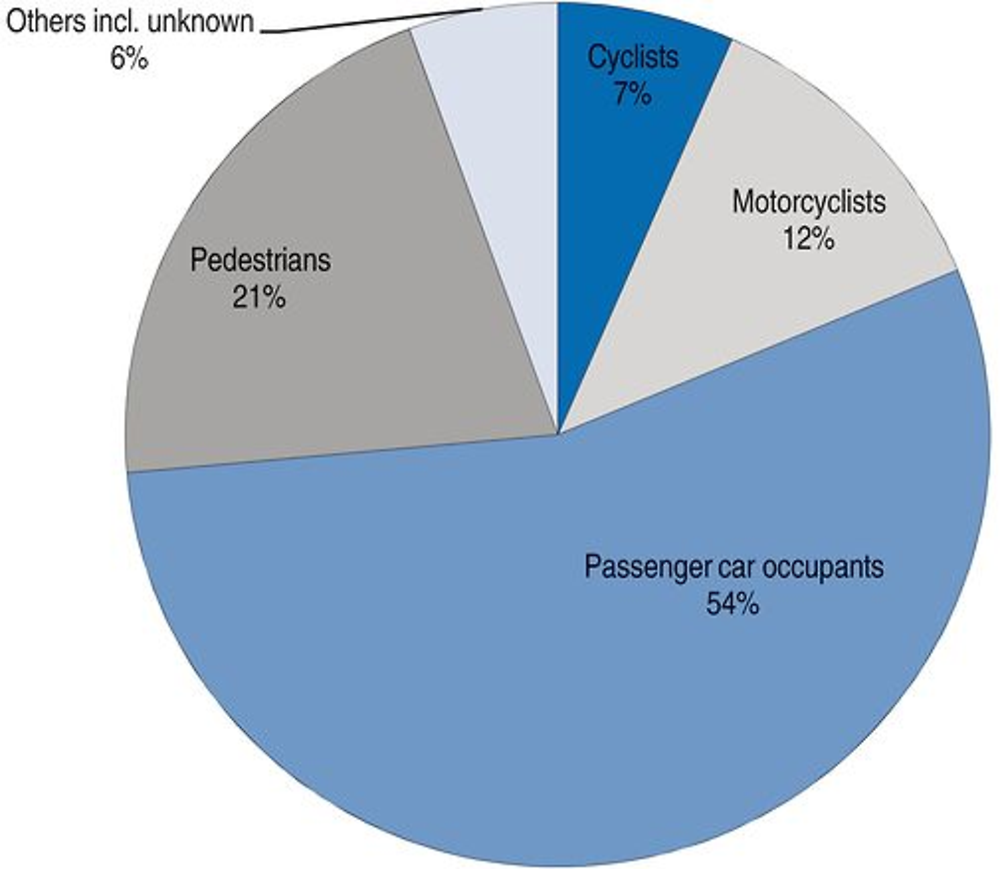
Fatalities for all user groups have declined since 2000, with the highest reduction for passenger car occupants (-59%) and pedestrians (-52%).
Between 2010 and 2014, improvements in road safety benefitted car occupants the most. In 2014, car occupants represented 56% of fatalities, while vulnerable road users (pedestrians, motorcyclists and cyclists) represented the remaining.
Road safety by age group
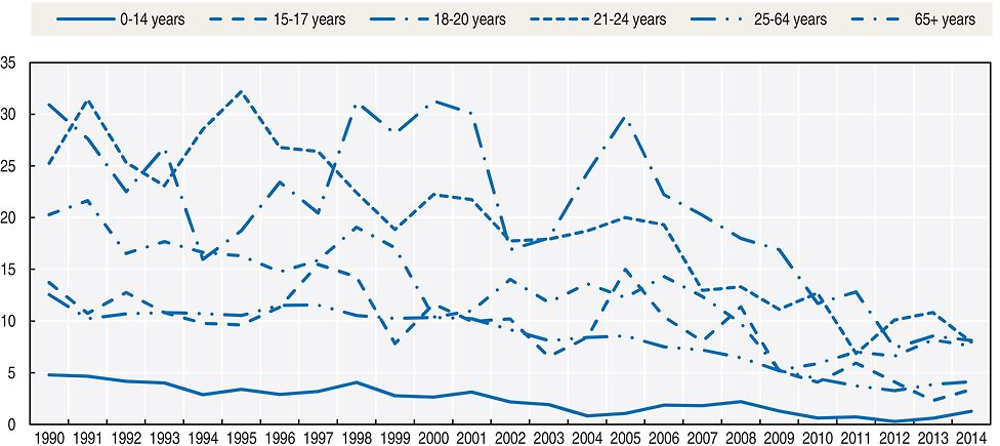
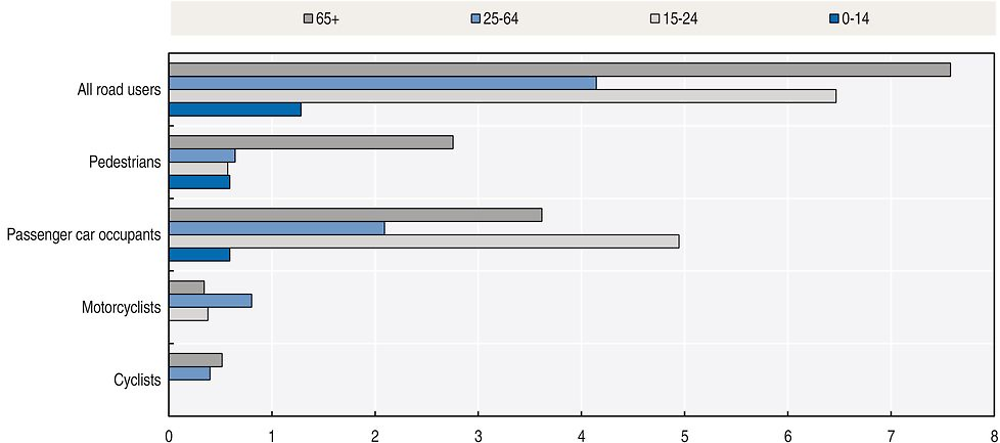
There has been a reduction in fatalities for all age groups since 1990. Since 2010, improvements in road safety benefitted mostly the young people between 18 and 24, while the number of senior citizens killed in road traffic increased (+46%). There have been demographic changes over this period in these age groups, a reduction in the numbers aged 15-24 (-15%) and increases in those aged 65 and older (+14%), but also changes to the learner driver system (GDL) and changes to the points system.
Nevertheless, in 2014, young people between 18 and 20 were still the most at risk in traffic with a mortality rate of 8.1 per 100 000 inhabitants, which is about twice that of the general population (4.2 for 100 000 population).
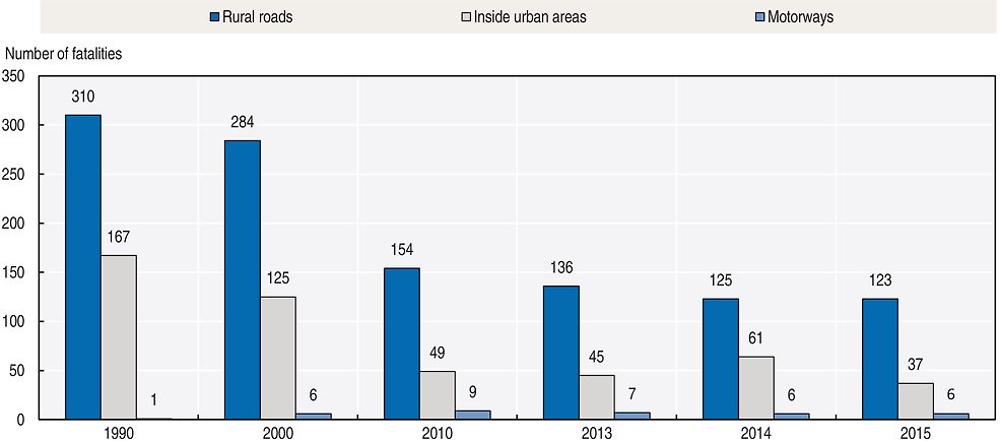
Road safety by road type
In 2015, a large majority of fatalities (74%) occurred on rural roads. Since 1990, urban roads have recorded the greatest reduction in fatalities (-78%). The small number of fatalities on motorways is mostly due to the relatively low crash rates on this type of carriageway.
Economic costs of traffic crashes
Traffic crashes represent a significant cost for society, estimated in 2013 at around EUR 850 million or 0.48% of Ireland’s GDP.
The cost of collisions was provided in the Common Appraisal Framework for Transport (CAF-T) projects issued by the Department of Transport, Tourism, and Sport (2016). This latest update is based on research conducted by Goodbody consultants for the Department of Transport. Collision values are dependent on income, therefore the change in collision values over the evaluation time horizon should follow the growth in real GNP per person employed mechanism.
Recent trends in road user behaviour
Speed
Between 2002 and 2012, excessive speed was cited as a contributory factor in 15% of all road fatalities and it was a contributory factor in 11% of all serious injury crashes (RSA, 2015c).
A survey in 2015 measured the free speed of 12 458 cars, i.e. speed at which drivers choose to travel when unconstrained by road geometry, weather or traffic conditions. The results of the survey are summarised in the table below.
The table below summarises the main speed limits in Ireland.
In the most recent survey of driver attitudes and behaviours (RSA, 2015b) conducted among a sample of 1 073 drivers in Ireland, 11% of motorists admitted to being fined or punished in another way for breaking the speed limit in the past three years. It was also found that between 44% and 54% of motorists consider low-level speeding broadly acceptable. In this case low-level speeding was defined as exceeding speed limits by less than 10 km/h.
Drink driving
Since 2010, the maximum authorised blood alcohol content (BAC) level is 0.5 g/l (0.2 g/l for novice drivers and professional drivers). It was 0.8 g/l until 2009. In 2007, it was estimated that drink-driving (driver with a BAC > 0.2 g/l) was a factor in 15.5% of fatal crashes. This research is currently being updated to include a review of forensic investigation files for fatal road crashes from 2008 to 2012. Results of the Pre-crash Behaviour Study are expected to be published in 2016.
In the most recent survey of driver attitudes and behaviours (RSA, 2015b) conducted among a sample of 1 073 drivers, 8% of drivers said they had driven after having at least one drink during the past 12 months. Of these, 44% said they had at least two or more drinks on that occasion.
Drugs and driving
Following several decades of successful efforts to understand and reduce the magnitude of drink driving, driving while impaired by other psychoactive substances has emerged as its own road safety issue. A wide variety of substances, from illegal drugs to some over-the-counter preparations, can adversely affect the cognitive and behavioural skills required to operate a vehicle safely.
It has been estimated that 1.5% of drivers and motorcyclists involved in fatal crashes in the period 2005-07 had taken illicit drugs, based on the information from a national study. Illicit drug use was prevalent among male and young (17-34) drivers in Ireland. A study from the coroner’s district in County Kildare during 1998-2009 showed that of 92 driver deaths, 50% tested positive for alcohol and/or drugs, and 9.8% had a positive toxicology for a drug. This rate of 1 in 10 drivers under the influence of drugs undoubtedly points to the need for intoxicant impairment testing.
In a survey of driver attitudes and behaviours conducted in 2014 among a sample of 1 066 drivers in Ireland, 2% of respondents said they had travelled in a car where they knew the driver had taken illicit drugs prior to driving.
An Garda Síochána now have additional powers to test drivers suspected of driving under the influence of drugs using Roadside Impairment Testing. There are five impairment tests a driver must undergo; a Pupil Dilation Test, Modified Romberg Balance Test, Walk and Turn Test, One Leg Stand and a Finger to Nose Test.
Seat belts and helmets
Seat belt use has been compulsory in front seats since February 1979 and in rear seats since January 1993. Children must be protected by a child restraint appropriate for their size and weight.
A 2015 observational survey of seat belt wearing rates on Irish roads showed that the overall seat belt wearing rate for adults (drivers, front and rear passengers) was 92% (same level as 2014). The wearing rate for drivers was 92%, 94% for all front seat passengers, and 81% for all rear seat adult passengers (RSA, 2015c).
A review of the 2015 fatal crashes found that 17% of road fatalities were not wearing a seat belt. This suggests that 29 fatalities may have been prevented had a seat belt been worn. In a significant proportion of collisions, it was not possible for the Garda at the scene to record whether or not a seat belt had been worn.
In the most recent survey of driver attitudes and behaviours (RSA, 2015b) conducted among a sample of 1 073 drivers, respondents were asked how often they wore a seat belt as a driver, front passenger and rear passenger. As drivers, 98% said they always wore them; as front seat passengers, 97% said they always wore one; but as rear seat passengers, only 80% said that they always wear one. Only 77% of drivers said they always insist that seat belts are worn by those sitting in the rear of their car.
All riders of powered two-wheelers are required to wear helmets. There is no mandatory helmet use law for cyclists.
A roadside observation survey of motorcyclists (n = 3 973) in 2015 found that 97% of motorcyclists were wearing helmets (RSA, 2015d). This is a worrying reduction in the number of motorcyclists observed not wearing helmets. Of all pedal cyclists observed (n = 17 534) 52% wore a helmet. Further analysis was conducted based on the type of pedal cycle being used and found that 41% of pedal cyclists (n = 14 733) using their own bikes wore a helmet while 17% of those using the public bike scheme (n = 2 801) were wearing helmets.
National road safety strategies and targets
Organisation of road safety
The RSA is a state agency under the aegis of the Department of Transport, Tourism and Sport tasked with improving safety on Irish roads in order to reduce road death and injury resulting from road crashes.
The RSA co-operates and co-ordinates with stakeholders including:
-
the Department of Transport, Tourism and Sport
-
An Garda Síochána
-
the National Roads Authority
-
Medical Bureau of Road Safety
-
the Department of Justice and Equality; Education and Skills; Environment, Community and Local Government; Health; Children and Youth Affairs, etc.
Road safety strategy for 2013-20
The Road Safety Authority is currently operating under the framework of the Government Road Safety Strategy 2013-20. The strategy sets out comprehensive targets and identifies 144 actions to be completed within its lifetime.
Road safety targets
The main targets are:
-
a reduction of road crash fatalities on Irish roads to 25 per million population or less by 2020
-
a provisional target for the reduction of serious injuries by 30% from 472 in 2011 to 330 or fewer by 2020, or 61 per million inhabitants.
Monitoring targets
In order to meet the target of 25 per million inhabitants, or about 124 deaths by 2020, a 25% decline in fatalities between 2015 and 2020 is required, equivalent to an average annual 5.5% reduction.
The broad monitoring arrangements that were instrumental in the success of the previous strategy will be maintained. Annual reviews of the strategy involving the lead departments and agencies are ongoing. Progress in implementing the strategy is reported in the context of the Road Safety Strategy Report to the Minister for Transport, Tourism and Sport. This report is informed by consultation with the major stakeholders. A mid-term evaluation of the strategy is being implemented in the latter half of 2016, and this will provide an opportunity to recalibrate targets and to implement adjustments to the education, engineering and enforcement measures as required.
Recent safety measures (2013-16)
Road safety management
Penalty point system
-
From 1 August 2014, penalty points for speeding, holding a mobile phone while driving and not wearing a seat belt or not using child restraints increased from two points to three. For those who do not pay the fixed charge and are subsequently convicted in court, the points will increase from four to five.
-
A new Fixed Charge Notice (FCN) offence for motorists who drive with defective or worn tyres on their vehicle was introduced in April 2016. Although driving a vehicle with defective or worn tyres is already an offence, there will now be a fixed charge (or fine) of EUR 80, with two penalty points endorsed, or four penalty points following conviction in court.
Novice drivers
-
Under the terms of the 2014 Act, the new category of novice driver came into effect from 1 August 2014. Those drivers who receive their first full licence will be considered as novice drivers for their first two years. Novices will be required to display an N-plate during that time. Under the terms of the Act, novices will face disqualification from driving for six months if they reach seven penalty points, as opposed to 12 for those with a full licence.
-
Eliminating odometer fraud is important for consumer protection and road safety and a verification process has been introduced at NCT to support the accuracy of the data.
Cyclists
-
From July 2015 new fixed charge notices came into effect to promote safe cycling practices. The charge is in place for breaking a red light, failure to have a front lamp lit during lighting-up hours and cycling without reasonable consideration.
Towing of trailers
-
Changes to driver licence legislation now require all drivers to be qualified in the correct category of driving licence before they are permitted to tow trailers of particular weight classes.
Road users
Speed management
-
The Department of Transport Tourism & Sport is actively encouraging local authorities to introduce 30km/h zones in residential areas and has engaged in a formal process with Local Authorities to encourage the reduction of the speed limit to this threshold in residential areas.
-
Work on setting and managing speed limits has been conducted and a revised set of guidelines were issued in 2015. These guidelines include the introduction and use of new rural speed limit signs and a comprehensive review and update of all speed limits in administrative areas.
-
A system called MapRoad, where data on speed limit signage is being collected in the field and centrally stored in a Roads Management System, is being compiled and the system will progress to provide quantitative and qualitative analysis of speed limit detail and allow roads authorities to greater scrutinise the appropriateness and validity of speed limits on Irish roads.
Education and awareness
The RSA has developed a number of new TV campaigns to target some of the main killer behaviours. Each campaign has been based on the latest research & evidence available on the relevant topic.
-
Tyre safety – as a result of the recent research which found that in 8% of fatal collisions the condition of tyres were a contributory factor, a television advert was launched in April 2016 focusing on the potential outcome of driving on poorly maintained tyres.
-
Mobile Phone Distraction – based on the premise that it only takes a split second looking at your phone to cause a serious crash with devastating consequences. The RSA was awarded Gold at the World Advertising Awards the ‘Epicas’ in November for this advert called “Anatomy of a split second” in the “Public Interest – Health and Safety” category.
-
Vulnerable road users: There was a suite of television, radio and social media campaigns aimed at vulnerable road users such as cyclists, motorcyclists, and pedestrians aired throughout 2015 and into 2016. This was prompted by the increases seen in 2013 and 2014 in vulnerable road user fatalities.
-
Driver Fatigue: An information based campaign, encouraging drivers to “Stop, Sip, Sleep” and obey the signs of fatigue when driving.
-
Driving for work: The RSA hosted an ETSC PIN talk on 2nd July 2015 about driving for work. There were four driving-for-work seminars given in the latter half of 2015. Please visit the webpage for driving for work seminars.
-
RSA International Conference: This takes place each year in April. The 2016 conference, entitled “iSafer”, is being held in conjunction with the ETSC and is a consideration of ISA technology.
All RSA media campaigns are available to view on the RSA campaign webpage.
Infrastructure
-
Implementation of a centralised information repository in relation to commercial vehicles, operators and drivers enabling more effective and efficient enforcement targeted at high risk non-compliant operators and supporting compliance through minimising disruption.
-
Enhancement of technology for commercial vehicle inspections through Automatic Number Plate Recognition (ANPR) and look up apps for inspection service linked back to National Vehicle Driver File and enforcement and testing compliance history to enhance more effective and targeted enforcement.
-
Development of dedicated enforcement sites for commercial vehicles.
Vehicles
Emergency pack
-
The RSA has reported the results of the public consultation on the proposal that all vehicles be fitted with an emergency pack (first aid kit, torch, high-visibility vest and warning triangle) to the Department of Transport, Tourism, and Sport.
National Car Test (NCT)
-
The NCT is a compulsory vehicle inspection programme in Ireland. The primary aim of this programme is to improve road safety and enhance environmental protection by reducing harmful vehicle emissions. In December 2014, the NCT came within the Fixed Charge System. Since then a huge improvement in compliance has been realised.
Vehicle Standards
-
The RSA has, in recent years, developed numerous recommendations and legislative amendments relating to the vehicle standards that are being applied in Ireland. Recent changes in regulations include:
-
Extension of the scope of compulsory roadworthiness testing to include motor caravans.
-
Mandating the fitment of additional mirrors on heavy goods vehicles to improve the diver’s view of the blind spots surrounding their vehicles to provide additional protection to vulnerable road users.
-
The implementation of a suite of revised standards for agricultural vehicles to ensure the regulatory regime reflects the developments in agricultural vehicle technology and facilitates the compliance with recognised standards in of key safety critical areas, i.e. braking, suspension systems, tyres and lighting as well as the weights for which the vehicles are designed.
-
Mandating the fitment of spray suppression devices to HGV’s in advance of the mandatory type approval date.
-
Recent and ongoing research
-
A survey of over 1 000 drivers in Ireland in 2015 (RSA, 2015b) asked motorists if they had experienced problems with their tyres in the past five years. Of all drivers, 53% had experienced problems and 33% were experienced “while driving”. Approximately 4% of all drivers experienced a blowout while driving.
-
The RSA has completed a comprehensive literature review of the research into ISA technology and this was presented at the International Conference in April 2016.
-
A study has been completed on fatal collisions in Ireland between 2008 and 2012. A series of reports will be released in 2016 highlighting results from this research. The first report looked at vehicle factors in these road collisions and indicated that of all vehicle factors deemed a contributory factor in fatal collisions, tyres were the single largest factor. In 8% of the fatal collisions investigated, the condition of the tyres was a factor in the collision. This equated to 71 deaths. This report can be found on the RSA website.
-
The Cyclists Rules of the Road study was an observational study of cyclist behaviour at traffic lights, in particular red light infringements, and was conducted for the first time in 2015. It will be repeated in 2016.
-
The RSA is beginning a collaboration with Trinity College Dublin and The Irish Longitudinal Study on Ageing to further enhance understanding of the challenges and limitations older road users face as pedestrians, drivers, and cyclists. The results of this research will be used to support RSA policy in terms of education and communications campaigns aimed at the older road user.
-
The RSA will conduct a nationally representative study into pedestrian road crossing behaviour. This study will look at adult and child crossing behaviour but will also be used to support the research into older pedestrians.
-
In December 2015, the RSA contracted a consultant to undertake two reviews concerning i) risk behaviours and increasing the road safety of professional drivers not subject to the EU rules on tachograph and driving time and resting periods and ii) alternative sanction options to deal with operators and drivers who flout driving time and roadworthiness rules in addition to those already in existence.
The RSA has completed a review of the standards of the services and repair industry in Ireland, as a result of which we will be making recommendation for measures to be put in place to enhance standards in the industry in the coming years.
References
Goodbody Economic Consultants (2004), Values of Time, Accident Costs and Operating Costs, Dublin, Ireland.
Road Safety Authority (2014a), Provisional Review of Fatalities 2014. Retrieved from www.rsa.ie/Documents/Road%20Safety/Crash%20Stats/Provisional%20Review%20of%20Road%20Crash%20Fatalities %2031%20Dec%202014.pdf.
Road Safety Authority (2014), Cyclist injuries: A review of 2012 casualties. Ballina, Ireland, Retrieved from http://rsa.ie/Documents/Road%20Safety/Crash%20Stats/Review_of_Cyclist_Injuries_2012.pdf (accessed 8 April 2016).
Road Safety Authority (2015a), “Provisional Review of Fatalities 2015”. Retrieved from www.rsa.ie/Documents/Road%20Safety/Crash%20Stats/Provisional%20Review%20of%20Fatalities%202015.pdf (accessed 17 May 2016).
Road Safety Authority (2015b), Driver Attitudes and Behaviour Survey 2015. Unpublished data.
Road Safety Authority (2015c), Seat Belt and Mobile Phone Usage Observation Survey 2015. Unpublished data.
Road Safety Authority (2015d), High Visibility and Helmet Wearing Observation Survey 2015. Unpublished data.
Websites
-
Irish Road Safety Authority: www.rsa.ie.
-
2013-2020 Road Safety Strategy, www.rsa.ie/Documents/About%20Us/RSA_STRATEGY_2013-2020%20.pdf (accessed 7 April 2016).
-
Penalty points: www.penaltypoints.ie.
-
Rules of the Road online: www.rulesoftheroad.ie.
← 1. All data stem from the Irish Road Safety Authority and IRTAD unless otherwise noted. For more information please contact: [email protected]