Chapter 9. Czech Republic
This chapter presents 2014 road safety data for the Czech Republic along with provisional data from 2015. It looks at trends in traffic and road safety from the years 1990 to 2014 and road user behaviour patterns. This includes data on speed, drink driving, drugs and driving, distracted driving, fatigue and seat belt usage. The chapter reviews the Czech Republic’s road safety strategy and national targets to 2020 and the progress achieved thus far. It also looks at ongoing research and recently implemented safety measures.1
Between 1994 and 2014, the overall number of road deaths in the Czech Republic decreased by 58%. This comes as the result of successive national strategic safety plans. The fatality rate in 2014 reached 6.5 per 100 000 inhabitants. However, fatality rates among young people are still higher than the overall average. In 2014, the death rate for the 18-20 year old group was 13.9 and that for 21-24 year old group was 10.3. The increased fatalities seen in 2014 and 2015 highlight the need for increased traffic enforcement, a strengthened driver licensing system, improved traffic education and infrastructure audits and inspections, especially at railway crossings.
Road safety data collection
Definitions applied in the Czech Republic
-
Road fatality: Person who died immediately after the crash or within the next 30 days. (Note: this is fully applied for international data comparison, but for domestic purposes, a road fatality often refers to a person who died immediately or within 24 hours).
-
Serious injury: Injury severity is determined through the opinion of the physician at the scene of the crash or later in hospital (within 24 hours of the crash). A serious injury is one considered to cause serious harm to health. At present, the severity value based on a score of three or more on the Maximum Abbreviated Injury Scale (MAIS3+) is not in general use in accident registration, and its future utilisation is yet to be decided.
Data collection
Crash data in the Czech Republic are collected by traffic police in 80 districts and transferred to the police headquarters. Data are checked both at district and central levels.
Crash reporting rates in the police database are relatively high due the legal obligation that all crashes with a death, injury or material damage over CZK 100 000 (since 2009) have to be reported to and registered by the police.
Most recent safety data
Road crashes in 2015 – provisional data
Based on provisional data, there were 732 reported road fatalities in 2015, a 6.4% increase when compared to 2014. The number of injury crashes increased by 2.4%. For the second consecutive year, the goals of the national road safety strategy were not reached.
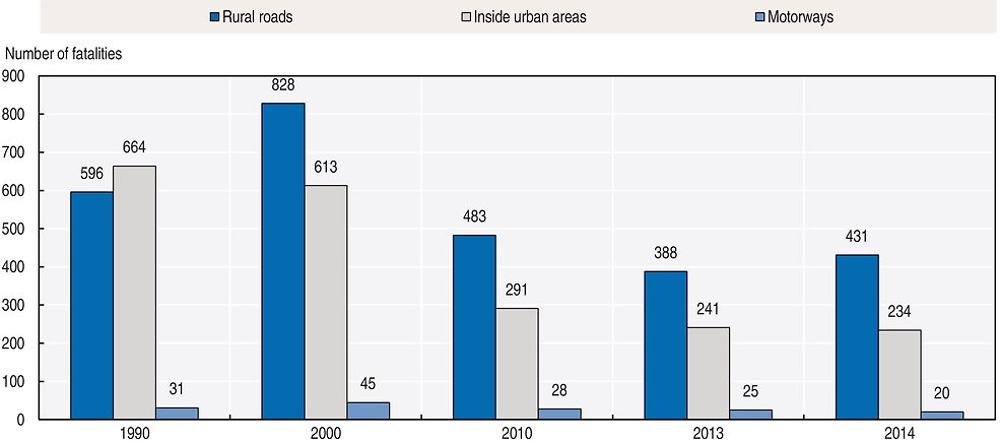
The number of fatalities increased significantly on rural roads (+13% fatalities) and on motorways (+28%). There was an increase of 24% in the number of cyclists killed and of 15% in the number of pedestrians killed.
Due to the poor performance seen in 2014 and 2015, there is an urgent need to implement new and effective road safety measures and to bring radical changes to the current road safety management system. Based on analyses of 2014 and 2015 data, it is particularly important to increase traffic enforcement, strengthen the driver licensing system, improve traffic education and undertake infrastructure audits and inspections, especially at railway crossings.
Road crashes in 2014
In 2014, there were 688 road fatalities, a 5.2% increase from 2013. The number of injury crashes increased by 3.5%.
Between 2013 and 2014, fatalities increased among groups using powered two-wheelers and car occupants. Fatalities decreased among cyclists and pedestrians.
Trends in traffic and road safety (1990-2014)
Traffic
Since 1990, the number of motorised vehicles has increased by more than 60%. The traffic (in terms of vehicle-kilometres) more than doubled between 1990 and 2009, but stagnation was observed in the following years.
The traffic of heavy goods vehicles increased gradually after 1990 with the development of the new market economy. During the economic recession vehicle-kilometres stagnated in 2007-08 and then dropped after 2009 (partially due to a change of methodology in registering trucks and trailers).
Road safety
Crashes and casualties
The number of fatalities peaked in 1969 and steadily decreased until 1986. Between 1986 and 1994, there was a rapid deterioration of road safety and road deaths increased by 82%. This corresponded to a period of important political changes in the Czech Republic and other Eastern European countries following the fall of the Soviet bloc. During this period, the number of motorised vehicles increased sharply in a context of weak police control and less political attention to road safety.
Between 1994 and 2014, the number of road deaths decreased by 58% and that of injury crashes also decreased by 24%. These good results are the fruit of successive national strategic safety plans.
Rates
Between 1994 and 2014, fatalities per 100 000 inhabitants decreased by 59%, reaching 6.5 in 2014.
Analysis of seriously injured data
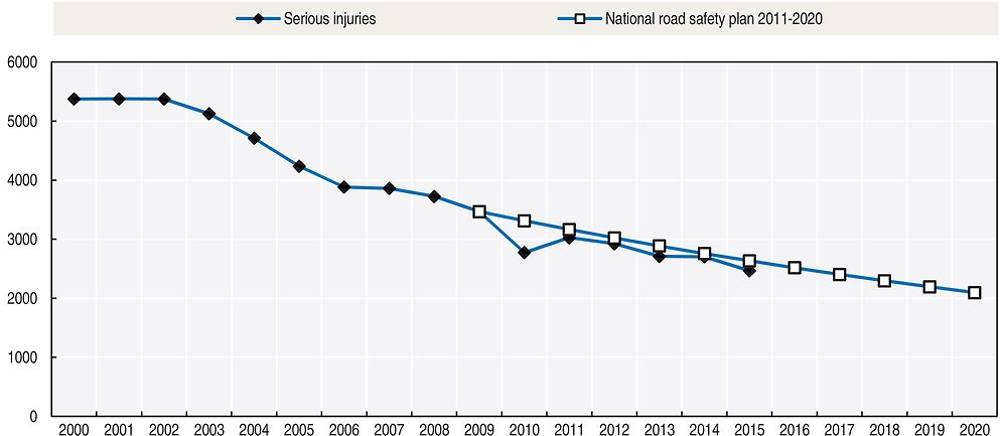
Reducing the number of persons seriously injured is the second target of the national road safety strategy. Unfortunately, it is not yet possible to estimate the number of persons injured based on the MAIS classification. Based on the current definition, the number of persons seriously injured decreased by 8.7% to 2 468 between 2014 and 2015 achieving one part of the strategic road safety programme.
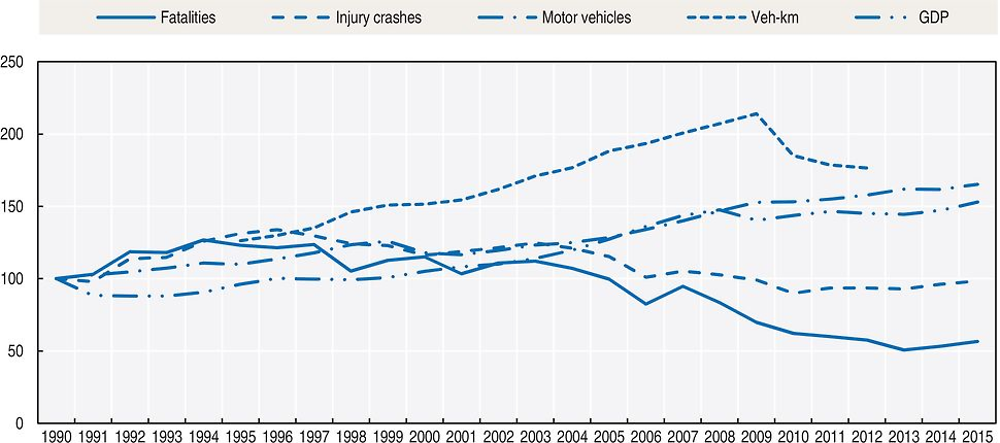
Source: World Bank for Gross Domestic Product (GDP; constant prices).
Road safety by user group
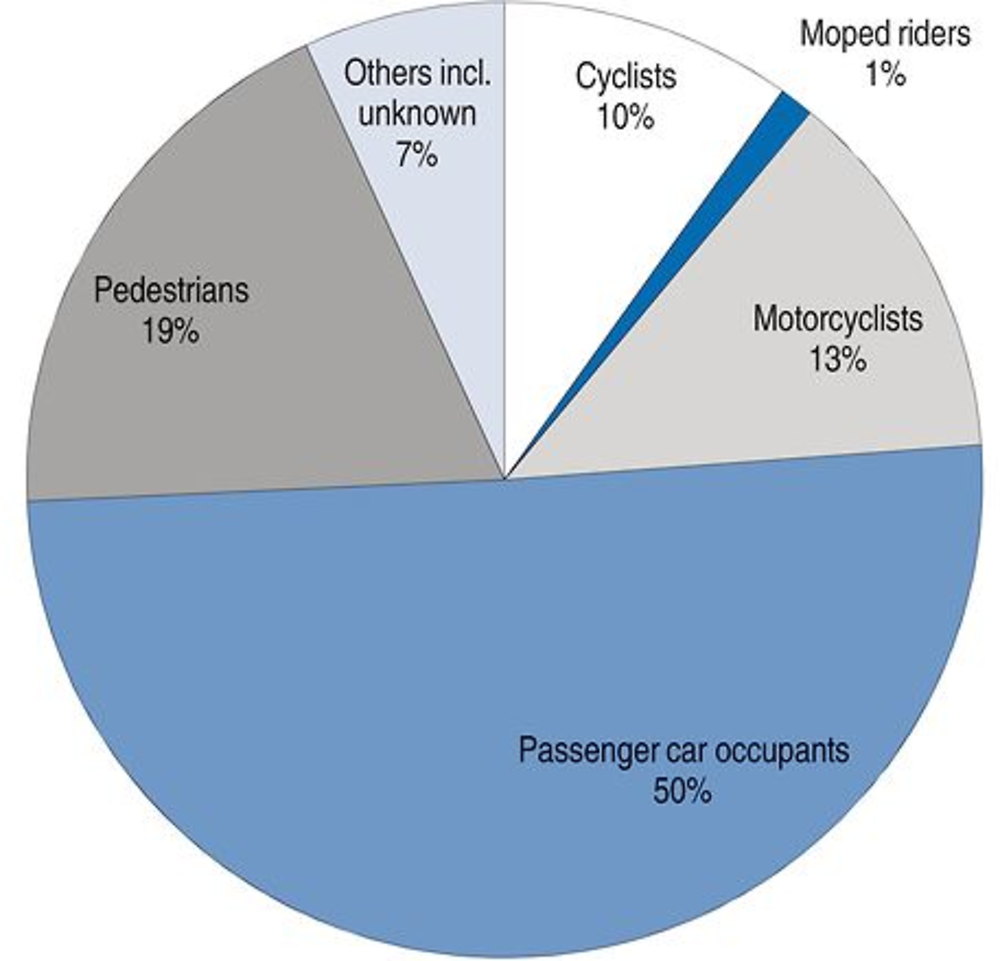
Since 2000, all user groups except mopeds riders, whose figure is too small for a meaningful interpretation, have benefited from safety improvements. Strengthened enforcement and education within the national strategic safety plan contributed to these good results in the first period of the safety plan.
In 2014, the number of fatalities increased among car occupants and motorcyclists. The number of cyclists and pedestrians killed decreased. However, based on provisional data for 2015, there was a sharp increase in the number of cyclists (+24%) and pedestrians (+15%) killed. Since 2013, the situation has deteriorated for all road users.
Road safety by age group
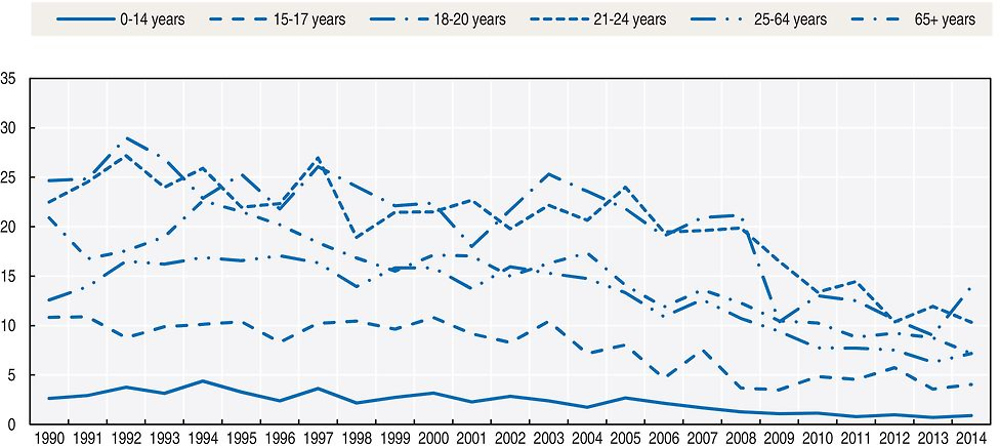
Since 1990, the reduction in fatalities has benefited all age groups, with the highest reduction for children and young people. However, in 2014 fatalities increased among 15-20 years old and 15-64 years old group.
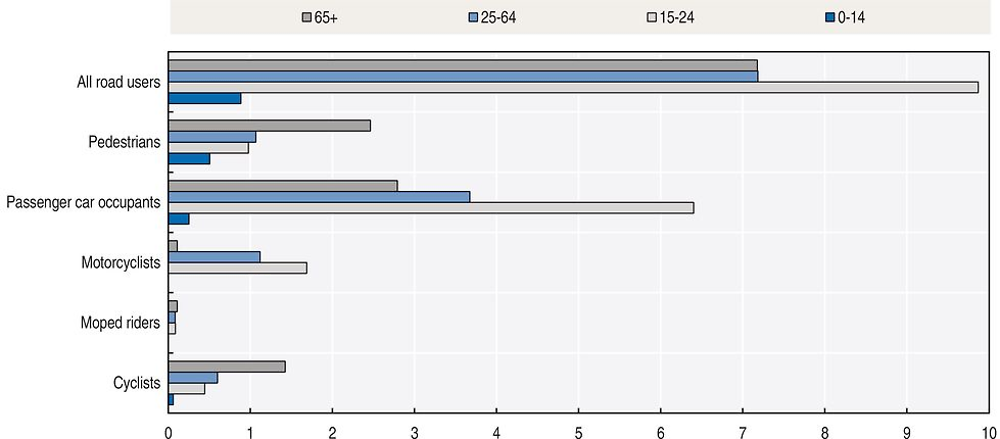
Young people (18-24) have a risk well over the average of 6.5 road deaths per 100 000 inhabitants in 2014. In 2014, the death rate for the 18-20 year old group was 13.9 and that for 21-24 year old group was 10.3.
Road safety by road type
Since 1990, the greatest reduction in fatalities has occurred on urban roads (-65%), while improvement on rural roads has been less marked (-28%). Improvements on urban roads are related to the introduction of the 50 km/h speed limit, the extension of 30 km/h zones, and the widespread introduction of traffic-calming measures. Since 2000, fatalities decreased by 62% on urban roads and 48% on rural roads. However, in 2014, the fatalities increased on rural roads (+ 11 %). According to provisional data, there was a sharp increase in the number of fatalities on rural roads (+13%) and motorways (+28%) in 2015.
It should be noted that as of 1 January 2016, expressways are classified as motorways. The length of the motorway network therefore increased from 776 km to 1 235 km.
Economic costs of traffic crashes
Economic costs engendered by road crashes are evaluated by the human capital approach. They are composed of direct costs (chiefly medical care, rescue service, police and justice) and indirect costs (lost value of economic productivity due to ill health, disability, or premature mortality, and social expenses).
The economic costs of crashes for the Czech Republic are published every year. For 2014, they were estimated at EUR 2 billion, or 1.4 % of GDP.
Recent trends in road user behaviour
Speed
Speeding is the main contributing factor in fatal crashes, although the number of drivers above the legal speed limit has decreased, especially in urban areas. The share of fatal crashes due to excessive speed was 33% in 1980, 40% in 2000 and also 40% in 2014.
Average speed, 85th percentile speed and the percentage of drivers above the speed limit have been monitored regularly since 2005. The introduction of a demerit point system in 2006 resulted in a reduction in the number of drivers above the limit, but this share increased again in 2010.
The table below summarises the main speed limits in the Czech Republic.
Drink driving
There is a zero blood alcohol content (BAC) limit in the Czech Republic. When police arrive at the scene of a crash, all persons involved are checked for BAC. If the BAC level of anyone involved is positive, the crash is classified as alcohol-related.
In 2002, 11% of fatalities were due to alcohol related crashes. This proportion decreased to 3.4% in 2007, and then increased again to 14% in 2010 (probably due to a change in the investigation procedure). In 2014, it is estimated that 10% of road fatalities were alcohol related crashes.
Drugs and driving
Drug use is forbidden while driving. The share of fatal crashes due to a driver under the influence of drugs was estimated at 0.9% in 2014.
A crash is defined as drug related if the driver tests positive for drug consumption.
Distraction
In the Czech Republic, drivers are not allowed to drive while using a hand-held phone or other electronic device such as a Personal Digital Assistant (PDA). Hands-free devices are tolerated. In 2014, it was estimated that 2.7% of drivers used a mobile phone while driving.
Sleepiness and fatigue
In 2014, it was estimated that about 2.1% of crashes were due to fatigue.
Seat belts and helmets
Seat belt use has been compulsory in front seats since 1966 and in rear seats since 1975. However, until recently the level of enforcement was very low. The situation has significantly improved since 2004.
Dedicated child restraints are compulsory for children between 0 and 3 years old, and for children 4 and above who are less than 150 cm in height or 36 kg in weight.
In 2014, 32% of car occupants killed were not wearing a seat belt when the crash occurred. It is estimated that 90 lives could have been saved if all car occupants had worn seat belts.
Helmet-wearing is compulsory for all motorcycle and moped riders and the wearing rate is nearly 100%. Safety helmets were made mandatory for cyclists up to the age of 15 in 2001 and up to 18 in 2006. The compulsory wearing of helmets for all cyclists is under discussion.
National road safety strategies and targets
Organisation of road safety
BESIP (Bezpečnost silničního provozu), an independent department of the Ministry of Transport, is the main co-ordinating body for road traffic in the Czech Republic. BESIP is responsible for the National Road Safety Strategy for 2011-2020. The other key player is the Government Council of Road Traffic Safety (composed of representatives of parliament, ministries, civil associations, professional organisations and the private sector). There are also 14 regional BESIP co-ordinators.
Road safety strategy for 2011-20
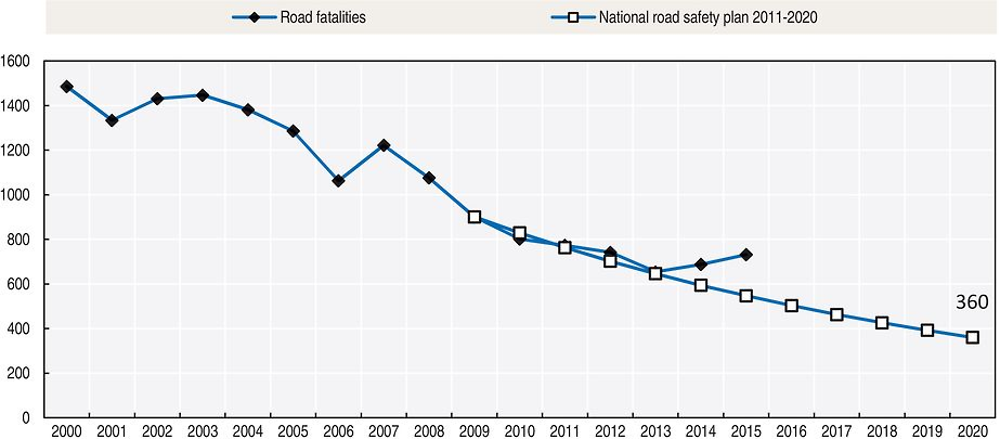
The main target of the National Road Safety Strategic Plan for the years 2011-20 is to decrease the fatality rate (deaths per 100 000 inhabitants) to the European average. This corresponds approximately to a 60% reduction in fatalities by 2020 compared to 2009. The second target is a reduction by 40% in the number of persons seriously injured.
Monitoring targets
Interim targets for the number of fatalities and persons seriously injured have been set for each year until 2020. Results are monitored annually by the BESIP for the Government Council of Road Traffic Safety at national and regional levels. Other safety indicators (speed, drink driving, drug driving, use of seat belts and helmets, and use of mobile phone while driving) are also regularly monitored.
While the country was on track in 2013, the interim target for 2014 (fewer than 594 road fatalities) was not achieved as 688 people were killed. In 2015, the interim target was again not reached (732 fatalities against 547 targeted).
New measures are needed to get back on track towards the 2020 target, including more enforcement, traffic education, a strengthened driving license system, traffic infrastructure audit and inspection, the penetration of safer vehicles into the fleet, etc.
Recent safety measures (2013-16)
Road safety management
-
Since 2014, the new civil code includes an article regarding higher financial compensation from the guilty drivers to the crash victim.
-
The improvement of the penalty point system is under discussion.
-
Traffic enforcement is being intensified.
Road users
Speed management
-
Mobile speed cameras are being deployed.
Protective equipment
-
The compulsory use of helmets by all cyclists is under discussion.
Traffic control
-
Systems to detect right-of-way violations are being implemented.
Education and awareness
-
Work is underway to implement an improved curriculum in driving schools.
-
Since 2013, there is a new system of traffic education in schools.
Infrastructure
-
Since 1 January 2016, the road network has been reclassified. All expressways were reclassified as motorways. Therefore the length of the motorway network increased from 776 km to 1 235 km.
-
Road safety audits and inspections and road infrastructure assessments are being conducted.
-
Traffic calming measures are being implemented.
-
Safety improvement of railway crossings has become a priority.
Vehicles
-
Discussions are underway for Antilock Braking Systems (ABS) and Electronic Stability Control (ESC) to become standard equipment in new vehicles.
Recent and ongoing research
Some research projects of CDV are presented below:
-
in-depth accident analysis
-
road infrastructure assessment
-
safety improvement of railways crossings
-
prediction models of accidents
-
human factor analysis.
References
Websites
-
CDV, Transport Research Centre: www.cdv.cz.
-
Ministry of Transport: www.mdcr.cz.
-
Police of the Czech Republic: www.policie.cz.
-
Road safety observatory: www.czrso.cz.
-
In-depth accidents analysis: http://hadn.cdvinfo.cz.
-
Road traffic infrastructure improvement: http://veobez.cdvinfo.cz.
← 1. All data stem from CDV (Centrum dopravního výzkumu: Czech Transport Research Centre) and IRTAD unless otherwise noted. For more information please contact: [email protected]