How's life in the Netherlands?

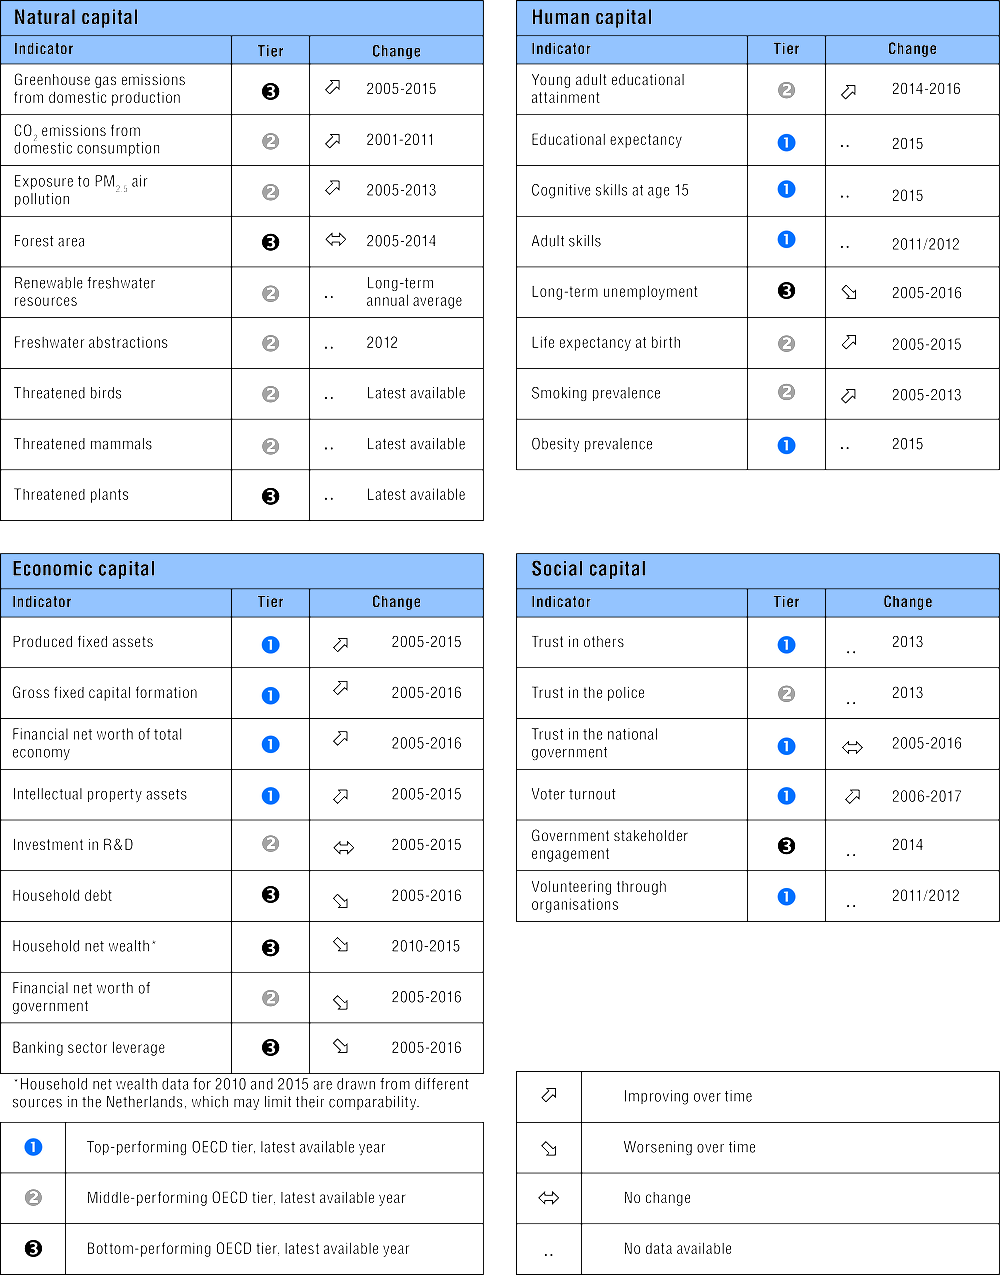
In general, the Netherlands performs well across the OECD’s headline well-being indicators relative to the other OECD countries. Household net wealth was about half of the OECD average level in 2015, but average earnings (around 53 000 USD in 2016) are nearly 20% higher than the OECD average. The Netherlands benefits from comparatively low levels of both labour market insecurity and job strain. In addition, less than 1% of employees regularly work very long hours, the lowest share in the OECD. However, the long-term unemployment rate in 2016 stood at 3%, above the OECD average of 2.3%. Housing conditions in the Netherlands are good, but air quality (assessed in terms of exposure to PM2.5 air pollution) is close to the OECD average. 77% of the adult working-age population have completed at least an upper secondary education, compared to the OECD average of 75%, and the literacy and numeracy skills of Dutch adults are among the highest in the OECD. Personal security is also good, and life satisfaction is just above the OECD average level.

Figure 5.23. The Netherlands’ average level of current well-being: Comparative strengths and weaknesses
picture

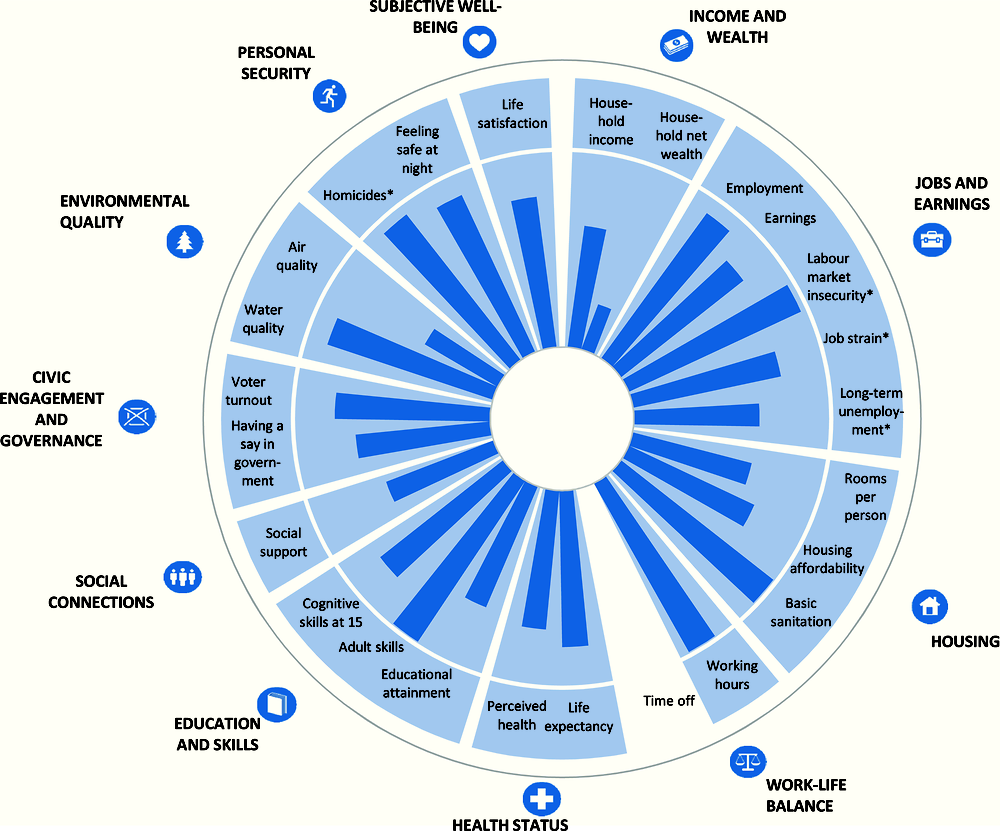
Note : This chart shows the Netherlands’ relative strengths and weaknesses in well-being when compared with other OECD countries. For both positive and negative indicators (such as homicides, marked with an “*”), longer bars always indicate better outcomes (i.e. higher well-being), whereas shorter bars always indicate worse outcomes (lower well-being). If data are missing for any given indicator, the relevant segment of the circle is shaded in white.

 StatLink https://doi.org/10.1787/888933599289

Change in the Netherlands’ average well-being over the past 10 years

Dimension

Description

Change

Income and wealth

Household net adjusted disposable income increased steadily by 8% from 2005 to 2009, but then fell gradually until 2013, before resuming growth in 2014. Its current level is now 8% higher (in real terms) than in 2005. Household net wealth fell by 16% cumulatively between 2010 and 2015, in real terms.*

Jobs and earnings

The employment rate in 2016 was 3.3 percentage points higher than in 2005 but remains over 1 percentage point below its 2008 peak. Despite minor setbacks in 2011 and 2014, real earnings have increased overall in the last decade, and are now 8% higher than in 2005. Labour market insecurity has risen since 2010, and long-term unemployment rose sharply in recent years, peaking at 3% in 2015. The proportion of employees experiencing job strain has remained relatively stable.

Housing conditions

The number of rooms per person has remained stable over the past decade. Housing has become slightly less affordable, with the proportion of disposable income spent on housing rising from 19.1% in 2005 to 19.5% in 2015. The share of people living in dwellings without basic sanitary facilities has been kept at 0% over the past decade.

Work-life balance

The proportion of employees working 50 hours or more per week has seen little change over the last 10 years.

Health status

Despite falling slightly between 2014 and 2015, life expectancy at birth has increased by around 2 years overall since 2005. The percentage of adults reporting to be in “good” or “very good” health has remained stable.

Education and skills

The 10-year change in upper secondary educational attainment cannot be assessed, due to a recent break in the data. However, between 2014 and 2016, attainment rates increased by 1.2 percentage points.

Social connections

The percentage of people who have relatives or friends whom they can count on to help in case of need has fallen from 94% to 90% in the last 10 years.

Civic engagement

Voter turnout has increased over the past decade. In the 2017 general elections, the percentage of votes cast among the population registered to vote stood at 82%: this is 2 points higher than in 2006, and 7 points higher than in 2010.

Environmental quality

Satisfaction with local water quality has remained relatively stable in the Netherlands. However, annual exposure to PM2.5 air pollution has improved over the past decade, and in 2013 was 10% lower than in 2005.

Personal security

Compared to 2005, personal security has improved: the rate of deaths due to assault has fallen from 1.1 to 0.6 per 100 000, and the share of people who report feeling safe when walking alone at night has risen from 73% to 81%.

Subjective well-being

Current life satisfaction levels are very similar to those reported a decade earlier.

* Household net wealth data for 2010 and 2015 are drawn from different sources in the Netherlands, which may limit their comparability.

For each indicator in every dimension: ➚ refers to an improvement; ↔ indicates little or no change; and ➘ signals deterioration. This is based on a comparison of the starting year (2005 in most cases) and the latest available year (usually 2015 or 2016). The order of the arrows shown in column three corresponds to that of the indicators mentioned in column two.

The Netherlands’ resources and risks for future well-being: Illustrative indicators

picture