Health expenditure by type of service
How health spending is split between the various services and goods reflects a variety of factors, from disease burden and system priorities to organisational aspects and costs. Spending on inpatient and outpatient care combined accounts for the major part of health expenditure across OECD countries – almost two-thirds of health spending on average in 2015 (Figure 7.12). A further 19% of health spending was accounted for by medical goods (mainly pharmaceuticals), while 14% went on long-term care services. The remaining 6% was spent on prevention and public health services as well as on the overall governance and administration of the health system.
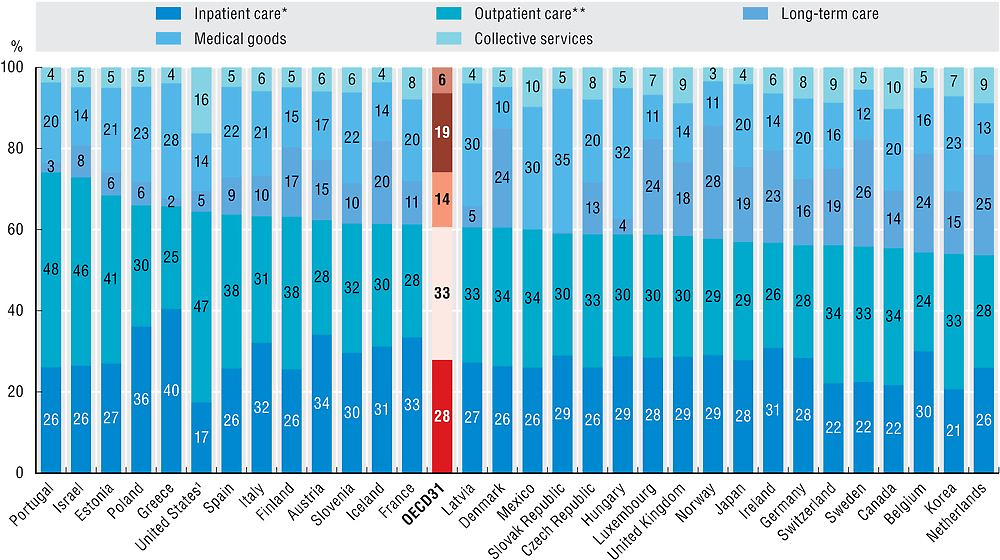
Note: Countries are ranked by curative-rehabilitative care as a share of current expenditure on health.
* Refers to curative-rehabilitative care in inpatient and day care settings. ** Includes home care and ancillary services.
1. Inpatient services provided by independent billing physicians are included in outpatient care for the United States.
Source: OECD Health Statistics 2017.
Greece has a particularly high share of spending on inpatient care (including day care in hospitals) – accounting for 40% of its health spending in 2015. Inpatient care also plays an important role in Poland, Austria and France, taking up more than a third of total spending. Countries with a high share of outpatient spending include Portugal (48%) and Israel (47%). The United States also consistently reports one of the highest shares of outpatient care. However, this includes physicians’ fees in cases where they independently bill patients for hospital care.
The third major category of health spending is on medical goods. Variations can be due to a number of factors such as the different distribution channels in place, the extent of generic use as well as the relative prices of pharmaceuticals. In the Slovak Republic (35%) and Hungary (32%), medical goods represent the largest component of health spending. The share is also high in Latvia, Mexico and Greece, at around 30%. In Denmark, Luxembourg and Norway, on the other hand, spending on medical goods represents only 10-11% of health spending.
There are also differences between countries in the amount of health expenditure on long-term care services (see Chapter 11). Norway, Sweden and the Netherlands, with their established formal arrangements for the elderly and the dependent population, allocate more than a quarter of all health spending to long-term care. Whereas in many Southern European and Central and Eastern European countries with more informal long-term care sectors, spending on long-term care services accounts for a much smaller share.
The slowdown in health spending experienced in many OECD countries following the economic crisis affected all parts of the health sector, but to varying degrees (Figure 7.13). Expenditure for pharmaceuticals contracted annually by 0.5% after positive annual increases of 2.3% during the pre-crisis years and even stronger growth in the 1990s and early 2000s. Despite initially protecting public health budgets, prevention spending growth also turned negative in around half of OECD countries after 2009. On average, spending on preventive care contracted by 0.2% on an annual basis, after recording very high growth rates during the period 2003-09 (4.6%). Part of the reversal in spending growth can be explained by the H1N1 influenza epidemic, which led to significant one-off outlays for vaccinations in many countries around 2009 (Gmeinder et al., forthcoming).
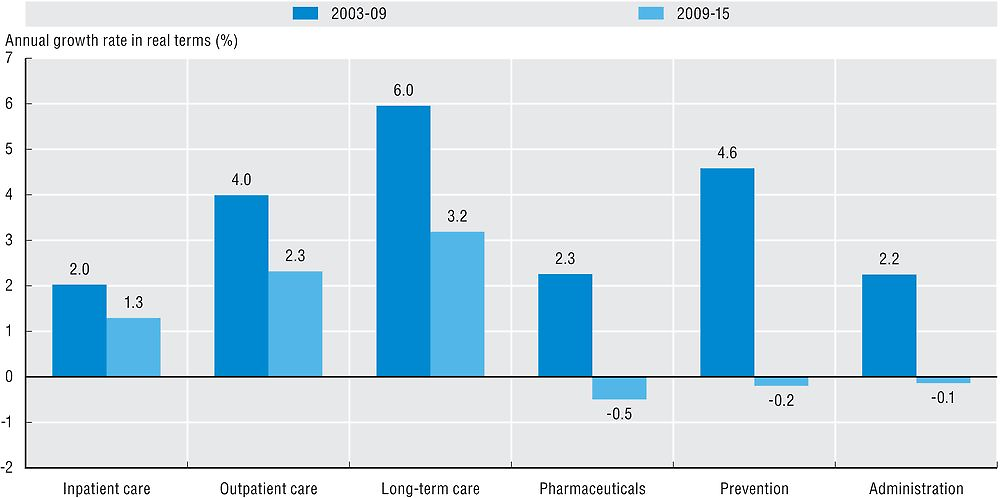
Source: OECD Health Statistics 2017.
While spending on inpatient, outpatient and long-term care has continued to grow, the rates have also significantly reduced since 2009. Expenditure growth for outpatient care nearly halved overall (4% vs 2.3%), but remained positive in the majority of OECD countries. Some governments decided to protect expenditure for primary care and front-line services while looking for cuts elsewhere in the health system. The annual average growth rate for inpatient care dropped to almost half of its previous growth rate, down from 2%, and turned negative between 2009 and 2015 in around one-quarter of OECD countries. Reducing wages in public hospitals, postponing staff replacement and delaying investment in hospital infrastructure were among the most frequent measures taken in OECD countries to balance health budgets.
The System of Health Accounts (OECD, Eurostat and WHO, 2017) defines the boundaries of the health care system from a functional perspective, with health care functions referring to the different types of health care services and goods. Current health expenditure comprises personal health care (curative care, rehabilitative care, long-term care, ancillary services and medical goods) and collective services (prevention and public health services as well as administration – referring to governance and administration of the overall health system rather than at the health provider level). Curative, rehabilitative and long-term care can also be classified by mode of provision (inpatient, day care, outpatient and home care).
Concerning long-term care, only the health aspect is reported as health expenditure, although it is difficult in certain countries to separate out clearly the health and social aspects of long-term care. Thus, estimations of long-term care expenditure continue to be one of the main factors limiting comparability across countries.
For the calculation of growth rates in real terms, economy-wide GDP deflators are used.
References
Gmeinder, M., D. Morgan and M. Mueller (2017, forthcoming), “How Much Do OECD Countries Spend on Prevention?”, OECD Health Working Paper, OECD Publishing, Paris.
OECD, Eurostat and WHO (2017), A System of Health Accounts 2011: Revised edition, OECD Publishing, Paris, https://doi.org/10.1787/9789264270985-en.