Norway
-
GDP per capita remains high relative to other advanced OECD countries, both in terms of total and mainland GDP. However, growth in GDP per capita has decelerated in recent years due to declining labour utilisation and weaker labour productivity growth.
-
Inequality, as measured by the Gini coefficient, remained stable since 2008 and is well below the OECD average. The share of national income going to the poorest also surpasses the OECD average.
-
The government has taken actions in a number of Going for Growth 2015 priority areas, namely the sickness and disability schemes, product market competition, secondary education, agriculture support, and tax system. A new Disability Pension system that is separated from the old pension system was introduced and measures were enacted to promote competition in postal and rail services. In education, recent initiatives focus on improving teaching quality and boosting tertiary completion rates, including through merging higher education institutions. Norway has notably increased taxation of secondary homes and has streamlined tax expenditures, reducing tax system distortions.
-
Lowering the tax burden and shifting the tax mix from direct to indirect sources would encourage business enterprise and productivity growth, while further reform of the sickness and disability schemes would raise labour supply. Stronger education outcomes are key to higher productivity and well-being. High quality tertiary education is essential in this regard. Raising product market competition and reducing agricultural support would also boost productivity.
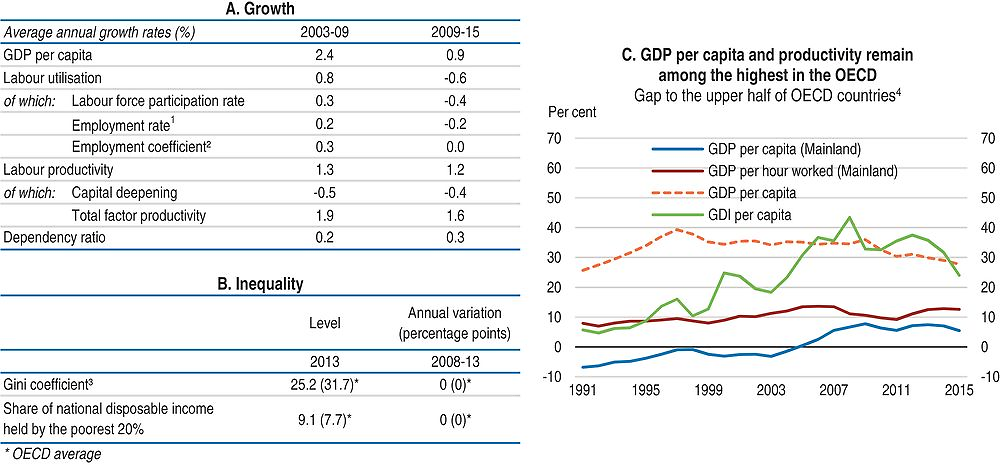
1. The employment rate is defined with respect to the economically active population; a positive growth rate corresponds to a decline in the structural unemployment rate and vice-versa.
2. This adjustment variable is added to the decomposition to capture the impact of non-resident workers.
3. The Gini index measures the extent to which the distribution of disposable income among households deviates from perfect equal distribution. A value of zero represents perfect equality and a value of 100 extreme inequality.
4. Percentage gap with respect to the weighted average using population weights of the highest 17 OECD countries in terms of GDP per capita, GDP per hour worked and GDI per capita (in constant 2010 PPPs). GDP per capita (Mainland) excludes petroleum production and shipping. While total GDP overestimates the sustainable income potential, mainland GDP slightly underestimates it since returns on the financial assets the petroleum fund holds abroad are not included.
Source: Panel A: OECD, Economic Outlook No. 100 Database; Panel B: OECD, Income Distribution Database; Panel C: OECD, National Accounts and Productivity Databases; Statistics Norway.
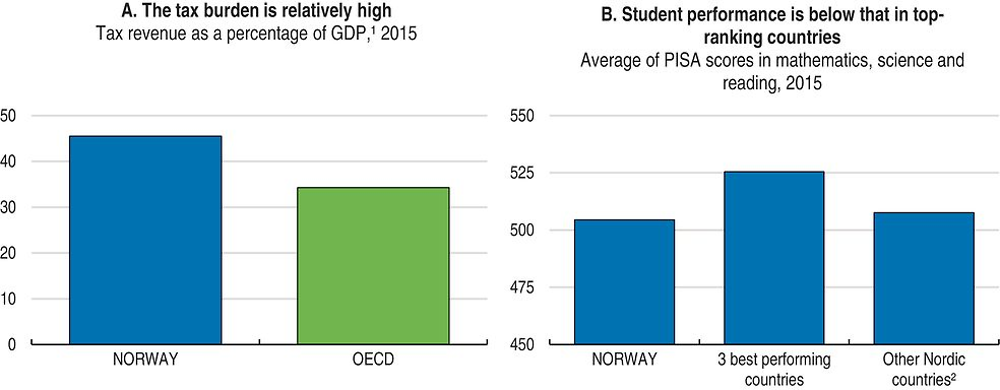
1. For Norway, data refer to non-oil tax revenue as a percentage of mainland GDP.
2. Average of Denmark, Finland and Sweden.
Source: Panel A: OECD, Revenue Statistics Database; Panel B: OECD, PISA Database.
Going for Growth 2017 priorities
Lower the tax burden and improve the efficiency of the tax system by shifting the mix toward indirect taxes. A shift towards indirect taxation would encourage business enterprise and productivity growth.
Actions taken: The rate of corporate taxation was reduced from 27% to 25% in 2016 (with a parallel cut in the ordinary rate of personal income tax), with plans for a further reduction. The lowest value-added tax rate of 8% was increased to 10%, helping financing the reform.
Recommendation: Use fiscal space to lower the tax burden. Proceed with plans to further cut the corporate tax rate, while broadening the tax base through, for instance, additional measures to counter base erosion and profit shifting. In addition make greater use of property taxation. Any move towards greater reliance on indirect taxation requires a careful assessment of its distributional impact.
Strengthen performance in secondary and tertiary education. Performance in secondary education is middle ranking and completion rates in upper secondary vocational and tertiary education are low, despite a high level of public spending.
Actions taken: Current reforms aim to promote teaching quality, including through stricter requirements for teaching courses entry and new career paths for teachers. In higher education, a merging process reduced the number of institutions from 53 to 42 in 2016. Implementation of a new funding system has begun.
Recommendations: Monitor closely, and adjust if needed, the outcomes of the new measures for teachers. Reduce the number of schools to achieve economies of scale. Raise school and teacher accountability. Continue to promote mergers in higher education. Include the graduation rates in the formula for performance-based funding for higher education. Link further student support to completions.
Further reform disability and sickness benefit schemes. Sickness leave and disability benefits still serve as pathways to early retirement, discouraging labour supply and reducing employment opportunities.
Actions taken: Since 2015 the calculation of disability benefits has been similar to those for the Work Assessment Allowance rather than those for old-age pensions. A faster tapering rule for disability benefits was also introduced. The government has implemented (October 2015) a new medical assessment after six months of sick leave for a trial period of one year.
Recommendations: Evaluate, as envisaged, the new medical assessment for sick leave. Further tighten access to sickness and disability schemes through more “third party” assessment and stronger enforcement of back-to-work plans. If such reforms do not lower take up, reduce the generosity of payment for long-term sickness absence and lengthen the employer-financed phase of sick leave.
Increase product market competition. Public ownership and entry barriers act as a barrier to competition and to stronger productivity growth.
Actions taken: The government has received parliamentary approval for sale in several enterprises, including reduction in the state’s holding in the telecoms company Telenor. A reform of the rail sector (approved in June 2015) has strengthened the division between the network and service provision. A new Act came into force in 2016 stipulating the abolition of Norges Posten’s monopoly on letters below 50 grammes, along with some lightening of the incumbent’s universal service requirements.
Recommendations: Promote competition in network industries by further reducing state ownership of business enterprises and continuing reforms for liberalising postal and rail services. Reduce entry barriers in some services, notably in retail, by pressing-on with deregulation in shop-opening hours.
Reduce producer support to agriculture. A highly protected agriculture sector discourages the efficient use of resources.
Actions taken: Production-level caps in some agriculture support mechanisms were raised in 2015 with a view to encourage a shift to larger-scale units.
Recommendations: Import tariffs and cash subsidies for farmers should be put on a downward trajectory and legislative biases that favour agriculture should be removed. Strengthen the links between policy objectives and pay-outs for cultural and environmental support mechanisms.
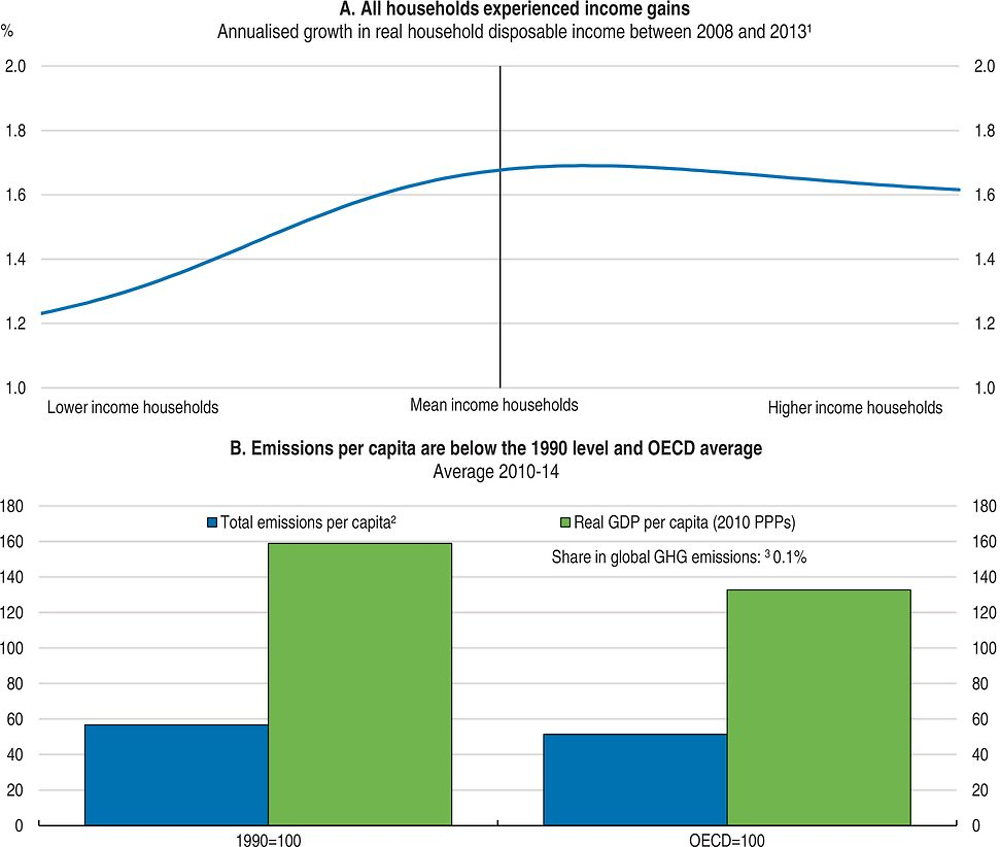
1. The data show average annual growth rates in disposable income (i.e. income after tax and transfers) across the distribution and refer to the period between 2008 and 2013. Disposable incomes cover the full population. Income data are expressed in constant prices (OECD base year 2010).
2. Total GHG emissions including LULUCF in CO2 equivalents (UNFCCC). The OECD average (excluding Israel and Korea) is calculated according to the same definition.
3. Share in world GHG emissions is calculated using International Energy Agency (IEA) 2010 data.
Source: Panel A: OECD, Income Distribution Database; Panel B: OECD, National Accounts and Energy (IEA) Databases, United Nations Framework Convention on Climate Change (UNFCCC) Database.