General government fiscal balance
The fiscal balance is the difference between general government revenues and expenditures showing how much in a given year government spending is financed by the revenues collected. A surplus occurs if, in a given year, government collects more revenues that it spends. Conversely, when the government spends more than it receives in revenues, there is a deficit. Consecutive deficits will lead to increasing debt levels and consequently to higher interest payments.
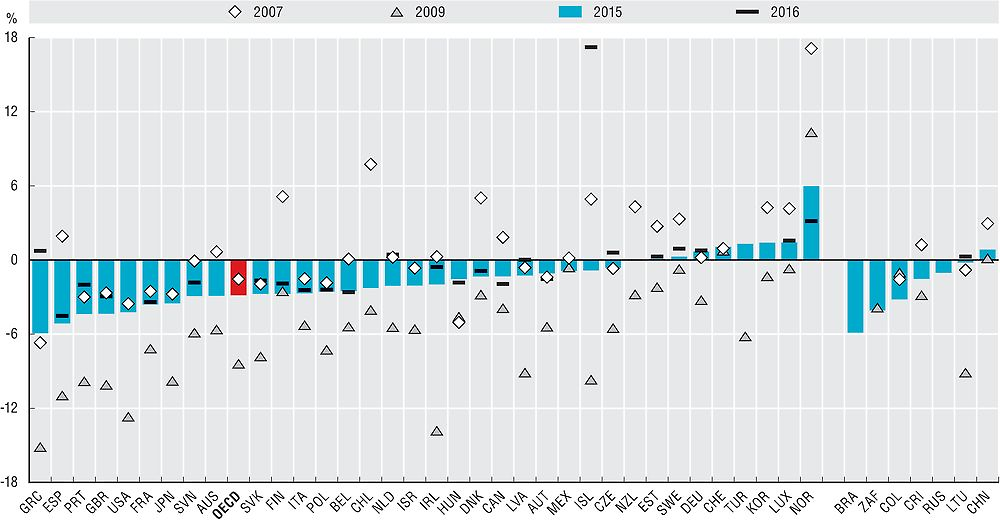
Overall fiscal balances among OECD countries have continued to stabilize following the international financial crisis. As the pressure for fiscal consolidation that accumulated at the outset of the crisis continues to subside, fiscal balances have improved: among OECD countries, the average balance in 2015 reached -2.8% of GDP, improving from the low of -8.4% in 2009. In 2015, Norway had the largest fiscal surplus, reaching 6% of GDP in tandem with the country’s fiscal rules, followed by Luxemburg (1.4%), Korea (1.4%), Turkey (1.3%) and Chile (1.1%). In contrast, the largest fiscal deficit was in Greece (5.9%), as growth continued to falter, followed by Spain (5.1%), Portugal (4.4%), the United Kingdom (4.3%) and the United States (4.2%).
As for 2016, fiscal balances ranged from a -4.5% deficit in Spain to a 17.2% surplus in Iceland. Fiscal consolidation in Greece has yielded a surplus of 0.7% of GDP for the first time after reaching a trough in 2009 of 15.1% deficit of GDP. Iceland’s large surplus was the product of extraordinary revenues stemming from estate contributions from banks involved in the country’s financial crisis, which amounted to a 52% increase of overall fiscal revenues.
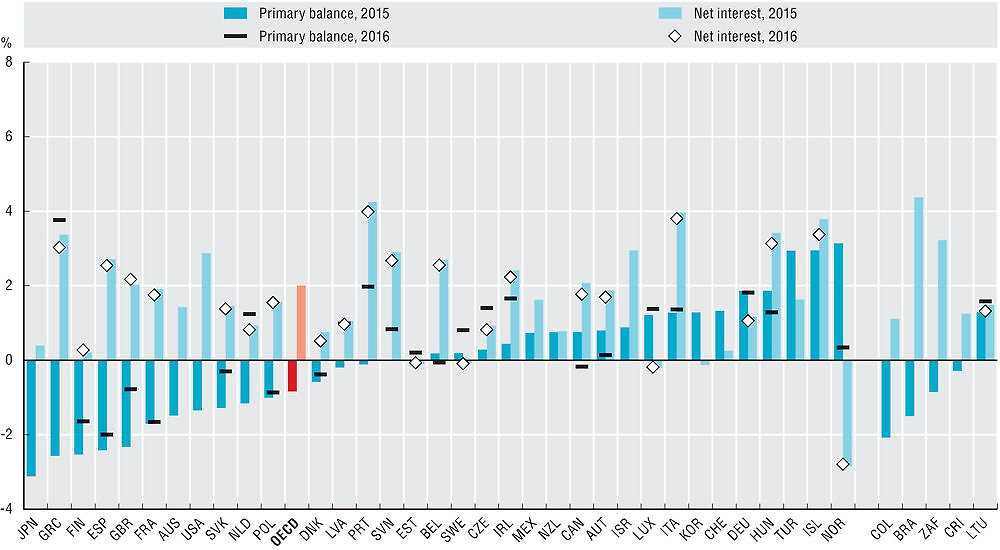
The primary balance – that is, the overall fiscal balance excluding net interest payments on public debt – is a particularly important feature of short-run sustainability, as it illustrates to what extent a government can honour its obligations without incurring additional debt. Side by side with net interest payments for debt servicing, which constitute an inflexible part of public budgeting, the primary balance provides a clearer picture of the state of fiscal management in a country.
In 2015, of the 2.8% of GDP deficit on average for OECD countries, 2% of GDP represented net interest payments, which resulted in an average primary balance of -0.8% of GDP. The largest primary deficit in 2015 was in Japan (3.1%), followed by Greece (2.6%), Finland (2.5%), Spain (2.4%) and the United Kingdom (2.3%), while the largest primary surpluses were in Norway (3.1%), Iceland (2.9%) and Turkey (2.9%). Net interest payments were the highest in Portugal (4.2%), Italy (4%), Iceland (3.8%) and Greece (3.4%). Also, from the available information for 2016, Iceland had the largest primary surplus among OECD countries with 20.6% of GDP, a consequence of the aforementioned increase in extraordinary revenues, and Greece registered a primary surplus of 3.8%, while the largest increases in net interest payments as a share of GDP between 2015 and 2016 were for Finland, Norway and the United Kingdom (0.1 p.p. for each). For OECD accession countries in 2015, Colombia had the largest deficit, with 3.2% of GDP in 2015, followed by Costa Rica (1.5%) and Lithuania (0.2%).
Fiscal balance data are derived from the OECD National Accounts Statistics (database), based on the System of National Accounts (SNA), a set of internationally agreed concepts, definitions, classifications and rules for national accounting. The updated 2008 SNA framework has been now implemented by all OECD countries (see Annex A for details on reporting systems and sources). Using SNA terminology, general government consists of central government, state government, local government and social security funds. Fiscal balance, also referred to as net lending (+) or net borrowing (-) of general government, is calculated as total government revenues minus total government expenditures. Revenues encompass taxes, net social contributions, and grants and other revenues. Expenditures comprise intermediate consumption, compensation of employees, subsidies, property income (including interest spending), social benefits, other current expenditures (mainly current transfers) and capital expenditures (i.e. capital transfers and investments). The primary balance is the fiscal balance excluding net interest payments on general government liabilities (i.e. interest payments minus interest receipts). Gross domestic product (GDP) is the standard measure of the value of goods and services produced by a country during a period.
Further reading
OECD (2015), National Accounts at a Glance 2015, OECD, Paris, https://doi.org/10.1787/na_glance-2015-en
Statistics Iceland (2017), “General government finances 2016”, Statistics Iceland, Reykjavik, http://www.statice.is/publications/publication-detail?id=57984
Figure notes
Data for Brazil, Costa Rica and South Africa are for 2014 rather than 2015.
2.1: Data for Chile and Turkey and are not included in the OECD average because of missing time series or main non-financial government aggregates. Data for China and Russia are for 2014 rather than 2015.
2.2: Data for Chile are not available. Data for Turkey and are not included in the OECD average because of missing time series. The value of the primary balance for Iceland of 20.6 of GDP in 2016 is not displayed in the graph.
Information on data for Israel: https://doi.org/10.1787/888932315602.
Source: OECD National Accounts Statistics (database). Data for the other major economies of India and Indonesia are from the IMF Economic Outlook (April 2017).
Source: OECD National Accounts Statistics (database).