Performance budgeting
The OECD Principles of Budgetary Governance call on countries to “ensure that performance, evaluation and value for money are integral to the budget process”. Within the OECD, the evolution of performance budgeting spans decades with governments using performance information to inform allocation and prioritisation of resources, promote accountability and transparency, and build a culture of performance to increase administrative efficiency and improve public services.
Results from the 2016 OECD Performance Budgeting Survey confirm that performance budgeting frameworks remain the norm across the OECD as reported by 26 member countries (25 compulsory and one optional). By their use, governments report having been most successful in advancing accountability and transparency and promoting a culture of performance. Among countries that report no framework, line ministries may still develop their own (Belgium and Israel) or may receive guidance on the structure and content of strategic plans and performance reports (United States).
Over two-thirds of countries with frameworks use performance information in budget negotiations (18 countries), thus explicitly linking performance to allocation decisions. Two countries without frameworks report similar use. Compared to the 2007 and 2011 survey responses, countries report more consequences for poor performance, with management consequences, in particular publicising poor performance, as the most likely. Budgetary consequences are less common but budget freezes and budget increases are more likely than budget decreases. The scope of performance frameworks ranges from very broad (key national indicators and systematic indicators/targets set for all programmes) to more focused (indicators/targets set for most or only priority programmes). Use of performance information in budget negotiations is frequent across all types of frameworks. However, consequences for poor performance appear much more likely to be triggered in countries that have more focused frameworks and that were early adopters of performance budgeting.
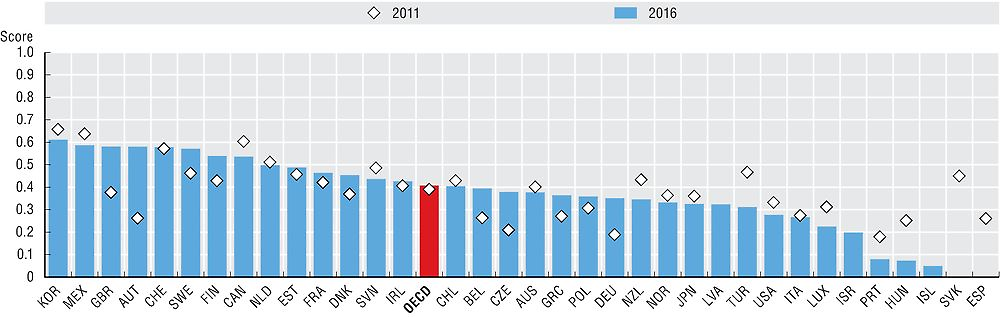
The 2016 OECD Performance Budgeting Index shows the degree to which performance budgeting practices exist and are used at the central level of government, although it does not measure how successful they are in practice. While a fall in the overall specification of performance frameworks has been observed since 2011, there has been an increase in the use of performance information in budget negotiations and decision making and so the index average for all OECD member countries remains similar. There is large variation in performance budgeting practices across the OECD, reflected in the range of scores observed for individual countries. Considerable changes are observed in countries such as Austria, which introduced performance budgeting in 2013 as part of its budgetary reform process; the United Kingdom, where a more integrated performance information framework was introduced in 2015-16; and Germany, where budget documentation has been augmented with performance information since 2013.
Data come from the 2016 OECD Performance Budgeting Survey. Respondents were predominantly senior budget officials and reflect countries’ own assessments of current practices. Data refer only to central/federal governments not state/local levels.
Table 5.1 highlights features of performance budgeting frameworks. Countries use operations data and performance information in budget negotiations if the governments use these in negotiations at least occasionally and usually. The table shows management responses to poor performance if the framework at least occasionally triggers five types of management response. The table shows budgetary consequences to poor performance if the framework at least occasionally triggers two of the following consequences: budget freezes, budget decreases, and budget increases.
This composite index in Figure 5.2 contains 10 variables that cover information on the availability and type of performance information developed, processes for monitoring and reporting on results, and whether (and how) performance information is used. The index does not measure the overall quality of performance budgeting systems. Due to differences between the 2011 and 2016 surveys, some weightings have been adjusted for comparability. Annex 5.1 contains a description of the methodology used to construct this index.
Further reading
OECD (2017), 2016 OECD Performance Budgeting Survey Highlights: Integrating Performance and Results in Budgeting, OECD Publishing, Paris, www.oecd.org/gov/budgeting/Performance-Budgeting-Survey-Highlights.pdf.
Shaw, T. (2016), “Performance budgeting practices and procedures”, OECD Journal on Budgeting, Vol. 15/3 OECD Publishing, Paris, https://doi.org/10.1787/budget-15-5jlz6rhqdvhh.
Figure notes
5.1: Includes 24 of the 26 OECD countries that report using a performance budgeting framework. Iceland has a compulsory framework but is not included as its survey response does not provide the necessary data. Japan is not included as it has an optional framework. Belgium, Greece, Hungary, Israel, Luxembourg, Portugal and the United States report no standard performance budgeting framework.
5.2: Data for Spain and the Slovak Republic are not available as they did not respond to the 2016 survey. 2011 data for Iceland and Israel are not available as they did not respond to the 2011 survey. Latvia was not an OECD country in 2011. Iceland, Israel, Latvia, Spain and the Slovak Republic were excluded from the OECD average due to missing time series.
Information on data for Israel: https://doi.org/10.1787/888932315602.
Source: OECD (2016), Survey of Performance Budgeting, OECD, Paris.