Producer price indices
A variety of price indices may be used to measure inflation in an economy. These include consumer price indices (CPI), price indices relating to specific goods and/or services, GDP deflators and producer price indices (PPI). Whereas CPIs are designed to measure changes over time in average retail prices of a fixed basket of goods and services taken as representing the consumption habits of households, PPIs aim to provide measures of average movements of prices applied by the producers of various commodities. They are often seen as advanced indicators of price changes throughout the economy, including changes in the prices of consumer goods and services.
Definition
Producer price indices measure the rate of change in prices of products sold as they leave the producer. They exclude any taxes, transport and trade margins that the purchaser may have to pay. Manufacturing covers the production of semi-processed goods and other intermediate goods as well as final products such as consumer goods and capital equipment. The indexes shown here are weighted averages of monthly price changes in the manufacturing sector.
Comparability
The precise ways in which PPIs are defined and constructed depend on their intended use. In this context, national practices may differ and these differences may affect cross-country comparability. This is especially the case for aspects such as the weighting and aggregation systems, the treatment of quality differences, the sampling and collection of individual prices, the frequency with which the weights are updated, and in the index formulae used. Differences may also arise concerning the scope of the manufacturing sector and the statistical unit used for measurement. In some countries, for example, indices may reflect price changes in the output of the manufacturing sector as opposed to manufactured products.
While the PPI series for most countries refer to domestic sales of manufacturing goods, those for Australia, Canada, Chile, New Zealand and the United States include prices applied for foreign sales (i.e. “total market”).
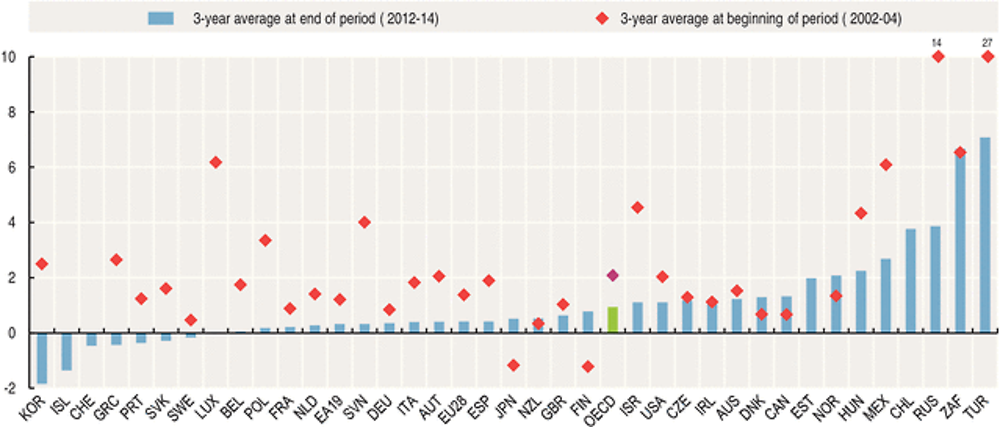
In the 3-year average from 2012-14, producer prices in the OECD area as a whole increased at an annual rate of around 0.9%, a lower rate than recorded in the 3-year average from 2002-04 (2.1%).
Producer prices have been, however, volatile during the whole period (2002-14), and have recorded swings, with peaks in 2008 and 2011 and decreases in 2002, 2009 and 2013. The effect of the financial and economic crisis is particularly noteworthy, with nearly all OECD countries recording negative growth in producer prices in 2009, with the OECD average at minus 4.0% for that year.
Since then the picture has been less clear in producer prices with some OECD countries seeing large increases in 2011 followed by large drops in 2012 and 2013 (Greece, Hungary and the Netherlands), while some have recorded low or continued negative growth (Switzerland and Sweden). The year 2014 shows also diverging patterns among OECD countries, with, on one side, large increases recorded in Turkey and Chile and to a smaller extent in Sweden, Australia, Canada, Japan and Mexico, and a slowdown in producer price inflation rates recorded in New Zealand, the United Kingdom, Belgium and Estonia.
Sources
-
OECD (2015), Main Economic Indicators, OECD Publishing.
Further information
Analytical publications
-
Brook, A.M. et al. (2004), “Oil Price Developments: Drivers, Economic Consequences and Policy Responses”, OECD Economics Department Working Papers, No. 412.
-
OECD (2015), OECD Economic Outlook, OECD Publishing.
Methodological publications
-
International Monetary Fund (IMF) et al. (2004), Producer Price Index Manual: Theory and Practice, IMF, Washington, DC.
-
OECD (2011), Producer price Indices - Comparative Methodological Analysis, OECD, Paris.
-
OECD (2007), Eurostat-OECD Methodological Guide for Developing Producer Price Indices for Services, OECD Publishing.
Online databases
Websites
-
OECD Main Economic Indicators, www.oecd.org/std/mei.