Assessment and recommendations
Ensuring continued convergence with higher living standards
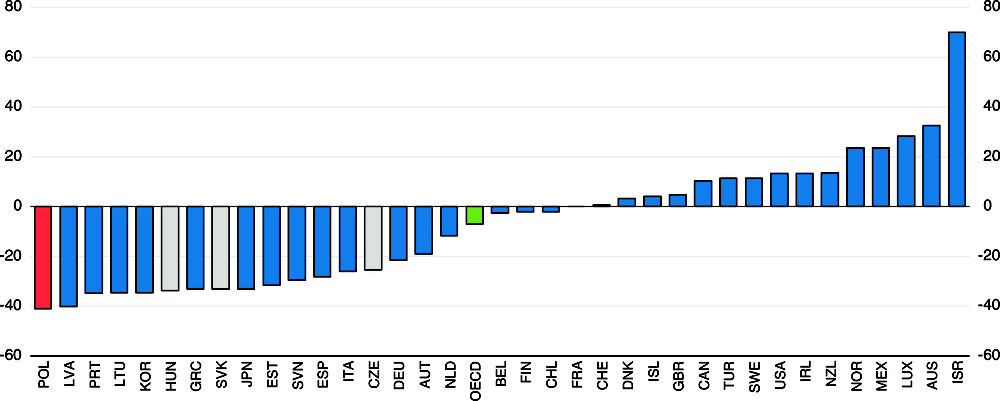
Poland has experienced strong economic growth without any obvious macroeconomic imbalances, the labour market is booming, and the outlook is positive. This is boosting household income and contributing to more inclusive economic development. Catch-up with average living standards in other OECD countries is continuing (Figure 1).
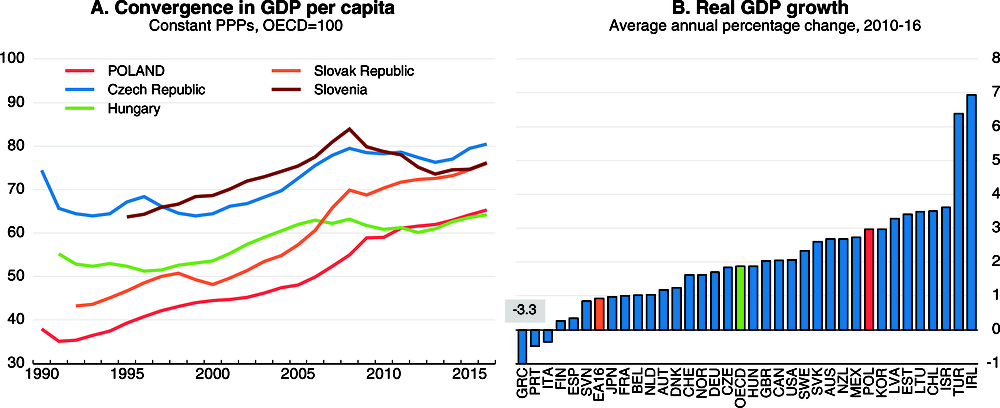
Source: OECD (2018), OECD National Accounts Statistics and OECD Economic Outlook: Statistics and Projections (databases) and updates.
Poland scores at or above the average OECD country in terms of work-life balance, personal safety and education (reflecting above-average PISA scores and high average educational attainment) based on the OECD Better Life Index (Figure 2). Thanks to a long-standing tertiary education boom Poland has a highly qualified workforce and it has been very successful in integrating into global trade, most recently with a boom as an outsourcing destination for increasingly high value added business services. Life expectancy has increased faster over the last 25 years than in most OECD countries (Figure 3) and is projected to increase further. Unlike in other countries, poverty rates and inequality, as measured by the Gini coefficient, have actually declined, as a relatively wide range of households have benefitted from the labour market recovery and rising incomes, and poverty is now close to the EU average (Figure 4). For example, in 2015 the at-risk-of-poverty rate (the share of people with less than 60% of the median household income) was 3 percentage points lower than in 2004. The recent introduction of child benefits has further reduced child poverty significantly, promoting well-being and inclusiveness.
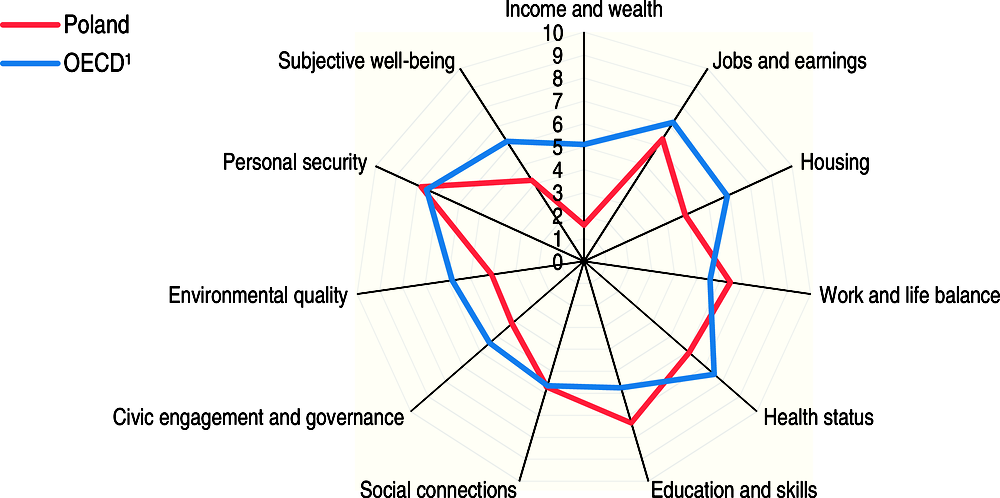
1. Unweighted average.
Source: OECD (2017), OECD Better Life Index, www.betterlifeinitiative.org.
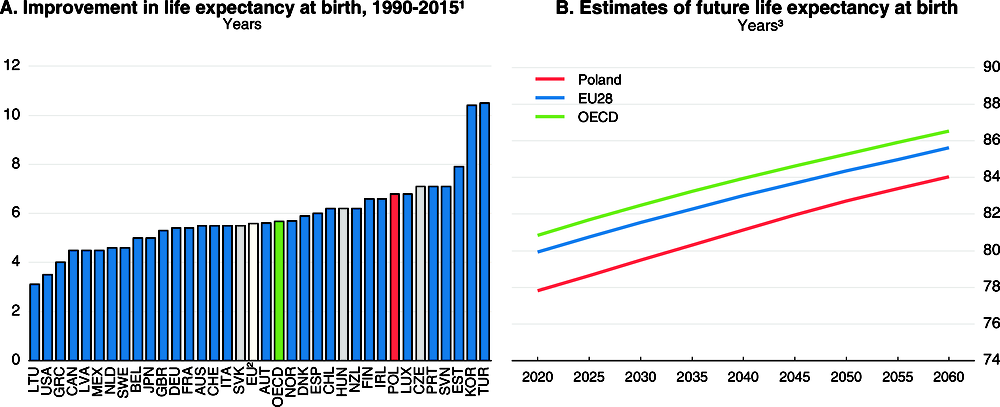
1. Or latest available year; 2002-15 for Latvia.
2. OECD European Union members plus Lithuania.
3. The data displayed are five-year averages.
Source: OECD (2017), OECD Health Statistics (database); United Nations (2017), “World Population Prospects: The 2017 Revision”, Department of Economic and Social Affairs, United Nations, New York.
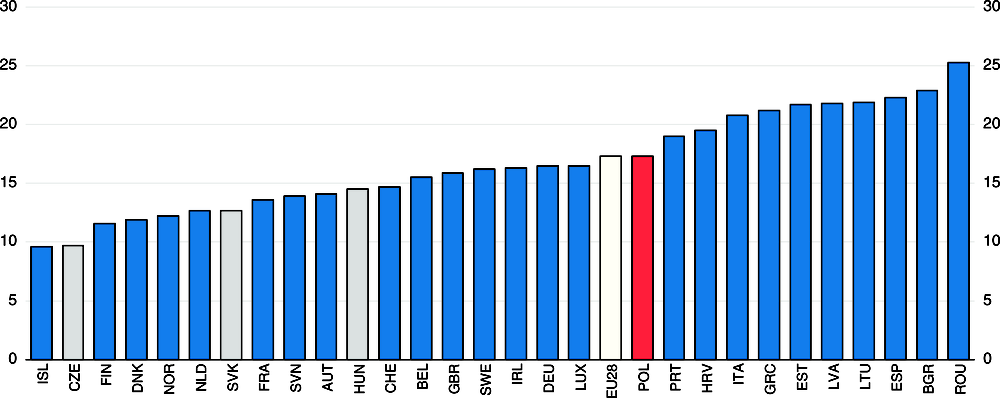
← 1. Or latest available year.
Source: Eurostat (2018), “Income and living conditions”, Eurostat Database.
Poland needs to build on its current economic strength and social progress to confront its challenges. The country scores below the OECD average in terms of health status and environment quality as well as income and subjective well-being (Figure 2). Housing affordability is also a challenge, as Polish households spend a higher share of their incomes on housing, including utility costs and maintenance, than on average in the OECD. Life expectancy remains well below the OECD average and is particularly unequal, as the difference between the lowest and the highest educated men is 12 years compared to 7 years on average in the OECD. In 2015 more than 28 000 people died prematurely as a result of outdoor air pollution, which as a share of the population is higher than almost anywhere else in the OECD. Hourly labour productivity was still roughly 40% below the OECD average in 2016, and, as in other countries, the growth rate of total factor productivity has declined since 2008, curbing economic growth. Poland is confronted with very rapid ageing, as the working-age population might decline by 40% by 2060 according to some projections (Figure 5). The recent lowering of the retirement age is likely to further weigh on seniors’ employment and risk increasing old-age poverty, particularly among women. Despite efforts to improve access to childcare it remains insufficient and expensive, especially in rural areas, and institutional long-term care for the elderly falls significantly short of needs.
Source: United Nations (2017), “World Population Prospects: The 2017 Revision”, Department of Economic and Social Affairs, United Nations, New York.
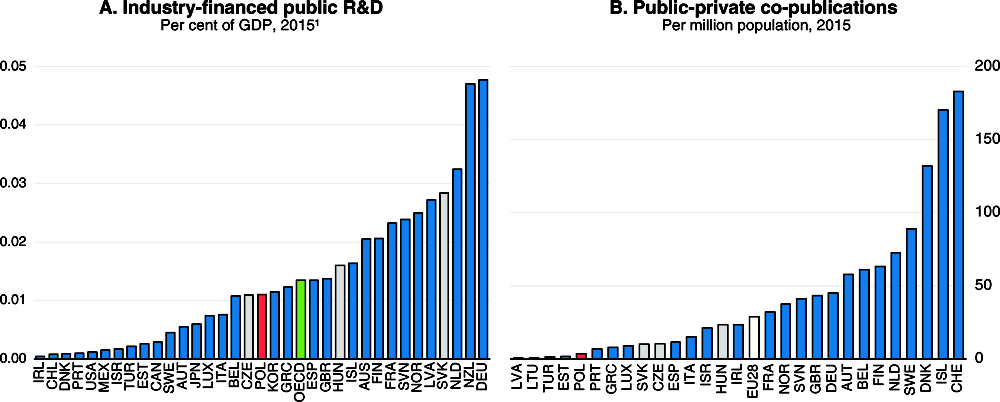
To sustain rising living standards Poland has to develop its capacity to innovate and invest in skills and infrastructure, the key subjects of this report. For now catch-up has been driven to a large extent by a restructuring of the economy from agriculture to more productive sectors and by buying foreign technologies. Indicators of scientific research quality are below those in the leading OECD countries, and business R&D investment remains weak despite rapid recent growth (Figure 6). Vocational training suffers from limited business engagement, and adult learning is not well developed, inhibiting citizens’ ability to acquire stronger basic and digital skills. This is holding back the economy’s capacity to innovate and the ability of Poland’s plentiful small enterprises to adopt new technologies, modernise their organisation and production procedures, and thus improve their productivity and grow. Policies to strengthen higher education, adult learning and vocational education are therefore discussed in what follows. To help Poland confront rapid ageing the Survey also proposes policies to bolster seniors’ and female employment and use the workforce’s skills more effectively, while making Poland more attractive to domestic and foreign workers alike. A large share of public investment in infrastructure is financed by EU Structural Funds – around 50% in the transport sector – along with 85% of programmes to support private-sector innovation, small and medium-sized enterprises and entrepreneurship (Box 1). As it is unclear how the availability of these funds will develop after 2022, a commitment is needed now to ensure continued financing from domestic sources thereafter. The Survey therefore proposes policies to raisehigher public revenues from internal sources.
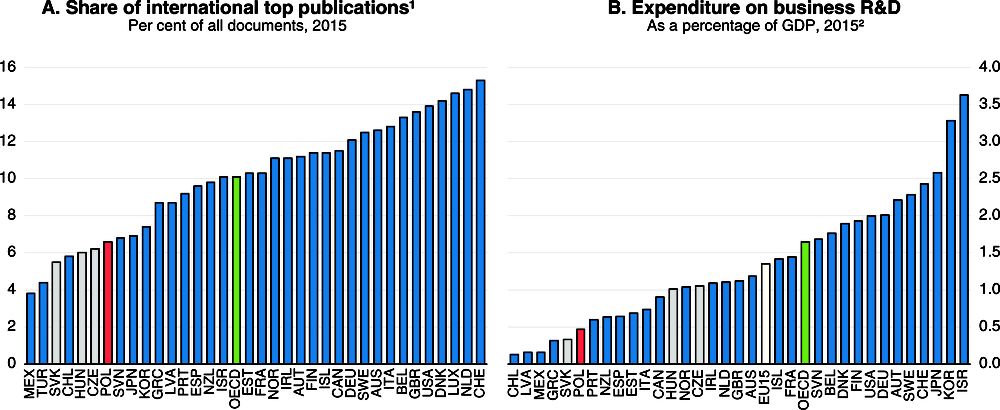
1. Share of the scientific output of domestic research institutions that is included in the set of the 10% most cited papers in their respective scientific fields, fractional counts.
2. Or latest year available.
Source: OECD (2017), OECD Science, Technology and Industry Scoreboard 2017 and OECD Research and Development Statistics (database).
As part of the 2014-2020 EU multiannual financial framework, Poland will receive about 86 billion euros from European structural funds channelled through different programmes, which makes Poland the largest beneficiary of the EU cohesion policy in absolute terms and among the largest on a per capita basis. National co-financing of EU projects by the Polish authorities will top up EU structural funds by 19 billion euros. Investment in network infrastructures in the transport and energy sectors will receive the largest share of funding followed by investments designed at boosting competitiveness of SMEs, investments for accelerating the energy transition and funding for research and innovation. Overall, EU structural funds are expected to amount to about 2.7% of GDP annually and 54% of public investment over the ongoing EU budget window (European Commission, 2017a).
As elsewhere in the European Union, the disbursement of EU funds has been slow. At the end of 2017, only 13% of funds allocated to Poland have been spent and 55% have been assigned to specific projects compared with 16% and 53% on average in the EU, respectively. The slow pace at which EU funds are spent is, however, in line with the previous EU budget period (European Commission, 2017b). It is worth noting that EU funds can be disbursed up to two years after the end of the budget period. This explains the large boost in public investment in Poland in 2015 – the final year for which expenditures could be claimed against the 2007-2013 EU budget framework – and the subsequent large decline in public investment in 2016.
Going forward, several factors could reduce the amount of EU structural funds received by Poland in the next EU budget period extending from 2021-2027. First, the exit of the United Kingdom from the European Union will reduce the size of the EU budget, and thereby the financing available for EU cohesion policy. Second, Poland’s relatively quick convergence to the average EU income level will likely limit Poland’s access to EU cohesion funds. Third, a change in the requirements for the attribution of EU structural funds, e.g. conditions based on the implementation of structural reforms, may also reduce the amount of EU cohesion funds received by Poland.
Against this backdrop this Survey has four main messages:
-
Investment in higher education and research is too low, and conditions and incentives for excellence and stronger industry-science collaboration are insufficient.
-
Firms’ engagement in vocational education is weak, and so is workers’ access to adult learning, thereby impacting negatively on productivity and equality of opportunity.
-
Counteracting the impact of demographic change on employment and avoiding a rise in old-age poverty, in particular among women, requires: making pensioners aware of the benefit of working longer for their pension income; investing in childcare and long-term care services and other policies to facilitate having children and combining work with family life; and making Poland attractive for foreign and domestic workers alike.
-
Tax reform could secure financing for higher social spending, as well as much needed skills, research and infrastructure investments, while improving the system’s impact on inequality and the environment.
Poland’s Strategy for Responsible Development adopted in February 2017 (Box 2) aims to address a number of these challenges.
The Strategy for Responsible Development sets out a vision to strengthen industry, innovation and infrastructure in Poland and lays the basis for higher income and more social cohesion. It is the authorities’ plan to meet the objectives from the 2030 Agenda for Sustainable Development. It proposes over 700 actions together with more than 70 indicators to track progress in strengthening industry, e.g. by promoting digitalisation and focusing government support on sectors where Poland is believed to have a competitive advantage. It provides for stepped up support for SMEs, simplification of regulation and tax payments, stronger export promotion, and vocational and higher education reform along with greater support for innovation and exports and energy investments. The increase in child benefits along with further development of childcare services is seen as a policy to lower child poverty and counter demographic challenges. The Strategy also mentions the need to develop migration policies and incentives for older workers to stay longer in the labour market, although without specifying details.
Quantitative targets include:
-
Increase total R&D spending from 1% of GDP in 2015 to 1.7% in 2020 and 2.5% in 2030.
-
Increase investment from 20.7% of GDP in 2015 to 22-25% in 2020 and 25% in 2030.
-
Lower the at-risk-of-poverty rate from 17.6% in 2015 to 14% in 2020 and 12% in 2030.
While the government has set up policies that can help reach these targets, early trends suggests that greater progress will be needed in the future. R&D spending fell to below 1% of GDP in 2016. Following a contraction in private and public investment owing to the switchover of budget periods for EU structural funds, but also heightened uncertainty, the investment rate fell below 20% in 2016-17. While the new child benefits have helped lower extreme poverty, particularly among children, the relative rate of poverty, defined as the share of people living with less than 60% of median household income, fell only slightly to 17.3% in 2016 before the impact of the new child benefits was felt.
The macroeconomic outlook is positive
Economic activity is firming, as growth was 4.6% in 2017, before decelerating somewhat in 2018-19 (Table 1). With potential growth estimated by the OECD at less than 3%, this resulted in the estimated output gap turning positive in 2017. However, there are substantial uncertainties surrounding future employment and trend productivity growth and output gap estimates from other institutions imply less pressure on capacity utilisation in the future. Private consumption has grown at its fastest rate since 2008, on the back of strengthening wage gains, as the labour market is becoming increasingly tight, and the new child benefit programme, which is estimated to have increased aggregate real disposable income by 2.2%. The majority of domestic savings comes from the corporate sector, but the household saving ratio is expected to increase in coming years on the back of an increasingly tight labour market and a faster rise in wages. After a severe contraction in 2016, investment turned up again in 2017 and should strengthen going forward, supported by still very low real interest rates and a rebound in public investment as EU structural funds kick in again.
Poland’s exports of goods are diversified both in terms of composition and destination (Figure 7), and its export performance has continued to improve in recent years, as labour costs remain moderate and euro-area demand is strengthening. Exports of goods and services as a share of GDP have risen from 46.3% in 2013 to 52.3% in 2016. Growth in services exports has outstripped increases in goods exports since 2014 thanks to the rapid development of business and transport services, as Poland is positioning itself as a top destination for business process outsourcing and logistics (Figure 8). Job creation in those two sectors has been particularly strong. A large trade surplus has emerged since 2013, but a rising primary income deficit has offset some of the effect on the current account balance.
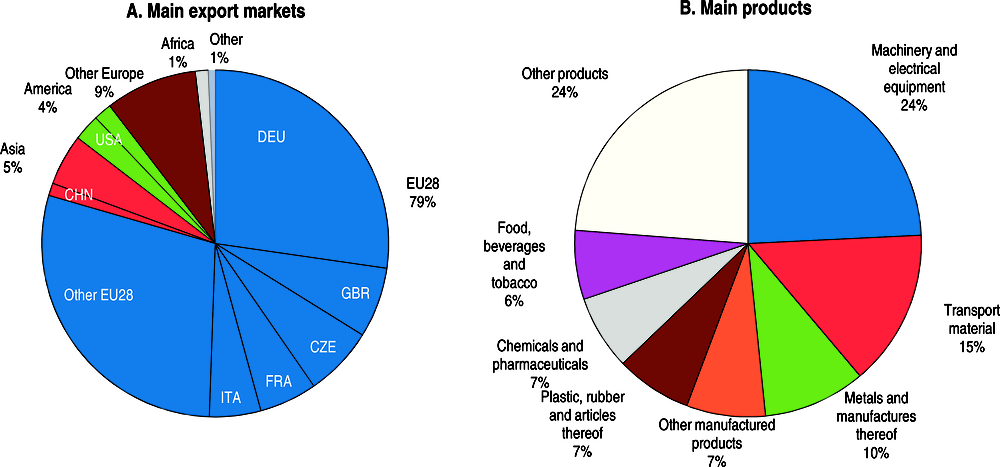
← 1. 12-month cumulated flows (values) as of June 2017.
Source: Eurostat (2017), Comext Database.
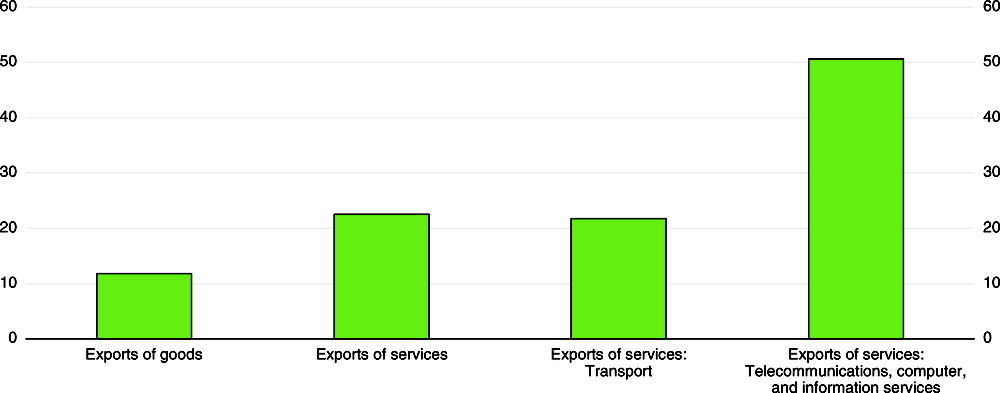
Source: Eurostat (2017), “Balance of Payments by Country (BPM6)”, Eurostat Database.
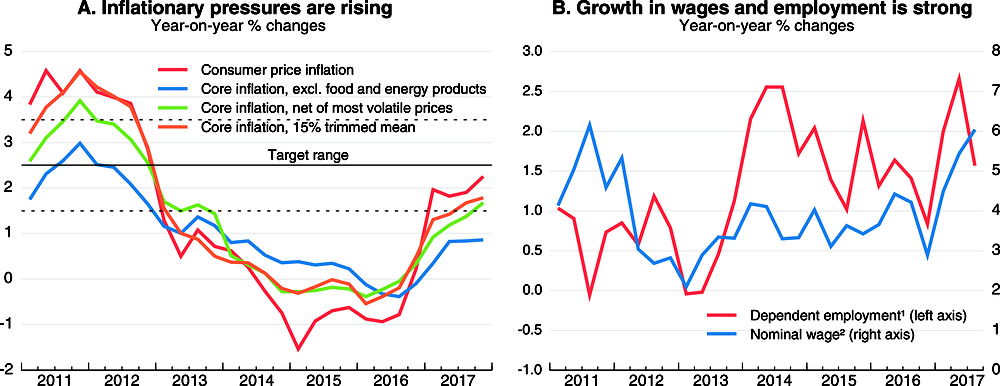
The labour market is tightening: the unemployment rate is at a 20-year low, and job vacancies have reached a record high level (Figure 9, Panel A). Business surveys indicate labour shortages as a key factor limiting production and firms’ growth (Panel B; Deloitte, 2017). Many Ukrainian workers have come to Poland (mostly on temporary jobs). They reached an estimated 5% of the Polish labour force in 2016, and their inflow continues to accelerate, providing a strong countervailing effect to the decline in the working-age population that started in 2011 (Figure 10). This is likely to be one of the key factors in holding down the increase in wages despite record low unemployment. However, wage pressures are set to strengthen going forward, reflecting labour market tightness. It is likely to get increasingly difficult to fill new vacancies with immigrants from Ukraine and other Eastern neighbours, as labour shortages are spreading to more and more sectors and the economic situation in Ukraine itself is improving. Moreover, the public sector could contribute to an acceleration in wages as the public-sector pay freeze currently in place is unlikely to be sustainable.
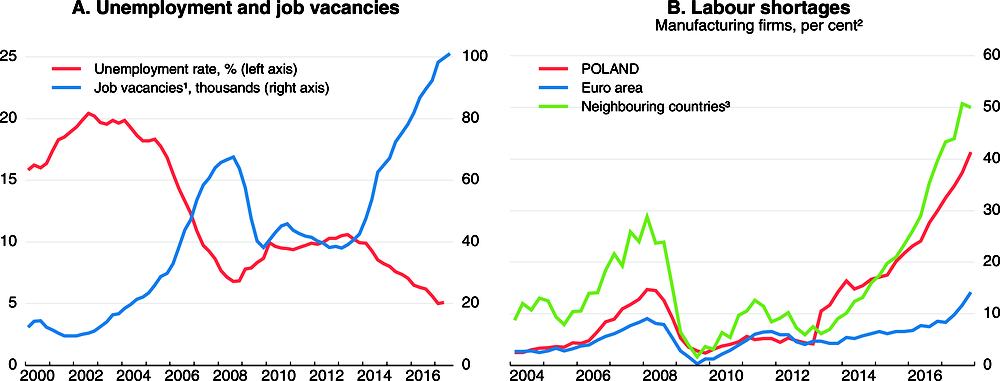
1. Four-quarter moving average.
2. Percentage of manufacturing firms pointing to labour shortages as a factor limiting production.
3. Unweighted average of Hungary and the Czech and Slovak Republics.
Source: OECD (2017), OECD Economic Outlook: Statistics and Projections (database); Statistics Poland; EIB (2017), “Investment Survey”, European Investment Bank, Luxembourg.
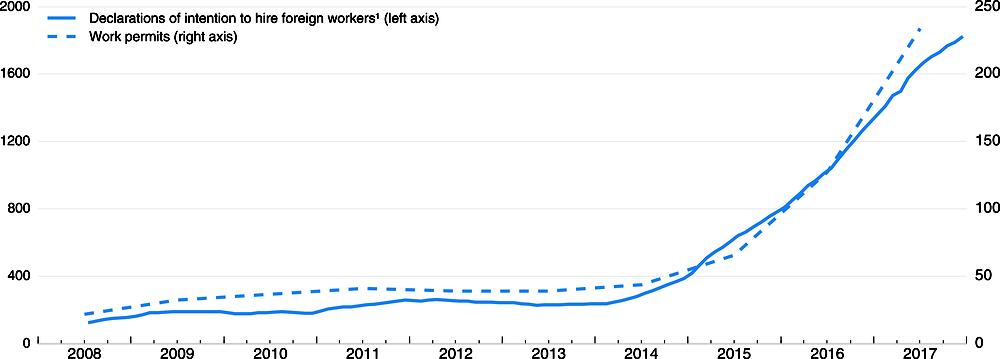
1. 12-month moving sum.
Source: Ministry of Family, Labour and Social Policies (www.mpips.gov.pl/analizy-i-raporty/cudzoziemcy-pracujacy-w-polsce-statystyki/).
Investment contracted sharply in 2016 with the switchover to the new budgetary period for EU structural funds. As in other countries benefitting importantly from such financing, the investment cycle is closely related to the timing of their disbursements, underlining the economy’s dependence on these funds. The share of firms that see uncertainty as a major investment obstacle is 10 percentage points higher than in the European Union on average (European Investment Bank, 2017), and regulatory instability in some sectors may be an important factor. Beyond that, reforms regarding the criteria for the appointment, tenure and dismissal of judges should be in line with international standards and abide by the rule of law. Investment started to recover in 2017, but the investment-to-GDP ratio is low relative to historical standards (Figure 11). Poland also ranks poorly in terms of the quality and environmental efficiency of its capital stock (Figure 12), suggesting additional investment needs. Investment is expected to strengthen, reflecting an increase in the absorption of EU funds.
1. Unweighted average of Hungary and the Czech and Slovak Republics.
Source: OECD (2017), OECD Economic Outlook: Statistics and Projections (database), and updates.
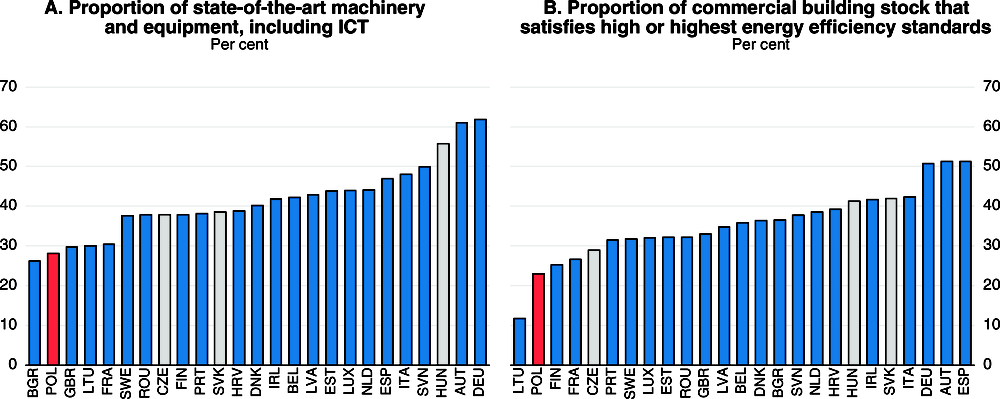
Source: EIB (2017), “Investment Survey”, European Investment Bank, Luxembourg.
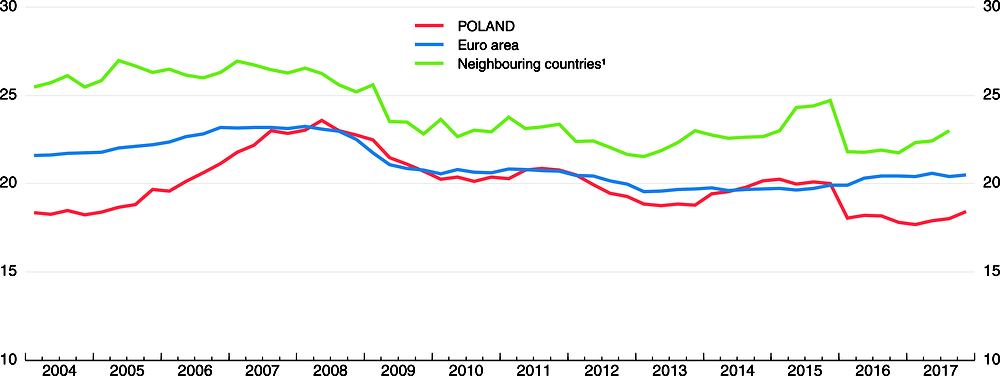
After a bout of deflation from mid-2014 to late-2016, consumer price inflation has returned, driven mainly by increases in energy and food prices. With inflation running below target for about five years the central bank has appropriately kept its main policy rate at a record low of 1.5% since March 2015 (Figure 13, Panel A). Inflation excluding food and energy prices has increased since early 2017, but remains low. Yet, alternative measures of core inflation used by the National Bank of Poland (NBP) have risen faster, and further increases are expected in line with accelerating wage growth (Panel B), as the labour market is tightening (Figure 9). However, pass-through from a tighter labour market to prices seems to have weakened compared to historical standards in Poland as in other countries. This seems to be confirmed by the level of firms’ and consumers’ inflation expectations that remain relatively low notwithstanding increases at the end of 2016 (Figure 14). If the economic assessment suggests that there is considerable upward risk for price stability, the NBP should raise interest rates in a timely fashion to ensure that inflation remains well within its target range (2.5+/- 1%).
1. Employment in total economy, excluding the self-employed.
2. Average nominal gross wage and salary in the enterprise sector; economic entities employing at least 10 persons.
Source: Narodowy Bank Polski; OECD (2017), OECD Economic Outlook: Statistics and Projections (database); Statistics Poland.
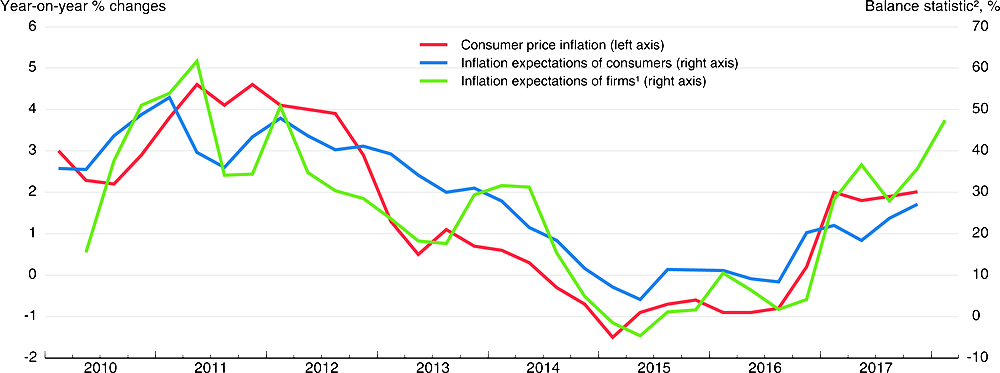
1. As business inflation expectations are found to be more strongly (positively) correlated with price developments 3 months in the future, the displayed series is shifted forward by one quarter.
2. Based on the percentage of respondents declaring that, in the next 12 months, prices will rise faster than currently.
Source: Narodowy Bank Polski; Statistics Poland.
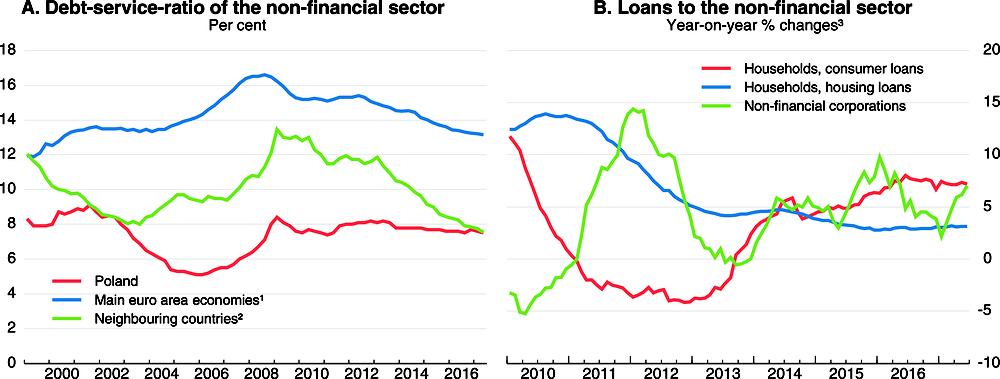
Based on publicly available data the financial sector appears robust. The debt-service ratio of the non-financial corporate sector, which measures the amount of income used for interest payments and amortisation, is low in international comparison (Figure 15, Panel A). The fact that non-financial corporate sector debt has increased over time relative to GDP, albeit from a low level, explains that Figure 16 signals increased non-financial sector vulnerability. The banking sector’s average core Tier 1 capital ratio stood at 17.2% at end‐September 2017, much higher than Basel III requirements. Bank lending has remained resilient, as economic activity is gathering pace (Panel B), although bank profitability has declined since 2015, notably because of a new tax on bank assets and other external burdens (Figure 16, Panel B). Low interest rates are putting pressures on the net interest margin, although this ratio has recovered since 2015. While the economic risks associated with the portfolio of foreign-currency-denominated mortgage loans appear limited and not of a systemic nature (National Bank of Poland, 2016a), the details of a law to facilitate the voluntary restructuring of such loans (to limit borrowers’ future exchange rate risks) through bilateral negotiations between banks and their clients, have yet to be fully decided, creating uncertainty. Discussions over this matter, including the regulatory package recommended by the macro-prudential authority (the Financial Stability Committee) in early 2017, have been ongoing for over two years and need to be quickly drawn to a close. Household debt is relatively low at 36.3% of GDP in spring 2017, compared with 58.1% of GDP in the euro area, and home prices are roughly stable and low relative to incomes, as demand and supply remain in balance despite a high level of transactions. The risk of excessive demand is contained by macro-prudential regulation, such as the maximum loan-to-value ratio of 80%, and, in the medium term, by ageing. The level of government debt relative to GDP is rather moderate, as are real stock prices.
1. Unweighted average of Germany, France, Italy and Spain.
2. Unweighted average of Hungary and the Czech and Slovak Republics.
3. Adjusted for exchange rate changes.
Source: BIS (2018), Debt Service Ratios for the Private Non-financial Sector (database), Bank for International Settlements, www.bis.org/statistics/dsr.htm; Narodowy Bank Polski, Monetary and Financial Statistics (database).
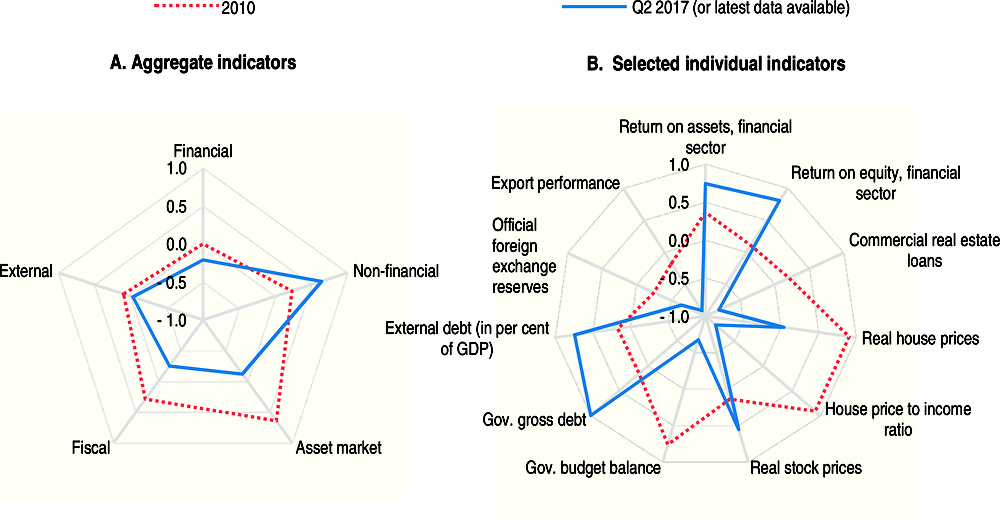
← 1. For each aggregate macro-financial dimension, displayed in Panel A, the vulnerability index is based on a simple average of all indicators from the OECD Resilience Database that are grouped under that dimension’s heading. Indicator values are normalised to take values between – 1 and 1. They are positive when the last observation of the underlying time series is above its long-term average, indicating more vulnerability, and negative when the last observation is below its long-term average, indicating less vulnerability. Long-term averages are full-sample estimates calculated since 2000.
Source: Calculations based on OECD (2017), OECD Resilience Indicators (database), November.
The projection is subject to various risks. Stronger-than-projected growth in the euro area, Poland’s main export market, would boost exports and the current account balance. Labour shortages and skills mismatches could become more widespread, which would weaken productivity growth and economic activity. Inflation could be stronger than expected, as wage pressures could accelerate more than projected on the back of a strong labour market and a risk of lower labour force participation resulting from recent policy measures. If policy uncertainty were to intensify or the disbursement of EU funds were to accelerate less than expected, investment and GDP growth could be weaker. Additional shocks that are difficult to quantify are reported in Table 2.
Financing higher social spending and public investment in skills and research
Public spending is increasing, reflecting rising social transfers. The lowering of the minimum retirement age implemented in October 2017 and the 500+ child benefit programme introduced in April 2016 are expected to cost about 1.5-2% of GDP annually. The new child benefits will double public support for families to ca. 3% of GDP (Figure 17). Stronger public investment related to projects financed in cooperation with the European Union will also contribute to a rise in public spending. As a result, the fiscal policy stance will be expansionary in 2018, as reflected in the deterioration of the underlying primary balance. However, the headline deficit should remain well below 3% of GDP thanks to buoyant tax revenues resulting from strong, consumption-led growth and improved tax collection in addition to the constraining impact of the government’s expenditure rule, which applies to 90% of general government spending. Given the strength of the economy implementing a tighter fiscal stance through revenue-raising tax reforms or through still greater spending prioritisation would be appropriate.
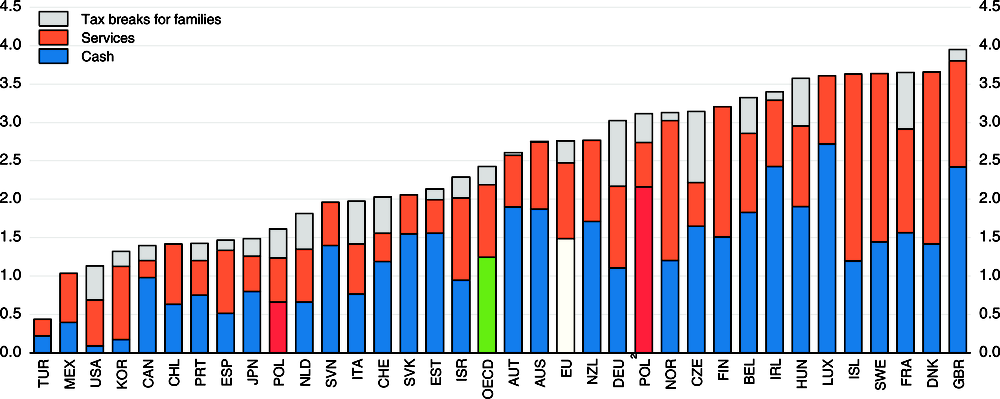
← 1. Or latest available year.
2. Poland’s public spending on family benefits of 2013, augmented with the costs of the family 500+ child benefits introduced in 2016. Other changes between 2014 and 2016 are not taken into account for lack of data, so that it seems safe to consider that family support is now above the OECD average, although there are no data for 2016.
Source: OECD (2017), OECD Family Statistics (database).
There are a number of reasons to expect further pressure on public spending in the longer run. As incomes rise, so do public demands for better social protection and public services, as evidenced by the recent doctors’ protest against low pay and poor working conditions. Poland’s public health spending is among the lowest in the OECD. High out-of-pocket spending, an estimated 9% of the population without insurance and a shortage of health professionals, contributes to inequality in access to health care. A third of the population reports skipping medical consultations as a result of high costs, the largest share in the OECD. The government plans to increase public health-care spending to 6.0% of GDP in 2025 from 4.5% in 2015. It will be important to ensure that this serves to reduce out-of-pocket payments to improve access to health care. Better strategic planning of health-care workforce training and improvement in working conditions in the sector are also needed to address labour supply constraints (Domagała and Klich, 2018). To strengthen Poland’s capacity to innovate the government also intends to increase R&D spending to 1.7% of GDP by 2020, notably through more generous R&D tax incentives (see Box 2). Given the large share of public investment and innovation support financed via EU funds, continuity of investment incentives for the private sector might require a substantial increase in government spending after 2022, when the availability of EU Funds might diminish considerably. The debt sustainability analysis in Box 3 illustrates that further revenue-raising measures or spending prioritisation would be needed for the public finances to remain in line with the government’s fiscal framework and avoid a rapid rise in public debt. Besides preventing unfinancedspending increases, the fiscal framework requires that spending be reduced if the public debt-to-GDP thresholds – 43% and 48% – are exceeded or if the nominal general government deficit exceeds 3% of GDP. And public debt must be kept below 60% of GDP according to the constitution.
In a baseline scenario of a primary deficit stable at 0.5% of GDP, the debt-to-GDP ratio is roughly constant (Figure 18). However, should the primary deficit rise to 2.0% of GDP in 2020 and stabilise at this level thereafter due to unfinanced increases in spending and nominal growth be 0.5 percentage points weaker, public debt would be on an upward trajectory. In contrast, stronger nominal growth resulting from some of the growth-enhancing reforms advocated in this Survey (Table 3) and stronger revenues leading to a primary balance surplus of 0.25% of GDP from 2020 onwards would put public debt on a declining path, and the debt-to-GDP ratio would reach about 43% of GDP in 2030. Table 4 illustrates that with current government plans some of its planned spending increases would be unfinanced (green scenario). It also summarises tax and spending reform options that could help the government reach the blue-line scenario instead, if combined with structural reforms. It should be noted that the effects of structural reforms on growth in Table 3 are a lower-bound estimate of the benefits from structural reforms advocated in this Survey, since additional measures such as an increase in funding for public universities and research output as well as the implementation of a national basic skills strategy and more workplace-based vocational education and adult training are not quantified in Table 3.
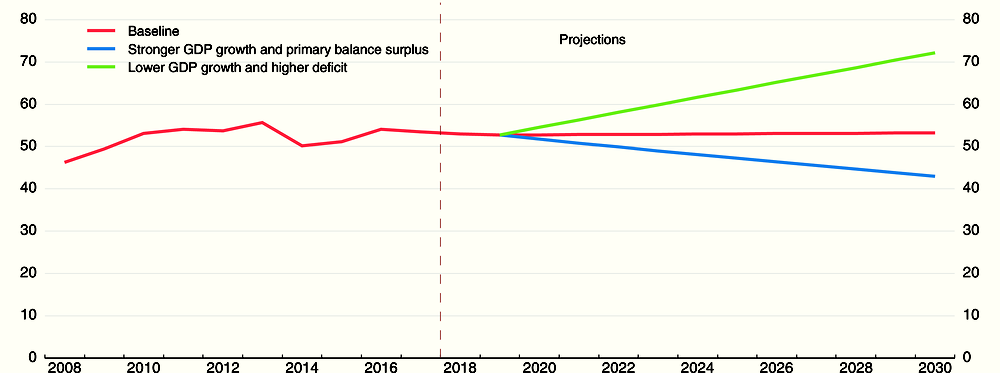
← 1. The baseline corresponds to the projections from Table 1 until 2019. Thereafter assumptions are: nominal GDP growth of 5.4% in line with the OECD estimate of potential growth of 2.9% and a GDP deflator of 2.5%, effective interest rate of 4.5% and a primary balance deficit stable at 0.5% of GDP. The stronger GDP growth and primary balance surplus scenario assumes nominal growth to be 0.5 percentage points stronger than in our baseline and a primary balance surplus of 0.25% of GDP from 2020 onwards. In the lower GDP growth and higher deficit scenario, nominal GDP growth is 0.5 percentage points weaker than in our baseline and the primary balance deficit is at 2.0% of GDP from 2020 onwards.
Source: OECD (2017), OECD Economic Outlook: Statistics and Projections (database) and updates; OECD staff calculations.
The government plans to finance higher spending mainly by reducing tax fraud. Indeed, efforts to improve VAT compliance seem to have been very successful so far, as the losses due to tax evasion may have been reduced by about 25% in 2017. While they are still substantial (at about 2% of GDP (PwC, 2017)), this progress is impressive. A coherent policy package has helped achieve this (Box 4). The government expects further improvements in the years to come. Based on historical examples of neighbouring countries that have improved their VAT compliance, the expected revenue gains seem optimistic (IMF, 2017a). It is unlikely that the government will be able to finance the new child benefits and higher healthcare spending with improved tax compliance alone (Table 4, Panel A), not least because some of the improvements may be temporary, as compliance has been shown to be cyclical (Cabrillac and Pappadà, 2017).
A set of policy measures have helped Poland achieve important progress in tax compliance.
-
The creation of the National Revenue Administration (Krajowa Administracja Skarbowa, KAS) in March 2017, merging tax administration, customs and fiscal control operations. A centralised data warehouse was set up with improved data modelling tools to detect and predict irregularities.
-
Large firms have had to provide VAT data on a monthly basis in a unified format (the Standard Audit File for Tax) since July 2016 and SMEs since January 2017, facilitating audit checks. From January 2018, nearly all firms will have to submit such files.
-
A package of measures was introduced to tackle VAT fraud, notably carousel fraud related to intra-EU liquid fuel trade.
-
On 13 January 2018 a new law entered into force that will enable the tax authorities to better control the risk of tax fraud, in particular VAT, through the banking system. In certain cases, the authorities may request a temporary bank account freeze. The purpose of this act is to implement an ICT system (STIR) facilitating bank data transmission and algorithmic (big data) analysis for tax administration purposes.
-
A split VAT payment mechanism whereby all taxable entities registered for VAT purposes will be legally required to have a separate VAT account linked to their standard bank accounts is to be enforced from July 2018. VAT related transactions covered by the split payment mechanism are to be made exclusively via this account facilitating monitoring by tax authorities.
-
Sanctions against VAT fraud have been strengthened.
-
A general anti-avoidance rule was introduced for the corporate income tax.
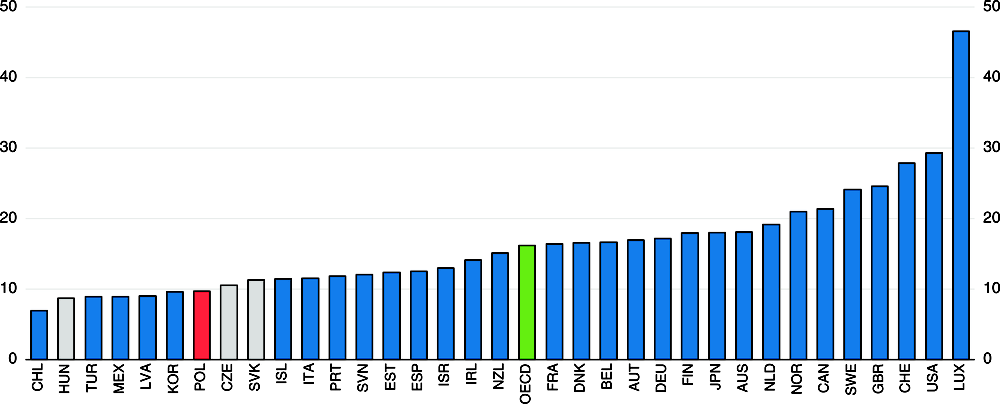
Tax revenues are below the OECD average (Figure 19, Panel A), and the contribution of the progressive personal income tax to overall revenues is low in international comparison. As a result, the tax system is not very progressive and does little to lower inequality (Panel B). Tax reform could help to increase revenues and improve the system’s impact on the environment and inequality.
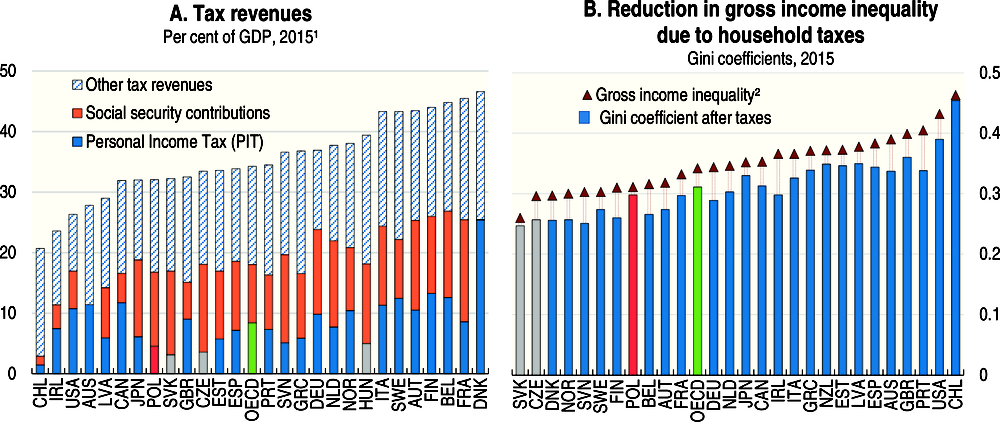
1. Or latest year available.
2. After social transfers.
Source: OECD (2017), OECD Tax Revenues Statistics and OECD Income Distribution and Poverty Statistics (databases).
Reduced VAT rates and exemptions lower revenues by up to 2.5% of GDP (Ministry of Finance, 2016). Limiting the reliance on reduced rates would allow for lowering statutory rates to some extent, while still increasing tax revenues. Social policy targets are more efficiently reached through the personal income tax (PIT) system or targeted social transfers, which are currently low in Poland, than through reduced VAT rates. These also benefit higher-income households, sometimes disproportionately, for example in the case of the reduced VAT rate on hotels and restaurants.
Giving a stronger role to the personal income tax would imply a more progressive tax system and help raise revenues. Poland has only two tax brackets, and the top rate of 32% has a relatively high threshold in that only 3% of taxpayers are subject to this rate (Ministry of Finance, 2017). The self-employed can choose to be taxed at a 19% flat rate. Top marginal tax rates including social contributions are towards the lower end among OECD countries (OECD Tax Database). Evidence suggests that increasing income tax progressivity from moderate levels can reduce inequality substantially without a negative impact on economic growth (IMF, 2017b). There would be room to introduce a new tax bracket for medium-to-higher incomes, which could be between the lower 18% and the upper 32% rate, and lower the threshold for the top rate. Since 18% is relatively high, introducing a lower bottom statutory rate for the lowest incomes should also be considered. The self-employed should also be subject to progressive income taxes to ensure horizontal and vertical equity and limit possibilities for tax avoidance. Capital income is subject to a flat rate of 19%, which is among the lowest rates in the OECD (OECD, 2017a). Increasing the capital income tax rate at the individual level would raise the progressivity of the overall tax system, since capital income is more unevenly distributed than labour income. Higher property taxes, which contribute relatively little to overall revenues, would be a complement to such a reform (Table 5). The 2017 increase in the tax-free allowance for low-earning households helped to raising the system’s overall progressivity and is welcome.
In January 2017 the government introduced a reduced corporate income tax rate of 15% for firms with revenues below 1.2 million euros, while the standard statutory rate of 19% is among the lowest in the OECD (OECD, 2017a). Roughly half of OECD countries have reduced rates for small businesses (OECD, 2015a), but this creates incentives to under-report revenues, complicating tax enforcement. It can also be a barrier to firm growth (IMF, 2017c). If such effects materialise, the reduced rate should be reconsidered. The government is in the process of closing corporate income tax loopholes, e.g. by tightening criteria to claim deductions available to foreign-controlled companies. Limiting the deductibility of interest from the corporate tax base in line with the OECD Base Erosion and Profit Shifting (BEPS) project (OECD, 2015b) would lead to a less distortive financing structure for the economy while broadening the tax base.
Another way to raise revenues, provide stronger incentives to invest in green infrastructure and promote well-being would be to increase environmental taxes. While such revenues are close to the OECD-country median (Figure 20, Panel E), this is mainly attributable to high fuel intensity due to a large and heavily polluting car fleet. Tax rates on air and water pollution and on CO2 emissions are low, and many environmentally harmful fuel uses are exempt from taxation. Bringing taxes more into line with environmental externalities could help raise substantial revenues (OECD, 2016a), provide stronger incentives to replace ageing and highly coal-intensive infrastructure and heating equipment in homes with greener alternatives and promote environmental innovation, which remains low (Panel F).
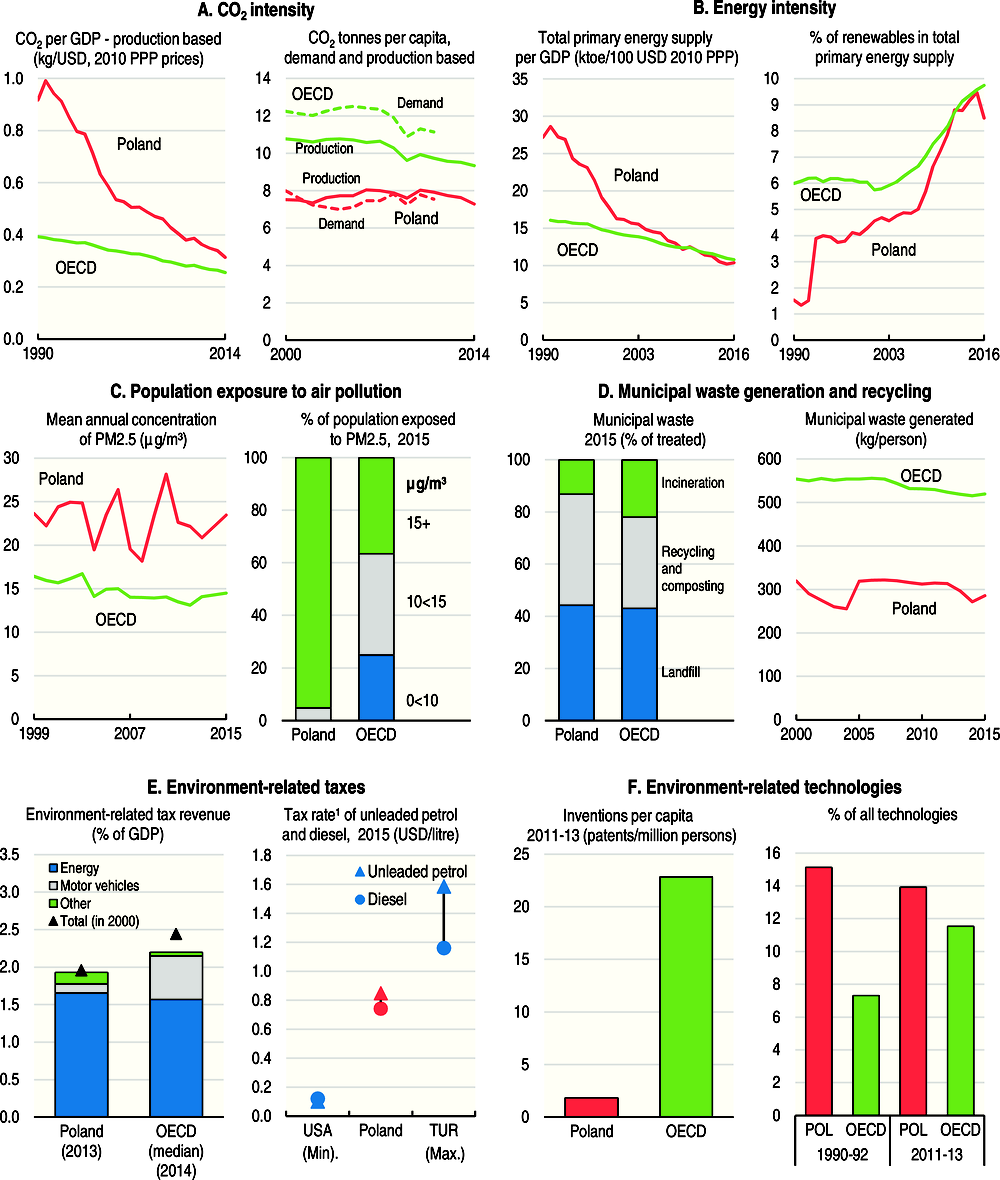
1. Excise taxes, excluding all VAT or VAT-equivalent components levied on energy consumption.
Source: OECD (2017), Green Growth Indicators (database). For detailed metadata: http://stats.oecd.org/wbos/fileview2.aspx?IDFile=7ad102dd-e16d-4da0-a20c-624582b9984e.
The proposed tax reforms give the government a choice of options to finance its spending plans and prepare for a possible drop in available EU funds. The options would also make room in the longer term to increase spending on higher education and research, as well as childcare and long-term care, as recommended elsewhere in this Survey. This is quantified in an illustrative manner in Panel B of Table 4.
Making investment greener and improving its impact on innovation and productivity
Thanks to abundant availability of EU structural funds Poland has invested substantially in transport and digital infrastructure. Yet, improving the quality of investment would strengthen its impact on innovation, environmental efficiency and economic development (OECD, 2016a). Local governments are responsible for a large share of infrastructure investments but lack management capacity and sometimes incentives to oversee large infrastructure projects and develop local zoning plans and energy-efficiency strategies. They would benefit from the central government’s technical assistance (Table 5), which would also help lagging regions catch up.
Better public procurement procedures would also help raise the quality of public investment. Despite some improvements in recent years, Poland is one of the EU countries with the largest numbers of procurement contracts attributed to single bidders (European Commission, 2017b). Moreover, the environmental-efficiency and innovation impact of public infrastructure investment is hindered by the reluctance of local authorities to award contracts based on non-price criteria, even though there has been some progress since a change in the public procurement law required consideration of other criteria as well (OECD, 2017b). E-procurement will be mandatory as of 2018, and developing integrated electronic procurement processes for all levels of government would improve market transparency and boost competition. A reform of procurement law and public purchasing policies is under preparation. Its purpose is to enhance competition in public procurement and increase the use of green and innovation-related criteria. Facilitating data collection at the central level to conduct impact analyses would help in the design of a strategy to further boost competition and innovation in public procurement. Finally, in line with Poland’s plan to increase tax compliance and fight corruption, joining the newly set-up European Public Prosecutor’s Office, as most other EU countries have done, could help combat cross-border tax fraud and the misuse of EU structural funds.
Continuing progress in improving digital infrastructure, notably by ensuring a swift absorption of EU funds earmarked for developing ICTs, would help boost innovative investment and foster public sector efficiency. The digital infrastructure has improved fast, but the share of households with broadband access remains low, and Poland lags in terms of firms’ usage of cloud computing services (Figure 21) and big data analysis (OECD, 2017c). This hinders innovative investments and the ability of enterprises to manufacture new products and adopt new production processes. Strengthening e-government appropriately features high on the government’s digital strategy, as OECD data confirm that there is room to catch up to other OECD countries in terms of moving administrative procedures online. In that respect, establishing a Digitalisation Council as Norway has done to advise government agencies engaged in ICT projects could be helpful.
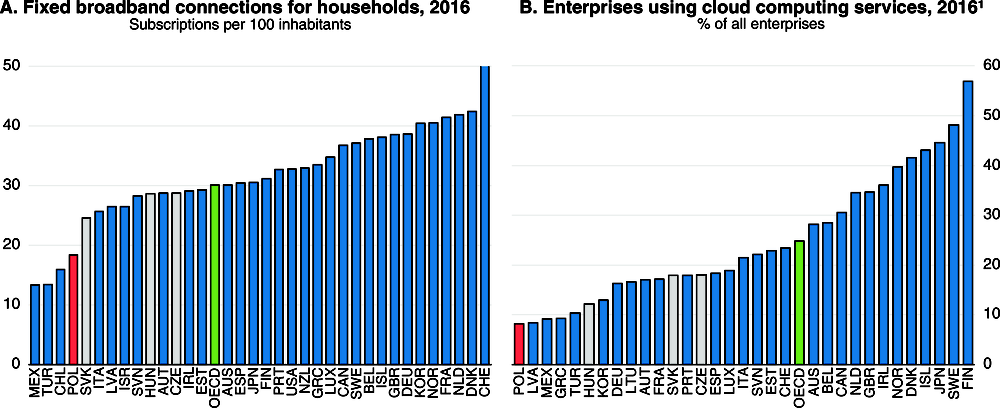
1. Cloud computing refers to ICT services used over the Internet as a set of computing resources to access software, computing power, storage capacity and so on.
Source: OECD (2017), OECD Broadband Portal (www.oecd.org/sti/broadband/broadband-statistics/) and OECD Digital Economy Outlook 2017, OECD Publishing, Paris.
Regulatory instability has hampered the development of renewable energy and other technologies that would improve air quality. While Poland has reduced its greenhouse gas (GHG) emissions and the energy intensity of its economy, the use of low-quality coal for Poland’s often inefficient household heating and electricity generation is more prevalent than in other European countries, contributing to high CO2 emissions and air pollution (Figure 20). A majority of the population is exposed to dangerous levels of particulate matter (Panel C), explaining the high risk of respiratory disease and premature death mentioned above. Renewable energy generation had grown rapidly until 2015, but over 80% consists of biomass, whose burning has worse effects on air pollution than the gas it replaced. The transition of renewables support from green certificates to auctions took several years, and there is still substantial uncertainty (Table 5). Many plants burning biomass and fossil fuels had to be closed down, and the renewables share dropped substantially in 2016 as the decline in the price of green certificates made their production unprofitable. While this is good news in terms of air pollution, conditions for investments in environmentally friendlier renewable energy sources suffer from additional barriers. A 2016 law created prohibitive conditions for new onshore wind parks and high costs and uncertainty for existing ones (European Commission, 2017a). Strengthening electricity transmission, distribution and interconnection capacity, which remains low, and ensuring easier access to the grid by streamlining administrative procedures would promote renewables development and improve energy security.Improvements in energy efficiency in homes and in combustion efficiency in boilers will help to enhance air quality and reduce energy bills. Higher environmental taxes are a crucial complement to ensure the effectiveness of programmes promoting technology replacement, including for inefficient heating boilers, and promote green innovation, as illustrated by the Swedish experience with a NOx charge (OECD, 2010a).
Labour market developments
Unemployment has fallen, but further progress in strengthening seniors’ employment is at risk
Unemployment has been falling fast as a result of rising employment but also a shrinking labour force. Starting from a low level, employment rates of workers over 55 have risen particularly quickly, accounting for half the increase in the total employment rate between 2006 and 2015 (Lewandowski, 2017). Statistical analysis shows that the 2009 and 2013 pension reforms limiting early retirement and gradually increasing the statutory pension age to 67 played key roles, as participation for cohorts affected by the reforms rose substantially compared to those who were not. Unemployment for older workers fell in line with that of other age groups. The recent reversal of the 2013 reform responded to widespread popular demand. At the same time, it could compromise the progress concerning seniors’ employment. Benefit replacement rates will be among the lowest in the OECD for workers now entering the labour market if they retire at the new statutory age (Table 6), particularly for women whose retirement age will remain unusually low compared to other OECD countries. Their average age at labour market exit today is among the lowest in the OECD (Figure 22).
← 1. The average effective age of retirement is calculated as a weighted average of (net) withdrawals from the labour market at different ages over a 5-year period for workers initially aged 40 and over. In order to abstract from compositional effects in the age structure of the population, labour force withdrawals are estimated based on changes in labour force participation rates rather than labour force levels. These changes are calculated for each (synthetic) cohort divided into 5-year age groups.
Source: OECD (2017), OECD Pensions at a Glance, OECD Publishing, Paris; estimates derived from the European and national labour force surveys (http://oe.cd/pag).
Although legally there is nothing that prevents workers from working beyond the statutory retirement age, the pension reform is likely to have an impact on employment rates for older workers. Studies show that the statutory pension age is a powerful focal point that tends to have a strong effect on retirement decisions beyond any financial incentive effects (Seibold, 2016; Cribb et al., 2016). In fact, almost all workers newly eligible because of the recent change seem to have applied for pension benefits so far. The impact on employment remains unclear, though, as some applicants may remain in the labour market. Furthermore, only 40% of the current cohort newly eligible for pensions was employed. Still, if retiring at the earliest possible date were to become a trend, it could entail heightened poverty risks according to simulations based on an overlapping-generations model, substantially increasing the share of pensioners who have no more than a minimum pension (Figure 23; Tyrowicz and Brandt, 2017). Fiscal costs due to a higher share of minimum pensioners could increase by up to 0.9% of GDP annually on average until 2030. Aligning the statutory pension age for women with that of men at 65 would alleviate the increase in old-age poverty among women and reduce additional fiscal costs from 0.9% to 0.3% of GDP. The model does not take into account that women often have patchy career paths related to motherhood, implying that estimates represent a lower bound.
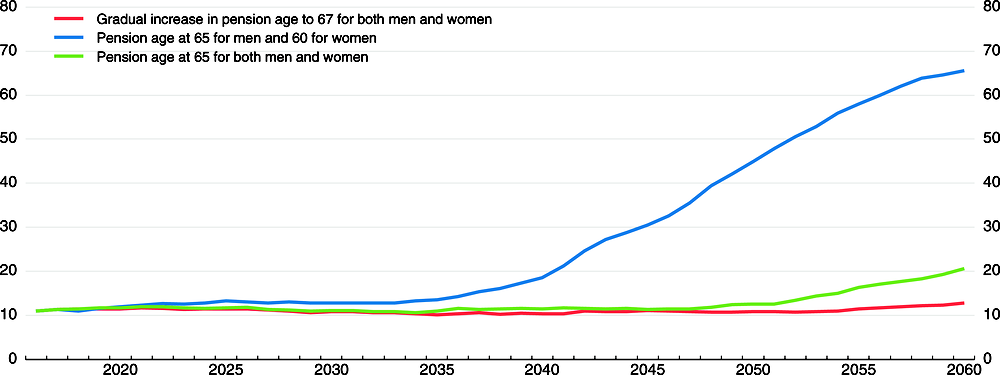
Source: J. Tyrowicz and N. Brandt (2017), “Simulating the effects of pension reforms in Poland in an overlapping generations model”, Technical Background Paper, OECD, Paris.
Providing workers with better information about their pension situation could still induce them to delay their retirement. There is ample evidence that workers everywhere have a poor understanding of the basic features of pension systems and the influence of the age at which they retire on their pension income (OECD, 2016b). The government has started to send out more detailed and clearer annual information to workers about their entitlements. It will be important to ensure that this information is easy to grasp, even though conveying the uncertainty about future benefits in a notional defined contribution system without causing confusion is notoriously difficult (Antolín and Harrison, 2012). The recently provided personalised pension information included simple examples comparing pension benefits when retiring at the new statutory age and 5-10 years later. It should also include the evolution of benefits over the beneficiary’s expected lifetime, and minimum pensioners should be informed how much longer they need to work to lift their pension income sizeably above this level. A study is also needed on whether Polish workers actually read and understand the information they receive, as experience from Chile suggests that this is rarely the case. Furthermore, the government should continue to conduct regular nation-wide awareness campaigns, such as in Chile, the United Kingdom and the Netherlands, to provide simple pension calculators, such as in Canada, France and Chile, and introduce seminars, targeting groups that are likely to have low financial literacy. Employer-based seminars have been shown to be particularly effective, for example in the United States, as individuals seem to follow the advice or behaviour of colleagues, friends and neighbours (OECD, 2016b; Duflo and Saez, 2003). In 2017 Social Insurance Institution advisors offered individual pension advice to 1.1 million citizens.
The government plans to set up occupational pension plans in a more systematic way to ensure that workers have additional retirement income. The private pension pillar was substantially transformed in 2014 when authorities transferred almost half of open pension funds (OFEs) assets to the public pension agency (ZUS), registering them in individual pension accounts (see OECD (2014) for more details). Currently there is a discussion about transferring a further 25% of remaining OFE assets to the demographic reserve fund and transforming the rest into mutual funds. Furthermore, a draft law creates Employee Capital Plans (PPK) with contributions from employers and employees and incentives from the government. It is a voluntary scheme in that employees will be able to opt out. Developing such a pillar will require building trust in more regulatory stability than in the past – as changes to OFEs have been frequent and sweeping – and effective financial education campaigns. Soft compulsion, such as automatic enrolment and default minimum contribution levels envisaged by the government, has proven to work well in a number of countries such as Chile, Australia, the United Kingdom and the United States, as many people seem to opt for the path of least resistance (OECD, 2016b; Choi et al., 2002).
Efforts to strengthen job-search assistance and training programmes for older workers will also be needed. Other measures to facilitate longer working lives include: i) aligning the rules of special pension schemes with the general system, which are substantially more generous for farmers and miners in particular, but also for some other professions; ii) harmonising employment protection for all age groups to avoid disincentives to hiring older workers, who are currently better protected; and iii) providing government support to spreading good practices in terms of managing senior workers, in particular for SMEs (OECD, 2015c).
Strengthening female employment
The new family benefit has reduced poverty and might raise fertility. Before this, social spending was low with a limited impact on poverty. The 500+ benefit increases family benefits per beneficiary almost five-fold, while more than doubling the number of beneficiaries. Extreme poverty fell by 1.4 percentage points in 2016 compared to 1 percentage point in 2015. Extreme poverty among children fell by more than 3 percentage points (Statistics Poland, 2017a and b), and further progress is likely to have taken place in 2017, as benefit disbursement started only in the summer of 2016. Some research finds that generous family benefits can also have a positive impact on fertility, although estimated effects differ widely and are low in some studies (Laroque and Salanié, 2014; Luci-Greulich and Thévenon, 2013; Riphahn and Wiynck, 2016).
But there are also risks. Evidence from other countries suggests that there can be negative effects of child benefits on female labour supply, which are greater for low-educated mothers (Schirle, 2015; Haan and Wrohlich, 2011). The participation rate among lower-skilled Polish women had started to fall already in 2013, when paid maternity and parental leave were significantly extended, and continued to do so after the introduction of the new child benefit in 2016 (Figure 24, Panel A). The participation rate of partnered women with one or two children fell significantly after the introduction of child benefits while it continued to increase among childless women (Panel B). Estimates suggest that the participation rate among partnered women with children was lowered by close to 3 percentage points in the first half of 2017 as a result of the reform (Magda et al., 2017). A microsimulation model likewise suggests that employment among mothers would fall in the longer term, with a particularly strong impact in villages and small towns; however, the calibration of the model is based on somewhat dated data (Myck, 2017). Combined with the lowering of the retirement age, patchier careers could reinforce old-age poverty risks for low-qualified women.
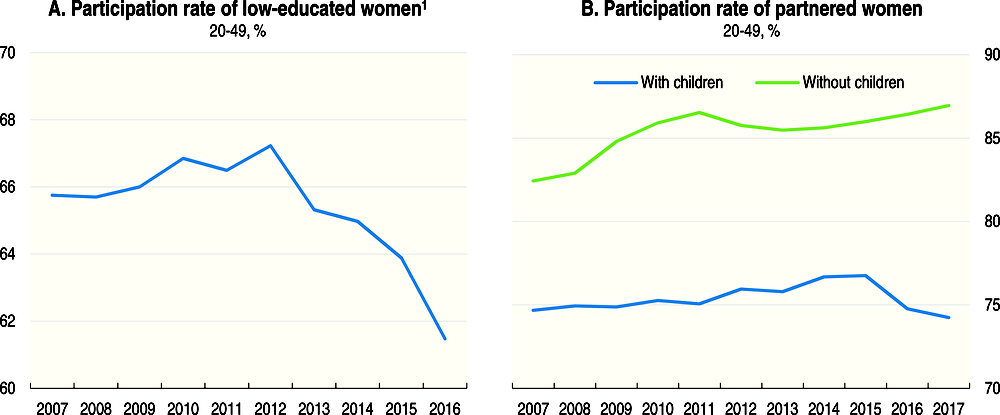
1. With at most lower secondary or basic vocational education.
Source: I. Magda, A. Kielczewska and N. Brandt (2017), “The impact of large child benefits on female labour supply – the case of Poland’s 500+ programme”, Technical Background Paper, OECD, Paris.
The OECD tax-benefit model confirms that parents who take up a job that would lift family income just above the eligibility ceiling for the first child can be financially worse off. An unemployed single mother of two taking up a job that pays the average wage would retain less than 20% of her earnings as a result of taxes and benefit withdrawal. Once taking childcare costs into account, which can be very high in the private sector – often the only available option, she would actually lose money. The government would need to subsidise at least 50% of these costs before it starts to pay for her to take up such a job. Some Polish cities, such as Szczecin, have started to experiment with childcare vouchers. Another solution to alleviate the negative work incentives would be to taper the benefit withdrawal for the first child. Alternatively, it could be withdrawn gradually for all children but with a much higher income ceiling.
Further developing high-quality childcare services will be vital to promote female employment and make it easier for people to have as many children as they want. More than 45% of inactive prime-age women cite care responsibilities as a reason for not participating in the labour market according to Labour Force Survey data. Studies for other countries show that the availability of subsidised childcare has a positive effect on female employment (Nollenberger and Rodríquez-Planas, 2015; Givord and Marbot, 2015). As an example, the fertility rate in Germany has started to rise from a low level, and research suggests that massive investment in childcare is a factor behind this (Haan and Wrohlich, 2011). Access to childcare services is improving and is quite good for 3-5 year olds – since 2014 the coverage for that age group has further increased to 84.8% – thanks to support from EU funds and government subsidies. Yet, it remains insufficient, in particular for the youngest children in rural areas and for women without tertiary education (Figure 25, Panel A). This is where the greatest efforts to extend coverage are needed, complemented with strengthened job-search assistance and training measures for women.
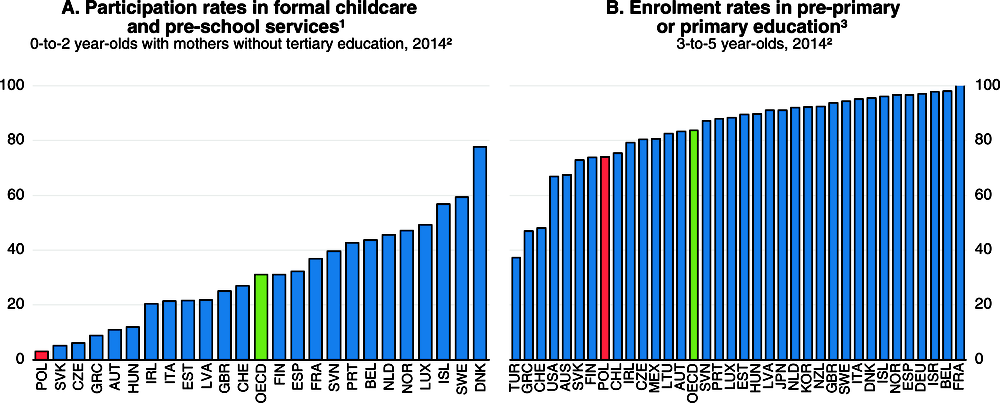
1. Data refer to children using centre-based services (e.g. nurseries or daycare centres and pre-schools, both public and private), organised family daycare, and care services provided by paid professional childminders, excluding those using unpaid informal services provided by relatives, friends or neighbours.
2. Or latest available year.
3. Potential mismatches between the enrolment data and the coverage of the population data (geographic coverage and/or the reference data used) may lead to overestimated or underestimated enrolment rates.
Source: OECD (2017), OECD Family Statistics (database).
Children of lower-educated parents would benefit particularly strongly from high-quality early childhood education, as it has been shown to yield considerable benefits for cognitive skills (Felfe et al., 2015). The decision to lift mandatory entry to primary school to seven and abandon mandatory pre-school education for five-year olds, has led to a temporary drop in participation among 3-5 year olds (see also Table 7). Stepping up the expansion of available pre-school and childcare places and reaching out to parents who may be unaware of the benefits of early childhood education and care could improve the education results of children from disadvantaged backgrounds throughout their lives and prevent insufficient availability of early childhood education and care from constituting a barrier to female activity. Plans to increase financing for early childhood education are welcome. Developing long-term-care facilities for the elderly will also be crucial to allow parents to better reconcile work and family obligations and ensure access to care. Currently long-term care is provided predominantly by family members with very little institutional support. Formal care provision is very scarce, reaching less than 5% of the dependent population, and public funding is low (Figure 26). There are few opportunities to work part time in Poland. Hence, campaigns to inform recruiters about the advantages of part-time work and ways to manage this could be useful. Illustrative OECD simulations suggest that increasing spending on childcare and long-term care services by 2% of GDP by 2030, bringing it near to the OECD average, combined with an increase in the pension age to 65 for both men and women, could increase GDP quite substantially (Table 3 above) through higher employment. The child tax credit and means-tested family benefits that have been maintained after the introduction of the new child benefits could be transformed into childcare service support to make such a reform more feasible from a fiscal standpoint and reduce the complexity of support for families.
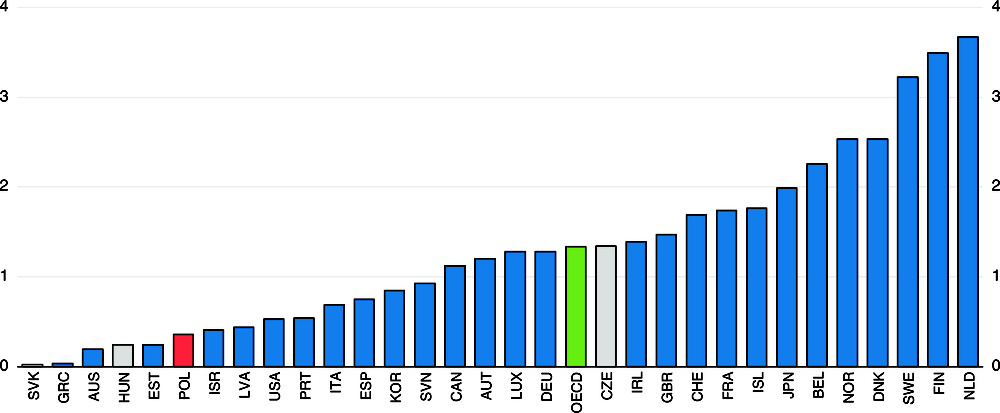
← 1. Refers to total public expenditure reported as related to either health or social long-term care under the System of Health Accounts definitions.
← 2. Or latest available year.
Source: OECD (2017), OECD Health Statistics (database).
Making the best of migration and improving job quality
Connecting to the Polish diaspora to advertise interesting job and business opportunities in Poland (Table 7) and facilitating integration of foreign migrants can also help alleviate the pressures from ageing and labour shortages. Annual emigration flows have stabilised at about 1% of the working-age population. At the end of 2016 about 2.5 million Poles were living outside Poland for more than three months, mostly in the United Kingdom and Germany (Statistics Poland, 2017c). The current inflow of Ukrainians is partly offsetting these demographic developments, but many work in professions that do not match their often high qualifications; better foreign credentials recognition will be needed to provide for good skills matches and to address shortages in higher-skill professions. As the strong inflow of Ukrainians may not be sustained, opening up to workers from a wider set of countries is desirable, but this will require access to language training for workers and to education from a very young age for their children (Table 7). This is not ensured, given that Poland’s immigration experience is recent, and the migration strategy abandoned in 2017 has not yet been replaced. It will be crucial to develop a new strategy as foreseen in the Strategy for Responsible Development.
Requiring only a simple declaration of intent to workers from neighbouring non-EU countries for short assignments makes Poland one of the most open countries in the OECD. Abuse of the simplified procedure is widespread according to the trade unions, which report dozens of complaints every day from Ukrainian workers who came to Poland after having paid for what turns out to be a falsified declaration of intent to hire them. Setting up a system to monitor immigrant workers’ skills and their willingness to stay in Poland beyond a short assignment would enable the government to better understand the impact of immigration on the labour market and develop policies to improve it.
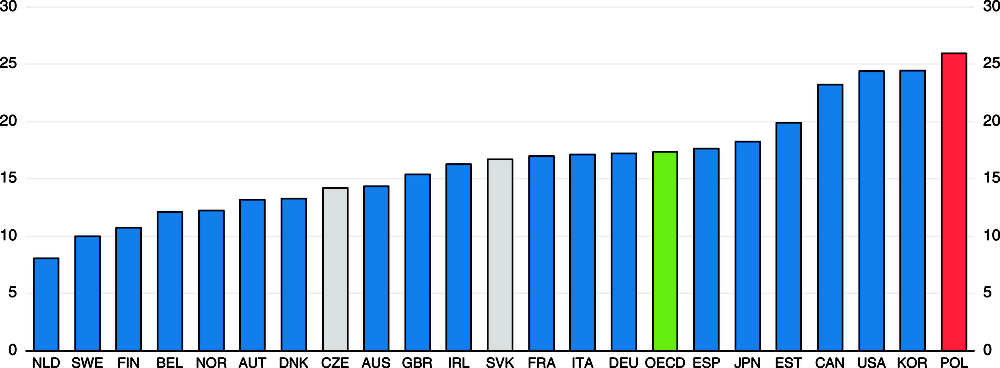
The share of temporary contracts has been falling, but remains among the highest in the European Union (26%). These workers suffer from a wage penalty, and low job security and quality (Gora et al., 2017) compared to workers on permanent contracts with otherwise similar characteristics. More than 14% of temporary workers work on freelancing type of contracts based on general civil rather than labour law, which are not fully covered by social security benefits and workers’ rights. The use of such civil-law contracts is often illegal, but employers’ probability of being inspected over their use of such contracts is below 1% (Gora et al., 2017). Few infractions are fined, and the average penalty is low (OECD, 2016a). Hence, labour-law enforcement needs to be strengthened, as previous Surveys have argued (Table 7). Around 3% of workers have no written contact at all according to Labour Force Statistics. Statistics Poland estimates employment in the informal or hidden economy at 5%.
Investing in higher education and research
Strengthening funding, researchers’ training and careers
There is room to improve the quality of higher education and research in Poland – the key ingredients to strengthen the economy’s capacity to innovate and adopt new technologies. Academic research excellence and availability of researchers have been shown to stimulate the growth of local industrial R&D from both domestic and foreign sources (Abramovsky et al., 2007; Belderbos et al., 2014; Siedschlag et al., 2013). Poland has benefitted from an unprecedented tertiary education boom, but the quality of some of its higher education institutions and research output overall is weak by international standards despite notable improvements. The supply of researchers is low, but rising (Figure 27, Panel A). A draft law being prepared by the government is intended to address many of these concerns.
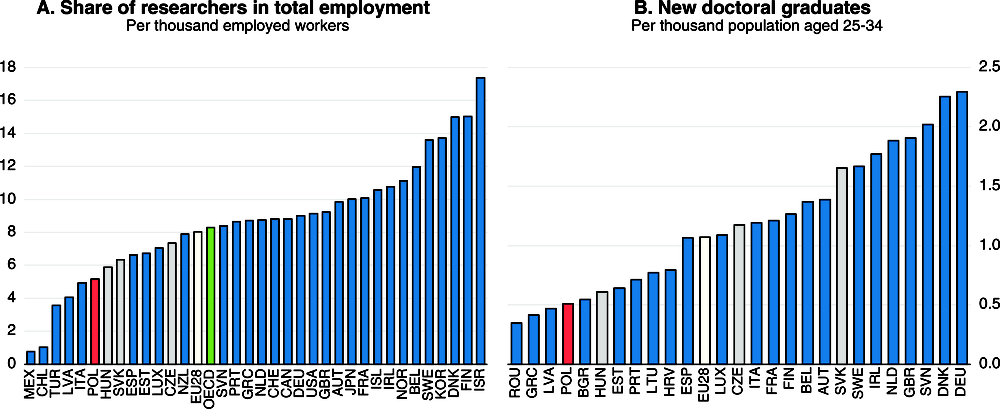
← 1. Or latest year available.
Source: OECD (2017), OECD Research and Development Statistics (database); European Commission (2017), Research and Innovation Observatory – Horizon 2020 Policy Support Facility, https://rio.jrc.ec.europa.eu/en/stats.
While spending on tertiary education has risen, it remains low in relation to the large number of students (Figure 28). A multi-year plan to increase funding linked to improvements in spending is needed. The sector is fragmented, with many small, specialised institutions. Building larger, more diversified universities through financially supported mergers might ensure a more efficient use of infrastructure and staff. With its envisaged higher education reform Poland wants to promote voluntary mergers with “federations” of higher education institutions as an intermediate step to full mergers. However, examples from other OECD countries, such as France, suggest that some element of compulsion may be necessary to make these mergers happen. Integrating the best public research institutes, which are currently independent and interact little with universities, would also help to make better use of experienced research staff and infrastructure and to build a number of highly ranked research universities, which are currently lacking. The government plans to award extra funding for a multi-annual period to the best performing universities. While this can be useful to build some strong research universities, this should not drain funding from higher education institutions with other important missions, such as vocational training.
1. Spending for core educational services, ancillary services and R&D.
Source: OECD (2017), OECD Education at a Glance 2017 (database).
The funding formula for higher education and research institutes provides incentives to take on large numbers of doctoral students without regard to quality. They are typically supervised by a single professor, many of whom do not produce high-quality research themselves. Structured doctoral training programmes are lacking. As a result, roughly half of Poland’s doctoral candidates do not work on their thesis, and their graduation rate is low (European Commission, 2017c; Figure 27). Doctoral studies need tighter entry requirements and shorter duration, along with a more structured transmission of disciplinary knowledge and transversal skills. These programmes could be linked to competitively awarded doctoral fellowships. The government plans to develop more structured doctoral training with Ph.D. grant funding based on a competition and stricter requirements to award a doctoral degree. This could help foster effectiveness, mobility and collaboration among Polish and foreign universities, which are currently weak.
Criteria for the evaluation of higher education institutions by the Committee for the Evaluation of Scientific Institutions (KEJN) have to be better linked to quality, such as publication impact, rather than quantity, such as the number of publications and doctoral students. Continuing to allow higher education institutions to close down if they fail to improve after several years of negative evaluations by the independent accreditation agency PKA is appropriate. Entitling PKA to conduct institutional assessments to help institutions improve rather than focussing narrowly on study programme evaluations would be helpful in that respect. The new graduate tracking system will be useful for such evaluations, as it will help improve transparency regarding the ability of higher education institutions to provide their graduates with good career opportunities.
Employment conditions for young researchers in Poland are unstable, pay remains relatively low despite improvements, and conditions for doing research are not often attractive. As an example, even top departments for social sciences and humanities lack office space for post-doctoral researchers and sometimes even full professors, weighing on collaboration. Senior research staff enjoy high job security, independently of their research and teaching achievements. Reforms are needed to enable universities to offer well-remunerated entry-level positions for a limited but sufficiently long time to allow researchers to develop their work. This should be followed by a possibility to obtain a full professorship at the same university or elsewhere conditional on an evaluation of research quality and impact by both faculty members and independent experts, possibly also from other countries. Further pay and career progression should depend on similar review mechanisms. Making academic careers more attractive with pathways more similar to those found abroad would also help to attract the Polish research diaspora and foreign researchers, although grants for short stays at Polish universities are also required. The Polish government wants to promote academic exchange through a new dedicated agency. Providing sufficient flexibility to combine a career in research with family life, for example by lengthening the duration of entry-level contracts in line with family-related career breaks and postponing the final evaluation accordingly, will help attract and retain women. They are relatively well represented in lower-ranking positions, but become rarer with each step in the hierarchy.
Enhancing industry-science cooperation
The government wants to create better incentives to commercialise research results, since, in general, industry-science collaboration is weak in Poland (Figure 29). It intends to do so by giving more weight to successful commercialisation in institutional and individual evaluations determining research funding. First steps in this direction were taken in 2017, including with a new programme that promotes developing applied research as an employee in a company in collaboration with a highly-ranked university to obtain a doctorate degree. It should go further by allowing professors to work part-time on commercial activities, as well. Some university technology transfer offices are very active in helping local business to use their universities’ know-how and research, but many such offices suffer from weak financing and difficulties in attracting and retaining qualified staff. A 2016 law stipulates that 2% of institutional R&D funding has to be set aside for research commercialisation. Merging them across universities that are close to each other would help reap economies of scale and stimulate research collaboration across institutions.
1. Or latest year available.
Source: OECD (2017), OECD Research and Development Statistics (database); Eurostat (2017), European Innovation Scoreboard 2017, http://ec.europa.eu/growth/industry/innovation/facts-figures/scoreboards_en.
Most university assets, including intangibles, remain subject to public finance law, lengthening and complicating procedures. Since the market for innovations moves fast, this can severely impinge on chances for successful commercialisation. It reduces flexibility: one example is that research institutions cannot accept a lower price for their know-how in return for their business partners renting some of their laboratory infrastructure. The system has held back universities’ cooperation with SMEs, in particular, as they often cannot afford the intellectual capital prices established through external expertise, and they need simpler procedures. In many other OECD countries higher education and research institutions’ intangible assets do not belong to the public finance sphere, offering more freedom of operations.
Investing in adult learning and vocational training
Enhanced education and training will be essential to help Poland’s many small and relatively unproductive firms to become more efficient. Focussing on high-tech start-ups will not be enough to lift the performance of the Polish economy. Relatively unproductive micro firms operating in mature sectors employ a large share of the labour force, and they need support to modernise and improve their efficiency (Figure 30). Many adults have exceptionally weak literacy, numeracy and, above all, digital skills and struggle to understand even simple texts and basic algebra or use a computer. This also holds for managers (Figure 31). The shares of adults with no computer experience and of those who failed the core ICT test of the OECD Survey of Adult Skills (PIAAC) are among the highest in the OECD (OECD, 2016c). Training for their managers and the general workforce is needed.
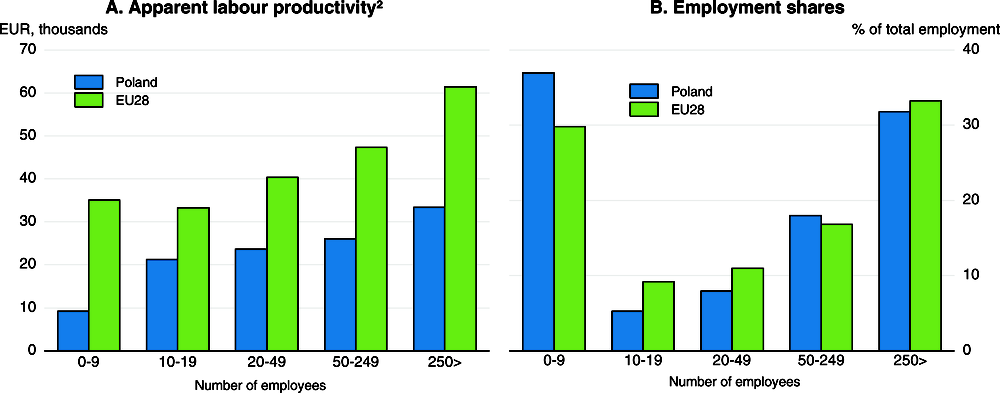
1. 2014 for EU28.
2. Gross value added per person employed.
Source: Eurostat; OECD (2018), OECD Structural and Demographic Business Statistics – SDBS (database).
← 1. Share of managers with at least upper secondary education scoring below level 2 in at least one of the PIAAC proficiency scales, i.e. literacy, numeracy and problem-solving in technology-rich environments.
Source: OECD (2013), OECD Skills Outlook 2013 (database).
The Polish government plans with the OECD to develop a skills strategy involving the whole government and stakeholders, including early-childhood and compulsory education, and this is welcome. Basic skills should feature high on this agenda, as Poland currently lacks a strategy to improve literacy and basic skills, which would help to lift economic opportunities and well-being for the poorest. There is insufficient awareness about such skills deficiencies and the need to develop relevant programmes. In Germany, France and the United Kingdom, basic-skills strategies feature information campaigns to raise awareness, specialised training measures for basic-skills trainers, partnerships with schools and employers to reach workers and parents with weak literacy, as well as training for job-search assistants and continuing-education teachers to identify clients with weak basic skills (OECD, 2016a). Basic-skills training combined with practical work experience in firms can be particularly helpful to motivate candidates.
Participation in adult learning is low and has been declining over the last decade (Figure 32), particularly among older workers and the low skilled, who need it most. Data from the OECD Survey of Adult Skills reveal that more than 60% of Polish adults have no intention to participate in adult learning compared to 40% on average elsewhere. And while three-quarters of firms complain that they cannot find workers with the right skills, few show a willingness to invest in their employees’ training (PARP, 2015). This may point to SMEs’ lack of longer-term skills strategies and understanding of the benefits of training, but also to doubts about its necessity. The government should campaign to convince firms that without investing in training they cannot hope to find workers with the right skills. Advertising successful examples, such as training programmes from a number of German investors in Poland (see Chapter 1), along with studies that point to the net longer-term gains from training investments (see, for example, BIBB, 2015), would be helpful. In 2016 the Polish Agency for Enterprise Development (PARP) started to certify providers of training and other enterprise support services, such as consulting and mentoring, through certified private accreditors, and this should become the norm to improve information available to potential trainees about providers’ quality. The government’s pilot project to build a network of local adult learning centres focussing on low-skilled and inactive adults with regular evaluations (Table 8) is an opportunity to raise quality standards.
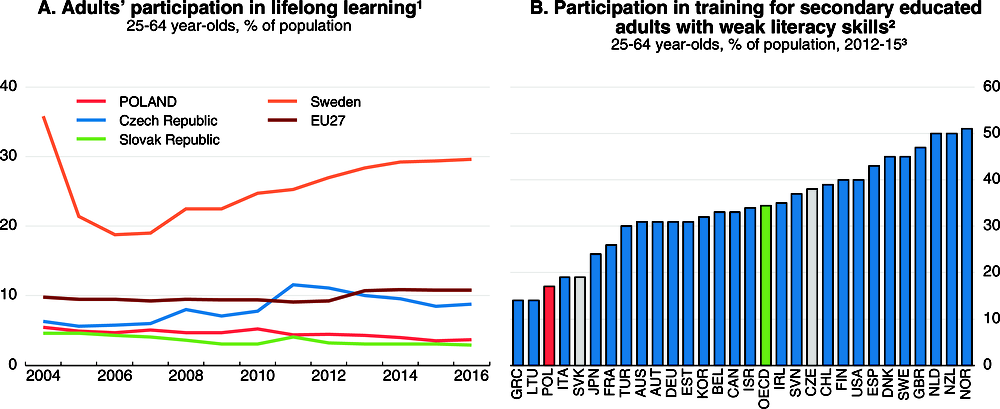
1. Percentage of 25-64 year-olds who participated in formal or informal training or education in the four weeks prior to the survey.
2. Access to formal and informal training of 25-64 year-olds scoring below level 2 in PIAAC’s reading proficiency scale.
3. The data are based solely on Flanders for Belgium and England for the United Kingdom.
Source: Eurostat (2017), “Adult learning”, Eurostat Database; OECD (2016), Skills Matter: Further Results from the Survey of Adult Skills, OECD Publishing, Paris.
While the average reading, math and science skills of 15-year-old Poles is above the OECD average, basic vocational education at the secondary level suffers from a bad reputation and weak employer engagement. Many of the weakest students are in these schools, and enrolment has been declining for many years. A 2017 reform replaced basic vocational schools with so called sectoral schools offering a first professional qualification after three years and a second qualification after two more years, at which point there is the possibility to take matriculation (matura) exams opening the way to tertiary education, the same as in general upper secondary schools. A matriculation exam with more of an emphasis on practical skills in the students’ vocational specialisation instead, akin to the Swiss Berufsmatura, would better correspond to the skill set of vocational students. This would require persuading employers to offer work placements, participate in programme design and exams in the spirit of apprenticeship systems in German-speaking countries. Given rising skills shortages, employers’ interest in training workers has risen recently. The government is currently holding seminars with employers from a large range of sectors, including sectoral skills councils set up by PARP (Table 8), to identify the need for new training programmes and develop guidelines for schools and employers to work together, as there is little experience with such cooperation. Poland’s numerous SMEs often shy away from the logistical difficulties and costs of setting up training. Australia’s Group Training Organisations, which pool recruitment and placement of apprentices, quality control and management of employer responsibilities, could be a solution (OECD, 2016d). Offering rewardingpay and career prospects to attract teachers with strong pedagogical skills to vocational schools with opportunities to update their industry knowledge through part-time work will be essential to help weak students to progress, especially since a large part of the teaching workforce is set to retire (Table 8).
Better business engagement in vocational higher education is also needed. The share of young tertiary education graduates with literacy and numeracy skills at the limit of illiteracy is high (Figure 33, Panel A), indicating that too many youngsters enter university who would be better off with a more vocational orientation combined with basic-skills training. Public higher vocational schools are mainly located in former regional capitals. They suffer from declining student enrolment, a lack of short-cycle programmes with work-based learning opportunities (Panel B) and weak alignment with regional labour market needs. Most awarded degrees are in social and medical sciences, with graduates in the former in particular facing relatively poor labour market outcomes (European Commission, 2017c). The government plans more short-cycle programmes, but Poland also needs a strategy as to how to engage with employers to develop strong vocational programmes. Current plans to integrate internships that last at least six months into study programmes can be a useful first step, but full co-financing with business should be the ultimate goal, as in the Netherlands and Germany where business partners employ students throughout their studies. Such a model would best ensure alignment of study programmes with labour market demand and fit the needs and interests of less academically minded students. Higher vocational institutions could play an important role in offering adult learning and cost-effective distance- or blended-learning models to reach students in peripheral areas and from lower socio-economic backgrounds. They could also provide training and R&D opportunities for smaller firms in the region.
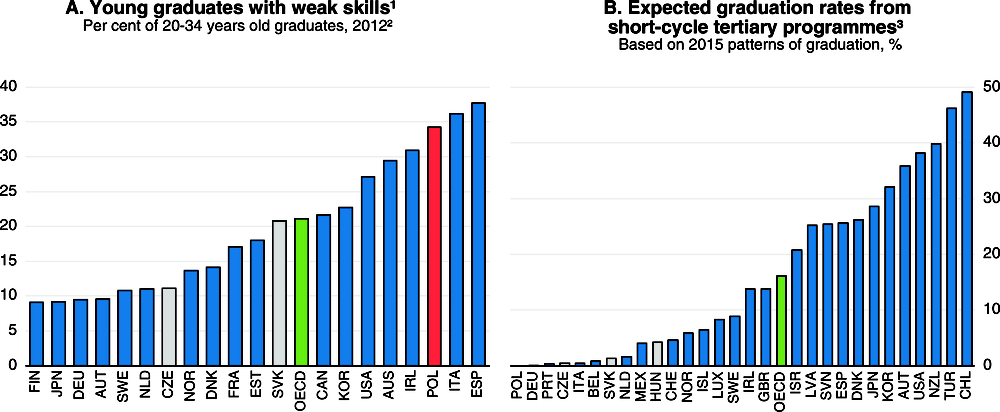
1. Share of 20-34 year-old adults scoring below level 2 of the PIAAC scale of numeracy proficiency.
2. The data are based solely on Flanders for Belgium, and England and Northern Ireland for the United Kingdom.
3. Net tertiary (first-time) graduation rates representing young people’s expected probability of graduation from short-cycle tertiary programmes over a lifetime if current graduation patterns are maintained.
Source: OECD (2013), OECD Skills Outlook 2013 (database); OECD (2017), Education at a Glance 2017, Table C3.3, OECD Publishing, Paris.
Promoting innovation and investment
Improving the effectiveness of innovation support
The authorities are developing venture capital (VC) funding for young, innovative and risky firms, mainly through EU funds. VC funding will support innovative entrepreneurs at all stages of development. Heretofore VC funding has been rare in Poland (Figure 34). However, the sharp increase in Poland’s available VC financing may not be matched by a sufficiently large pool of nascent high-tech firms. In the past much smaller VC support programmes had to be significantly scaled back owing to a lack of viable projects. Both the quality of research output (see Figure 6) and the supply of researchers (see Figure 27) are much stronger in the United States and Israel, the OECD countries with the strongest VC base, than in Poland. Thus, investing in higher education and research is a necessary prerequisite for developing the VC market. The Innovation Council, which since 2016 has brought together Ministers to coordinate innovation policies, should evaluate the effectiveness of the programme as planned and, should available funds exceed demand, consider re-assigning some to support for lower-tech innovations and small innovative firms. While a committee connected to the Innovation Council meets on a weekly basis, often inviting business representatives to discuss particular topics, getting more systematic input from the public to the Council through full membership of private sector representatives could help better inform its perspective and facilitate the development of effective policies. Productivity commissions from several OECD countries, such as Australia, Denmark and New Zealand, have private sector members (Banks, 2015).
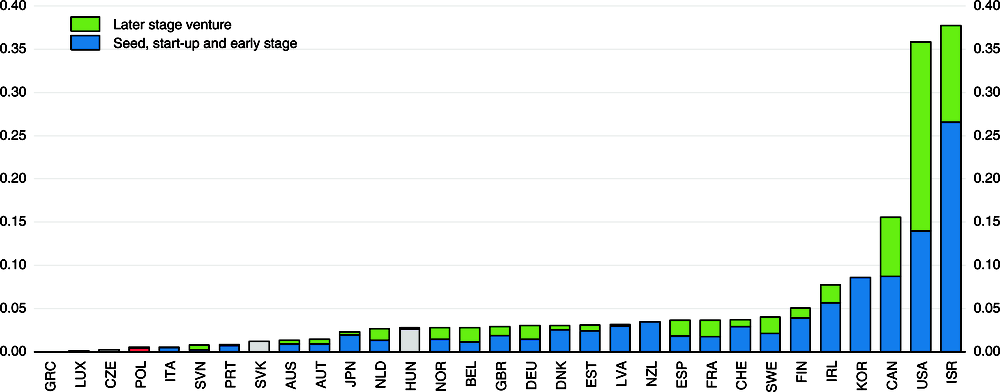
← 1. Only the value of total venture capital investments is available for Korea and New Zealand.
← 2. Or latest year available.
Source: OECD (2017), OECD Entrepreneurship at a Glance 2017, OECD Publishing, Paris.
The government has increased R&D tax allowances to 100% for all firms from 2018 (and up to 150% for research centres), up from 30-50%. This is welcome, as public support for business R&D has been low (Figure 35). The list of eligible costs, which has created much confusion leading to a low take-up, will be extended and clarified (Deloitte, 2016). To ensure effectiveness, clear information for taxpayers and consistent treatment of R&D tax claims are needed. A centralised review of claims along with continued training of tax administration personnel would be helpful in this respect. The draft bill envisages that the tax allowances can be carried forward for up to six years. This is meant to help small and young innovative firms, which typically make losses initially and suffer from liquidity constraints. Yet, should the take-up for these firms still be low, the authorities should consider adjusting its provisions (e.g. by making cash refunds more generally available and not just to the youngest companies) to boost private R&D spending.
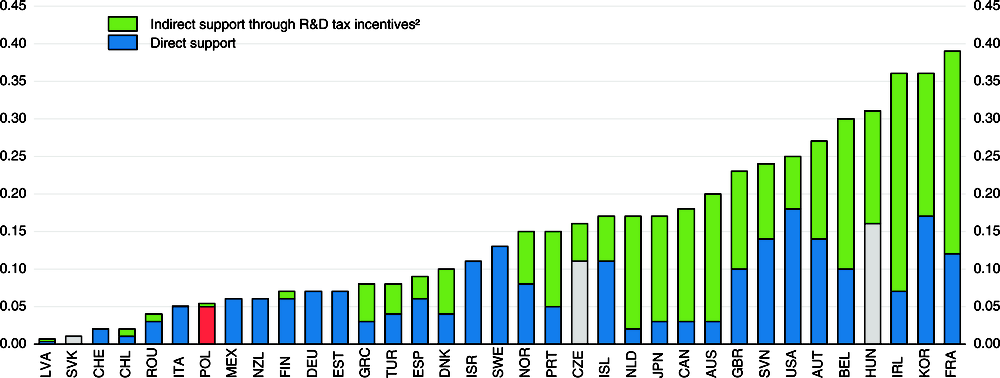
← 1. Or latest available year.
2. Indirect support refers to PLN 284 million CIT tax exemptions granted for innovation activities in 2014.
Source: OECD (2015), OECD Science, Technology and Industry Scoreboard 2015 (database).
The grant system for innovation needs to become better at steering funds towards the most innovative projects, including in small enterprises. The system should be used to support high-risk, long-term research or specific domains where innovation leads to the development of public goods (Appelt et al., 2017). However, in the past many programmes offered grants for buying fixed assets, which typically entail little or no spillovers. Long and complicated application procedures and often confusing information about them constituted an unsurmountable barrier for many SMEs (Kapil et al., 2013; NIK, 2016). The government has reduced paperwork and moved to digital applications. To prevent promising projects from failing because of formalities it is considering completely abandoning formal criteria as an initial filter. Instead, it would work on formalities with candidates with promising projects in the substantive phase and hold more face-to-face interviews so that applicants can explain their ideas in person. These are welcome steps. It should also consider providing regions, which administer a large share of innovation support financed by EU funds, with technical help to develop clear and effective guidance for applicants. This could be through the National Centre for Research and Development (NCBiR), which has a good track record in this respect. Further developing PARP’s database with certified mentoring and consulting services to help firms apply for funds and implement their ideas would also be useful. OECD experience suggests that a brokerage service bringing together SMEs and research partners could improve the take-up of the innovation voucher programmes, which would allow small firms to buy R&D services (OECD, 2010b). At the moment, firms have to publish their request for support from a research institution on a public competition database, a demanding task for SMEs, which should be re-assessed jointly with the European Commission,which set this requirement.
Enhancing the investment framework
SMEs’ access to finance has improved in recent years, and the share of Polish SMEs citing access to finance as their most important concern stood at 7% in 2017, in line with the EU average (European Commission, 2017d). As in other OECD economies loan guarantees from the government are the most common policy tool to facilitate SMEs’ access to finance. Overall, loan guarantees amounted to about 0.8% of GDP in 2016, among the highest in OECD countries (Figure 36). The biggest programme, the “de minimis guarantee”, administered by the state-owned bank BGK, was introduced as a temporary measure in 2013 as the economy slowed down, but it is being turned into a permanent programme. A survey conducted by BGK in 2017 shows that 11% of firms would have obtained a comparable loan without the guarantee in place and 18% of the firms declared that “it’s hard to say” (BGK, 2017), suggesting that the programme could be better targeted. Yet, large guarantee programmes may induce bank forbearance – which can lead to the survival of low-productivity firms with adverse effects on long-run efficiency (Adalet McGowan et al., 2017) – and crowd-out alternative financing sources. As in other OECD economies (OECD, 2017d), a rigorous evaluation of the cost effectiveness of the existing programme is lacking and should be conducted. In that respect, making data available to third parties (including external researchers), as the US Small Business Administration does, would be helpful. If needed, the eligibility criteria of the programme should then be adjusted to ensure that it targets firms that are most likely to lack external financing options, namely smaller SMEs, and service-sector and innovative companies with knowledge-basedbut no tangible capital as collateral.
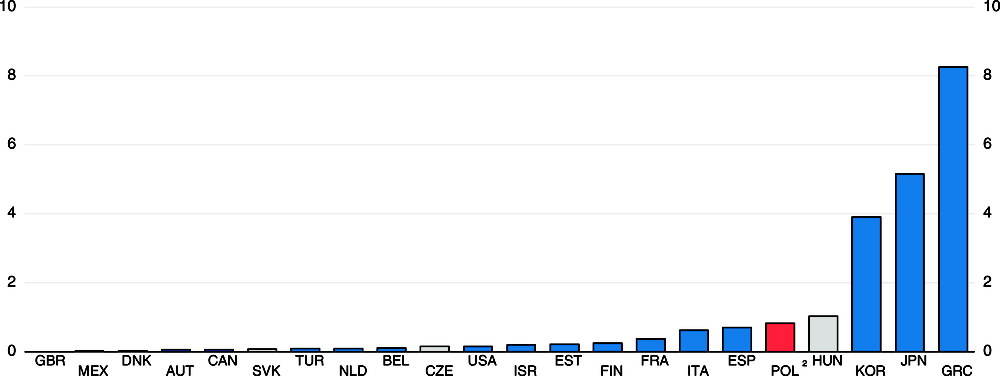
← 1. Or latest available year.
2. 2016 data for Poland. They refer to PLN 13.9 billion of outstanding de minimis guarantees at end-2016 and PLN 1.59 billion of guarantees from local and regional funds.
Source: OECD (2017), Financing SMEs and entrepreneurs 2017, an OECD scoreboard, OECD Publishing, Paris; NBP (2016), Financial Stability Report, December, Narodowy Bank Polski.
Boosting competition would also support investment. One channel could be through foreign direct investment (FDI). It would benefit from ensuring a level-playing field in all sectors of the economy and would strengthen technology transfers through multinational companies with potential innovation spill-overs to local firms. Until recently Poland received less FDI for its size than neighbouring countries (Figure 37), which can be partly explained by higher regulatory barriers (Figure 38). Moreover, the authorities have a wide scope for restricting mergers on public-interest grounds. Enhancing competition in services, for example by easing relatively restrictive entry requirements in legal, architecture and engineering services, which are key inputs to other sectors, would help boost exports and economic activity. The independence of the Competition Authority and sector regulators should also be strengthened (Table 9).
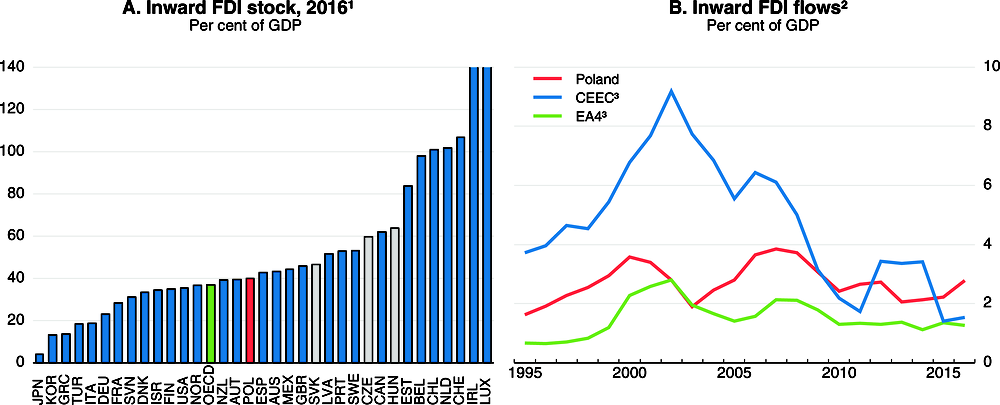
1. Or latest available year.
2. Three-year moving average; for each country considered, average annual FDI inflows measured in per cent of GDP have been by convention considered as nil in the limited cases of negative net balances (disinvestments).
3. EA4 is the average of Germany, France, Italy and Spain. CEEC is the simple average of Hungary and the Czech and Slovak Republics.
Source: OECD (2018), OECD FDI Statistics (database).
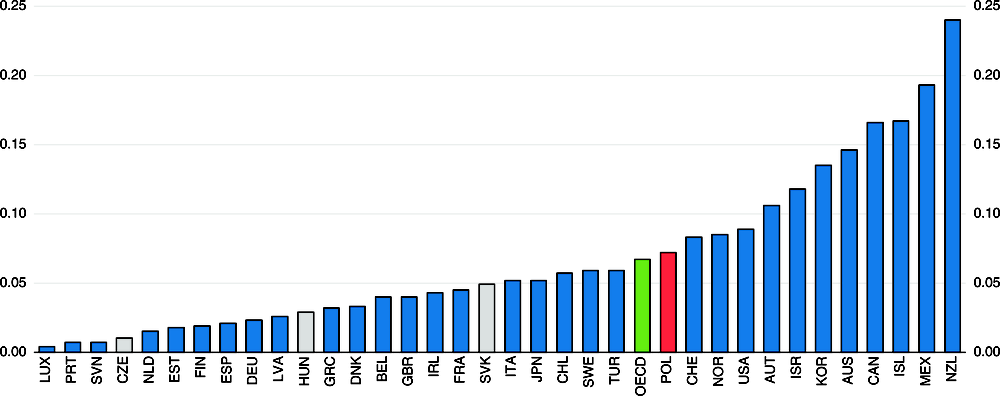
← 1. Index scale of 0 to 1, from least to most restrictive.
Source: OECD (2018), OECD FDI Statistics (database).
The government is in the process of reorganising tax relief for investments with a view to granting support depending on investment quality rather than location. Planned fiscal support includes a corporate income tax exemption for up to 15 years regardless of whether the investment is located in one of the country’s special economic zones. The minimum size of investment spending required for eligibility will depend on local unemployment rates. There will also be qualitative criteria, which have yet to be defined by regulations. They may include investment in research or training and collaboration with local enterprises. The qualitative and quantitative criteria have been adapted to the capabilities of SMEs, so as to increase investment among this category of firms. If the situation of the state budget requires it, the draft bill foresees the possibility that the authorities can suspend offering tax relief for new investments. Clarifying the conditions under which support may be withdrawn would help alleviate regulatory uncertainty and maximise the investment boost from this policy. Some special economic zone management agencies have been very successful in helping investors to collaborate with local universities, vocational schools and enterprises to facilitate their investments in research, training and networking. Organising exchange of good practices among these management agencies will be crucial to attract high-quality investment to Poland. Furthermore, the government is amending the programme for supporting investments of major importance to the Polish economy. Support will be dedicated to investments of Polish and foreign companies that will be crucial for increasing innovation and competitiveness of the economy.
Poland’s performance in the World Bank’s Ease of Doing Business index has improved (Figure 39, Panel A), but Poland’s ranking in the OECD’s product market regulation indicator is penalised by the heavy state involvement in the economy (Panel B). State-owned enterprises (SOEs) play a large role in important sectors of the economy that are subject to regulation, including in utilities and financial sectors. To avoid discouraging private investment in these sectors, adhering to the OECD Guidelines on Corporate Governance of State-Owned Enterprises is essential. In that respect the move to attribute SOE supervision to the ministries that are also in charge of sectoral regulation (with limited oversight from the Prime Minister’s office) risks creating conflicts of interest, as limiting competition can help the government increase the earnings of the enterprises it owns. It would also be useful to assess whether state ownership is necessary in all cases. When there are no obvious market failures, privatisation would be advisable and extensions of state control inappropriate as they distort competition. For example, the share of state-controlled banks has increased following the recent purchases of stakes by the authorities in two large banks, and it now represents close to 40% of banking sector assets, which is unusually high among OECD economies.
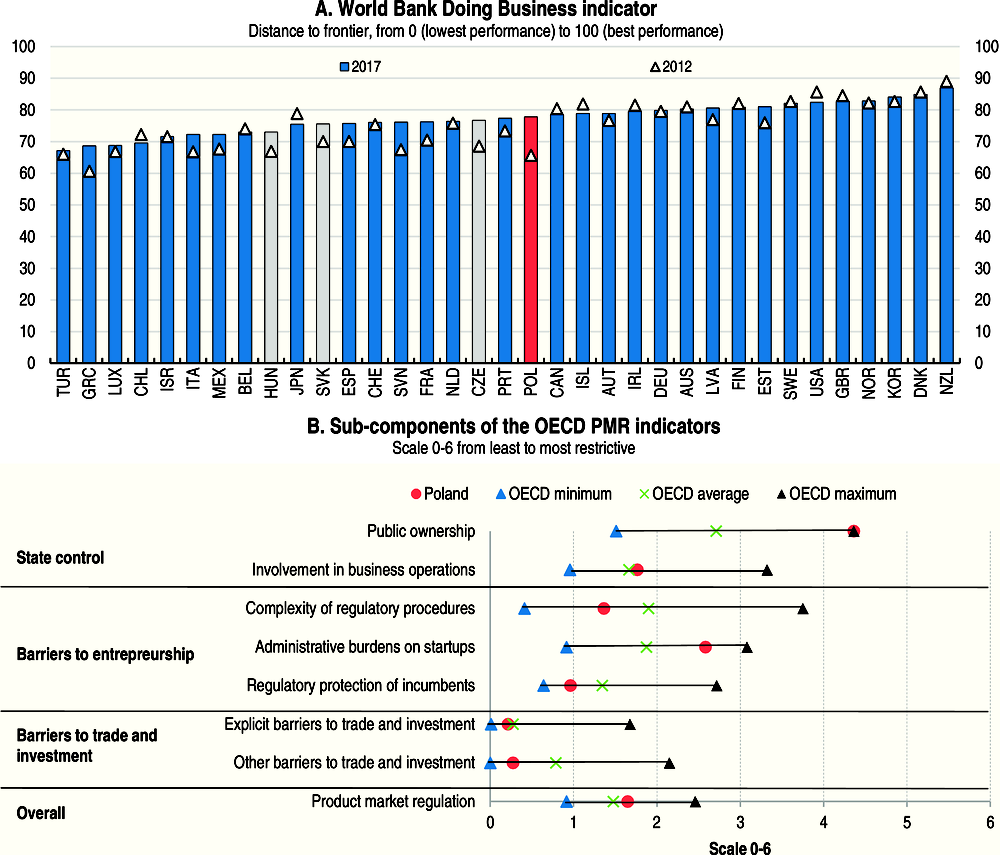
Source: World Bank (2017), Doing Business 2018 (database), the World Bank Group, Washington, DC; OECD (2017), OECD Product Market Regulation Indicators (database).
Faster and efficient insolvency procedures could boost productivity-enhancing capital reallocation (Adalet McGowan et al., 2017). The 2016 corporate insolvency reform was a significant improvement, with new restructuring procedures helping to avoid unnecessary bankruptcies. A dedicated tribunal in charge of firm restructuring was also put in place, and a register of bankruptcies is set to operate as of 2018. However, bankruptcy procedures remain lengthy and complex (Figure 40), slowing down resource reallocation. The objective set out in the government’s Strategy for Responsible Development to lower the duration to two years by 2030 is not sufficiently ambitious. Court clerks (referendarz) could be allowed to tackle small non-litigious cases to free up judges’ time (World Bank, 2013). Promoting out-of-court settlements, possibly by developing mediation, could also speed up the court system. Developing special insolvency procedures for SMEs, akin to those found in other OECD countries, is warranted, as they are frequently unable to cover the costs of formal insolvency proceedings.
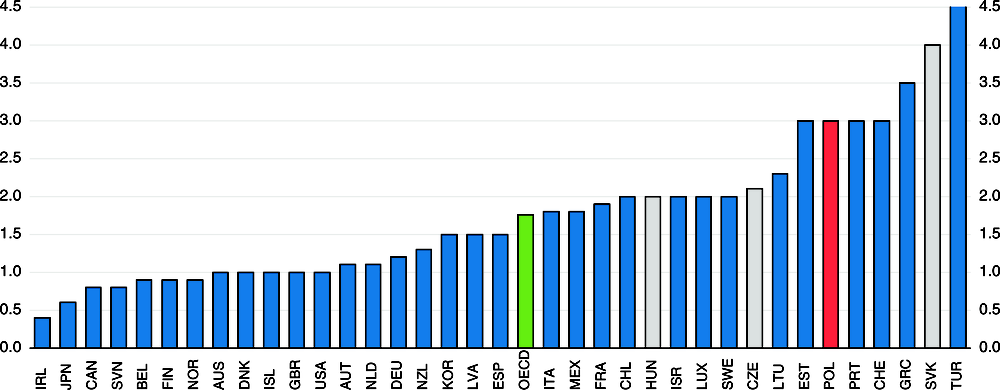
← 1. Period from the company’s default until the payment of some or all of the money owed to the bank.
Source: World Bank (2017), Doing Business 2018: Reforming to Create Jobs (database), the World Bank Group, Washington, DC.
Administrative barriers to firm entry are high despite improvements, and tax procedures remain time consuming (Figure 41). The government’s “100 changes for business” and “business constitution” programmes introduce business simplification measures and aim to improve the clarity of tax regulations (Table 9). The authorities are also, however, in the process of gradually implementing a ban on Sunday trading. This should be carefully weighed against its possible negative employment effects (Genakos and Danchev, 2015). Further simplification efforts should concentrate on eliminating remaining hurdles to opening a business and facilitating paying taxes, including through better collaboration between the tax authorities and small businesses as the time required to pay taxes for Polish SMEs is the third highest in the European Union (European Commission, 2017e). But simplification should also take into account environmental and social effects. Eliminating the need for building permits for one-storey outbuildings and sheds is questionable in that respect, as Poland already suffers from substantial urban sprawl.
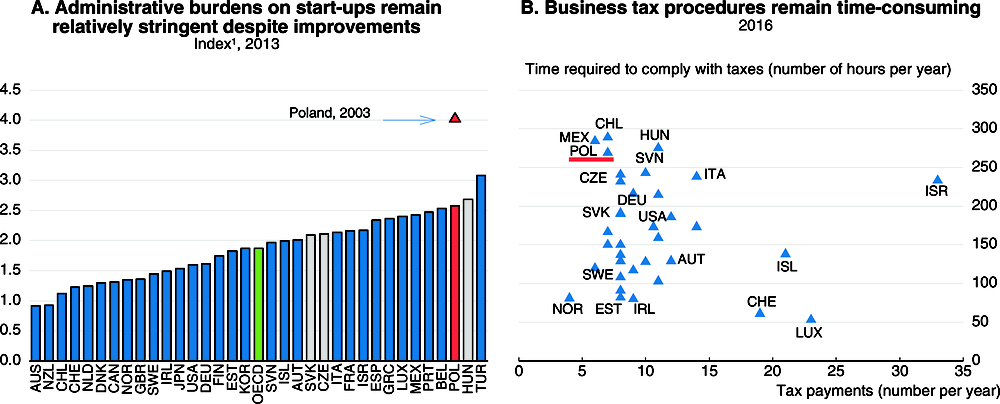
1. Index scale from 0 to 6, from least to most restrictive.
Source: OECD (2017), OECD Product Market Regulation Indicators (database); World Bank (2016), Paying Taxes 2017 (database), the World Bank Group, Washington, DC.
Bibliography
Abramovsky, L., R. Harrison and H. Simpson (2007), “University research and the location of business R&D”, The Economic Journal, Vol. 117, pp. C114-C141.
Adalet McGowan, M., D. Andrews and V. Millot (2017), “The Walking Dead? Zombie Firms and Productivity Performance in OECD Countries”, OECD Economics Department Working Paper, No. 1372, OECD Publishing, Paris, https://doi.org/10.1787/180d80ad-en.
Antolín, P. and D. Harrison (2012), “Annual DC pension statements and the communications challenge”, OECD Working Papers on Finance, Insurance and Private Pensions, No. 19, OECD Publishing, Paris, https://doi.org/10.1787/5k97gkd06kth-en.
Appelt, S., M. Bajgar, C. Criscuolo and F. Galindo-Rueda (2017), “R&D Tax Incentives: Evidence on design, incidence and impacts”, OECD Science, Technology and Industry Policy Papers, No. 32, OECD Publishing, Paris, https://doi.org/10.1787/5jlr8fldqk7j-en.
Bank Gospodarstwa Krajowego (BGK) (2017), “Outcomes of de minimis Guarantee Scheme”, Warsaw, www.bgk.pl/files/public/Pliki/news/Ekspertyzy_BGK/Efekty_Programu_Gwarancji_de_minimis/Broszura_ PLDII_eng.pdf.
Banks, G. (2015), “Institutions to promote pro-productivity policies: Logic and lessons”, OECD Productivity Working Papers, No. 1, OECD Publishing, Paris.
Belderbos, R., V. van Roy, B. Leten and B. Thijs (2014), “Academic research strengths and multinational firms’ foreign R&D location decisions: Evidence from R&D investments in European regions”, Environment and Planning, Vol. 46, pp. 920-42.
Bundesinstitut für berufliche Bildung (BIBB) (2015), Kosten und Nutzen der betrieblichen Ausbildung, Bonn.
Cabrillac, B. and F. Pappadà (2017), “Tax compliance, default risk and GDP linked bonds”, Banque de France Eco Notepad, Paris, https://blocnotesdeleco.banque-france.fr/en/blog-entry/tax-compliance-default-risk-and-gdp-linked-bonds.
Cavalleri, M.C. and Y. Guillemette (2017), “A revised approach to trend employment projections in long-term scenarios”, OECD Economics Department Working Paper, No. 1384, OECD Publishing, Paris, https://doi.org/10.1787/075f0153-en.
Choi, J., D. Laibson, B. Madrian and A. Metrick (2002), “Defined contribution pensions: Plan rules, participant choices, and the path of least resistance”, Tax policy and the economy, Vol. 16, pp. 67-113.
Cribb, J., C. Emmerson and G. Tetlow (2016), “Signals matter? Large retirement responses to limited financial incentives”, Labour Economics, Vol. 42, pp. 203-12.
Deloitte (2016), Poland – Corporate R&D Report 2016, Warsaw, www2.deloitte.com/content/dam/Deloitte/pl/Documents/Reports/pl_RD-2016-Poland-EN%20(1).pdf.
Deloitte (2017), European CFO Survey Q1 2017, www2.deloitte.com/uk/en/pages/finance/articles/european-cfo-survey.html.
Domagała, A. and J. Klich (2018), “Planning of Polish physician workforce – Systemic inconsistencies, challenges and possible ways forward”, Health Policy, Vol. 122, pp. 102-108.
Duflo, E. and E. Saez (2003), “The role of information and social interactions in retirement plan decisions: Evidence from a randomized experiment”, Quarterly Journal of Economics, Vol. 118, pp. 815-42.
European Commission (2017a), Country Report Poland, Brussels.
European Commission (2017b), Seventh Report on Economic, Social and Territorial Cohesion, Brussels.
European Commission (2017c), Poland’s Higher Education and Science System – Horizon 2020 Peer Review, Brussels.
European Commission (2017d), Survey on the Access to Finance of Enterprises (SAFE), Brussels.
European Commission (2017e), Annual Report on European SMEs, Brussels.
European Investment Bank (2017), Surveying Corporate Investment Activities, Needs and Financing in the EU 2016/2017, Brussels.
Felfe, C., N. Nollenberger and N. Rodríguez-Planas (2015), “Can’t buy mommy’s love? Universal childcare and children’s long-term cognitive development”, Journal of Population Economics, Vol. 28, No. 2, pp. 393-422.
Genakos, C. and S. Danchev (2014), “Evaluating the impact of Sunday trading deregulation”, Working Party No. 2 on Competition and Regulation, DAF/COMP/WP2(2014)1.
Givord, P. and C. Marbot (2015), “Does the cost of child care affect female labor market participation? An evaluation of a French reform of childcare subsidies”, Labour Economics, Vol. 36, pp. 99-111.
Góra, M., P. Lewandowski and M. Lis (2017), “Temporary employment boom in Poland – a job quality vs. quantity trade-off?”, Instytut Badan Strukturalnych Working Paper No. 04/2017, Warsaw.
Guillemette, Y. and P. Guérin (2017), “Simulating the effect of reforms to strengthen employment in Poland”, Technical Background Paper, OECD, Paris.
Haan, P. and K. Wrohlich (2011), “Can child care policy encourage employment and fertility? Evidence from a structural model”, Labour Economics, Vol. 18, pp. 498-512.
International Monetary Fund (2017a), Republic of Poland – 2017 Article IV Consultation, July, Washington, DC.
International Monetary Fund (2017b), “Tackling inequality”, Fiscal Monitor, October, Washington, DC.
International Monetary Fund (2017c), “Achieving more with less”, Fiscal Monitor, April, Washington, DC.
Kapil, N., M. Piatkowski, I. Radwan and J. Gutierrez (2013), “Poland enterprise innovation support review: From catching up to moving ahead”, World Bank Working Paper, No. 75325, Washington, DC.
Laroque, G. and B. Salanié (2014), “Identifying the response of fertility to financial incentives”, Journal of Applied Econometrics, Vol. 29, pp. 314-32.
Lewandowski, P. (2017), “Employment in Poland – old is the new young”, in Population Ageing, Labour Market and Public Finance in Poland, Institut Badán Strukturalnych, Warsaw.
Luci-Greulich, A. and O. Thévenon (2013), “The impact of family policies on fertility trends in developed countries”, European Journal of Population/Revue européenne de Démographie, Vol. 29, pp. 387-416.
Magda, I., A. Kielczewska and N. Brandt (2017), The impact of large child benefits on female labour supply – the case of Poland’s 500+ programme”, Technical Background Paper, OECD, Paris.
Ministry of Finance (2016), Preferencje podatkowe w Polsce, Warsaw, www.finanse.mf.gov.pl/documents/766655/5738108/20160804_Raport_Preferencje_Podatkowe_w_Polsce_nr_6.pdf.
Ministry of Finance (2017), “Informacja dotycząca rozliczenia podatku dochodowego od osób fizycznych za 2016 rok”, Warsaw.
Myck, M. (2017), “Estimating the labour supply response to the introduction of the 500+ programme”, Center for Economic Analysis Working Paper, No. 01/16, Szczecin.
National Bank of Poland (2016a), Financial Stability Report, December, Warsaw.
NIK (2016), NIK o obsłudze programów rządowych przez BGK – informacje szczegółowe, Najwyższa Izba Kontroli.
Nollenberger, N. and N. Rodríguez-Planas (2015), “Full-time universal childcare in a context of low maternal employment: Quasi-experimental evidence from Spain”, Labour Economics, Vol. 36, pp. 124-36.
OECD (2010a), Taxation, Innovation and the Environment, OECD Publishing, Paris, https://doi.org/10.1787/9789264087637-en.
OECD (2010b), Innovation Vouchers, www.oecd.org/innovation/policyplatform/48135973.pdf.
OECD (2014), OECD Economic Survey Poland, OECD Publishing, Paris, https://doi.org/10.1787/eco_surveys-pol-2016-en.
OECD (2015a), Taxation of SMEs in OECD and G20 Countries, OECD Publishing, Paris, https://doi.org/10.1787/9789264243507-en.
OECD (2015b), Limiting Base Erosion Involving Interest Deductions and Other Financial Payments, Action 4 – 2015 Final Report, OECD/G20 Base Erosion and Profit Shifting Project, OECD Publishing, Paris.
OECD (2015c), Ageing and Employment Policies: Poland 2015, OECD Publishing, Paris, https://doi.org/ 10.1787/9789264227279-en.
OECD (2016a), OECD Economic Survey Poland, OECD Publishing, Paris, https://doi.org/10.1787/eco_surveys-pol-2016-en.
OECD (2016b), OECD Pensions Outlook 2016, OECD Publishing, Paris, https://doi.org/10.1787/pens_outlook-2016-en.
OECD (2016c), Skills Matter – Further Results from the Survey of Adult Skills, OECD Publishing, Paris.
OECD (2016d), Investing in Youth: Australia, OECD Publishing, Paris.
OECD (2017a), Revenue Statistics 1965-2016, OECD Publishing, Paris.
OECD (2017b), Public Procurement for Innovation: Good Practices and Strategies, OECD Public Governance Reviews, OECD Publishing, Paris, https://doi.org/10.1787/9789264265820-en.
OECD (2017c), OECD Digital Economy Outlook 2017, OECD Publishing, Paris.
OECD (2017d), Evaluating Publicly Supported Credit Guarantee Programmes for SMEs, OECD Publishing, Paris, www.oecd.org/finance/financial-markets/Evaluating-Publicly-Supported-Credit-Guarantee-Programmes-for-SMEs.pdf.
PARP (2015), The Study of Human Capital in Poland, Warsaw.
PwC (2017), Wyłudzenia VAT – luka podatkowa w 2016 r. i prognoza na 2017 r., Warsaw, www.pwc.pl/pl/media/2017/2017-10-19-pwc-luka-vat-2017.html.
Riphahn, R. and F. Wiynck (2016), “Fertility effects of child benefits”, Bavarian Graduate Programme in Economics Research Paper, No. 164, Munich.
Schirle, T. (2015), “The effect of universal child benefits on labour supply”, Canadian Journal of Economics/Revue canadienne d’économique, Vol. 48, pp. 437-63.
Seibold, A. (2016), “Statutory ages and retirement: Evidence from Germany”, Working Paper, London School of Economics.
Siedschlag, J., D. Smith and X. Zhang (2013), “What determines the location choice of R&D activities by multinational firms?”, Research Policy, Vol. 42, pp. 1420-30.
Statistics Poland (2017a), “Zasięg ubóstwa ekonomicznego w Polsce w 2016 r.”, Warsaw, https://stat.gov.pl/obszary-tematyczne/warunki-zycia/ubostwo-pomoc-spoleczna/zasieg-ubostwa-ekonomicznego-w-polsce-w-2016-r-,14,4.html.
Statistics Poland (2017b), “Budżety gospodarstw domowych w 2016 r.”, Warsaw, https://stat.gov.pl/obszary-tematyczne/warunki-zycia/dochody-wydatki-i-warunki-zycia-ludnosci/budzety-gospodarstw-domowych-w-2016-r-,9,11.html.
Statistics Poland (2017c), “Informacja o rozmiarach i kierunkach czasowej emigracji z Polski w latach 2004-2016”, Warsaw, http://stat.gov.pl/obszary-tematyczne/ludnosc/migracje-zagraniczne-ludnosci/informacja-o-rozmiarach-i-kierunkach-emigracji-z-polski-w-latach-20042016,2,10.html#.
Tyrowicz, J. and N. Brandt (2017), “Simulating the effects of pension reforms in Poland in an overlapping generations model”, Technical Background Paper, OECD, Paris.
World Bank (2013), The status of contract enforcement in Poland, World Bank, Washington, DC.