Assessment and recommendations1
The economy is resilient and has sound fundamentals
The Israeli economy is enjoying its 13th consecutive year of growth, demonstrating remarkable resilience. Increases in output, averaging nearly 4% annually since 2003, have exceeded those of most other OECD countries. The country experienced only a mild slowdown in activity in 2014, despite the Gaza conflict, and growth continued in 2015, even if at a relatively moderate pace (Figure 1, Panel A). Weaker exports and investment, partly resulting from the appreciation of the currency since 2012, have led to a slowdown in per capita GDP growth (Panel B). However, the employment rate has continued to rise steadily (Panel C), the unemployment rate has fallen to around 5¼ per cent, and the external balance is in surplus.
These favourable economic outcomes are based on prudent macroeconomic policy pursued over the last decade. The authorities have maintained monetary and financial stability in a volatile and uncertain external environment. The fiscal strategy adopted in 2003 has kept public debt on a downward trend and brought the tax burden well below the OECD average (Figure 1, Panels D and E). Reforms to the welfare and pension systems have, in particular, helped to contain government spending. The banking system is profitable and well capitalised, although its heavy exposure to housing credit and the real estate industry is a risk factor that the Bank of Israel (BoI) is striving to reduce. Indebtedness of households and firms is low. Israel also has a vibrant high-tech sector, and the large reserves of natural gas discovered in 2009-10 are additional economic and environmental assets.
However, the country faces two important challenges:
-
Productivity growth has been weak and remains well below that in advanced countries in level terms. This reflects several structural shortcomings, in particular the marked disparity between highly dynamic exposed industries and a large, low-productivity sheltered sector that lacks competitive pressures. As seen below, this disparity is more pronounced than in the OECD average. Insufficiently developed infrastructure, especially in transportation, also hampers private-sector efficiency.
-
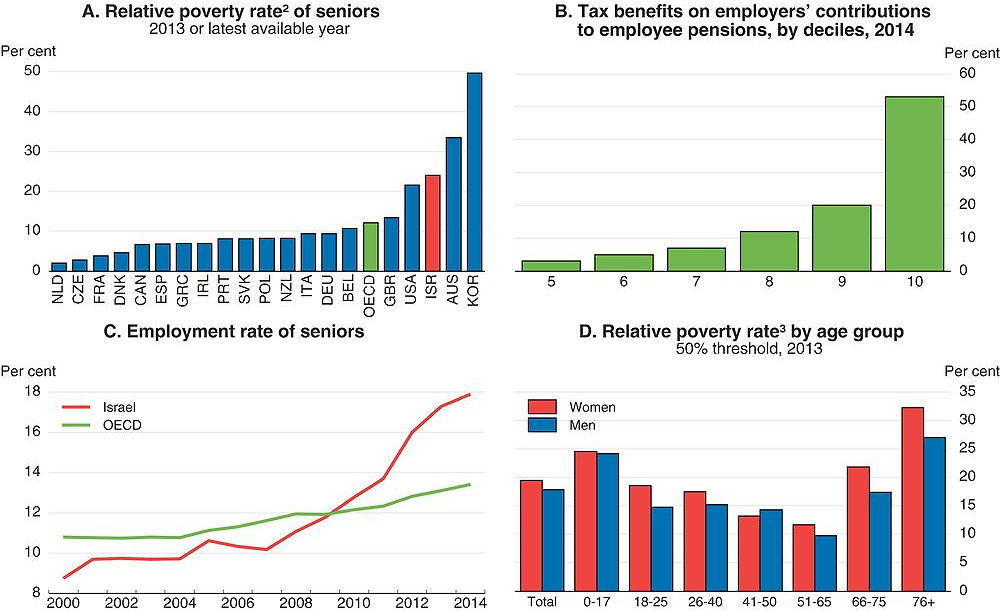
Income inequalities and, above all, poverty are high (Figure 1, Panel F). The employment rates for Ultra-Orthodox (Haredi) men and Arab-Israeli women remain low, although they have risen. Moreover, workers from these communities are likely to hold insecure, low-paid jobs in the sheltered sector, because of their inadequate skills. The cost of living is high, in particular for housing, where rising prices lead to affordability problems for young families (Panel G). Given Israel’s low public civil expenditure (Panel E), the government has played only a limited role in redistributing incomes towards the poor, including among the elderly. Current demographic trends are likely to exacerbate some of these difficulties, because of population ageing and of the growing share of Haredi and Arab-Israelis in the population (Panel H).
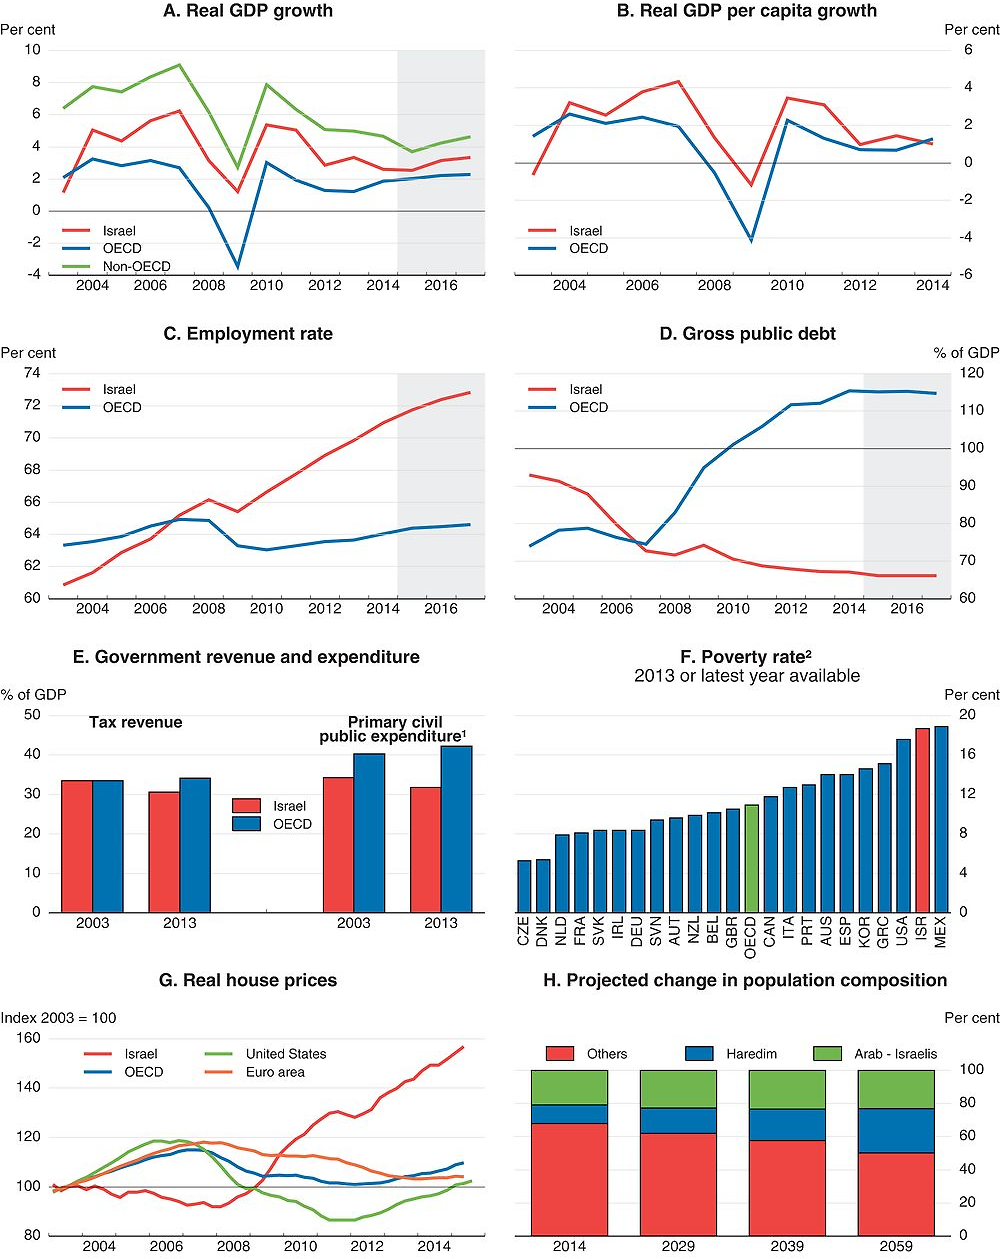
1. OECD is the average of 24 countries for which data are available.
2. Relative to 50% of median disposable income.
Source: OECD, Economic Outlook 98 Database, Housing Prices Database, Revenue Statistics Database and Annual National Accounts Database; OECD (2015), In It Together – Why Less Inequality Benefits All; Central Bureau of Statistics, Demographic projections.
With this background, the main messages from this Survey are:
-
Improving productivity and raising living standards will require strengthening competition and efficiency in the sheltered sector.
-
Enhancing social cohesion would raise sustainable long-term growth. Efforts to promote employment among groups that have only tenuous links to the labour market must be accompanied by further steps to improve their education and training. Additional actions are needed to reduce the cost of housing.
-
Israel has to make fiscal room for fostering more inclusive growth and preparing for the future. Boosting investment in infrastructure, promoting skills, especially of disadvantaged groups, developing adult vocational education and training and enhancing the redistribution system, including for the elderly, are achievable without sacrificing prudent fiscal policy.
The short-term outlook is expected to improve
The subdued growth of the Israeli economy in 2014 has continued in 2015 due to persistent weakness in exports and investment. Poor results on the external front have reflected the combination of low foreign demand from the United States and Europe, which together account for about two-thirds of Israeli exports, and significant losses of external competitiveness caused by the real appreciation of the shekel since 2012. In the first half of 2015, the erosion of export markets was further reinforced by a strike in the chemicals sector (Figure 2). Given this environment, business investment has fallen, inducing a moderate fall in capital stock growth, whose trend progression is being buffered by an ongoing shift of the economy towards services activity (BoI, 2015a). The completion of infrastructure projects in the electricity and railway sectors and the decline in housing purchases caused by the uncertainties surrounding the evolution of real estate taxation in 2014 also weakened capital spending. In this context, private consumption has been the main driver of activity, thanks to the impact of extremely low interest rates on demand for durables and rising household incomes and real wages, which have benefited from favourable labour market conditions and minimum wage hikes.
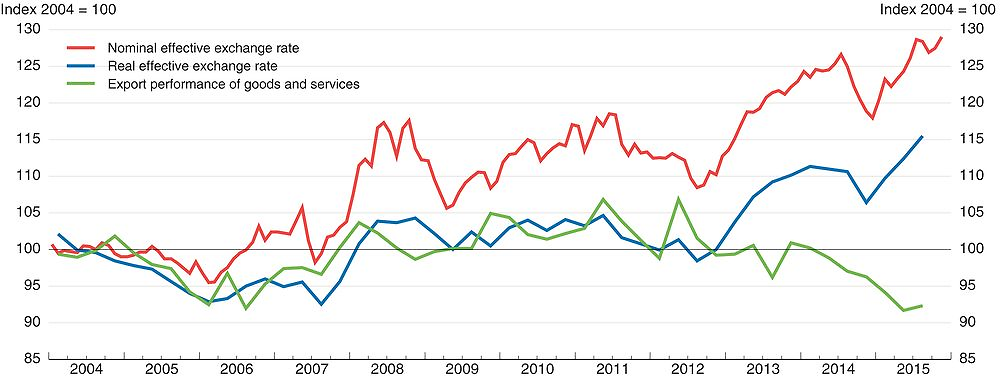
Source: OECD, Economic Outlook Database.
Growth, which reached around 2½ per cent in 2015, is projected to pick up to 3% in 2016 and 3¼ per cent 2017 (Table 1). Ongoing accommodative monetary policy, some fiscal easing in 2016, lower oil prices, a further 14% cumulated increase in the minimum wage in 2016-17, and the expected recovery in foreign markets will all boost demand. Investment should gradually strengthen, helped by the fading of previous uncertainties on property taxation, the government’s plan to stimulate residential construction and the launch of new large-scale projects in the high-tech sector. Unemployment will remain low without sparking inflationary pressures, thanks to the well-functioning labour market (see below). Inflation is projected to edge up to within the official 1-3% target range, once the temporary effects of recent cuts in oil, electricity and water prices have dissipated.
This outlook is subject to significant upside and downside risks. The policy initiative taken in autumn of 2015 to overcome the regulatory obstacles that hampered the development of the gas sector since end-2014 might lead to stronger pick-up of activity. As a small open economy, Israel is dependent on exports, and a more vigorous recovery of the world economy would boost growth and allow the BoI to speed the return of monetary policy to a neutral stance. This process would also be helped by a rise in US interest rates, which would alleviate the upward pressure on the shekel, although the Israeli economy could also be indirectly harmed by possible subsequent turmoil in emerging markets. A deterioration in the external environment – in China and/or Europe, for example – would rein in activity and exacerbate deflationary pressures. For instance, further monetary easing by the European Central Bank responding to renewed euro area weakening would induce a euro depreciation vis-à-vis the shekel, harming Israel’s external competitiveness and in effect tightening monetary conditions. In these circumstances, a new monetary stimulus would have to take account of the effects on the property market. Continued house price rises are indeed adding risks and strains in the economy. In addition, the projected pick-up in growth could be undermined if the tensions with the Palestinians persist or worsen. Potential growth might also slow more than assumed in case of weaker job creation induced by higher minimum wages. Moreover, economic prospects are subject to other significant potential shocks whose effects would be difficult to quantify (Table 2).
Narrowing divides between communities
Israelis are generally more satisfied with their quality of life than residents of almost all other OECD countries; their health outcomes are particularly remarkable (Figure 3, Panels A and B). The country occupies a middling position with respect to employment and income, which together contribute to a good quality of life: Israelis’ relatively low level of income compared to the OECD average is offset by fairly good employment performance, resulting from a high average employment rate and low risk of long-term unemployment. However, well-being related to housing is not very satisfactory. High property prices, together with the large size of the average family, mean that living space per person is limited. There is also significant room for improvement in education, the environment, work-life balance, social cohesion and civic engagement (due to a comparatively underdeveloped culture of public consultation and input for the preparation of laws). Security is lowered by the country’s particular geopolitical situation and the threat of terrorist acts, but other forms of homicide are comparatively rare.
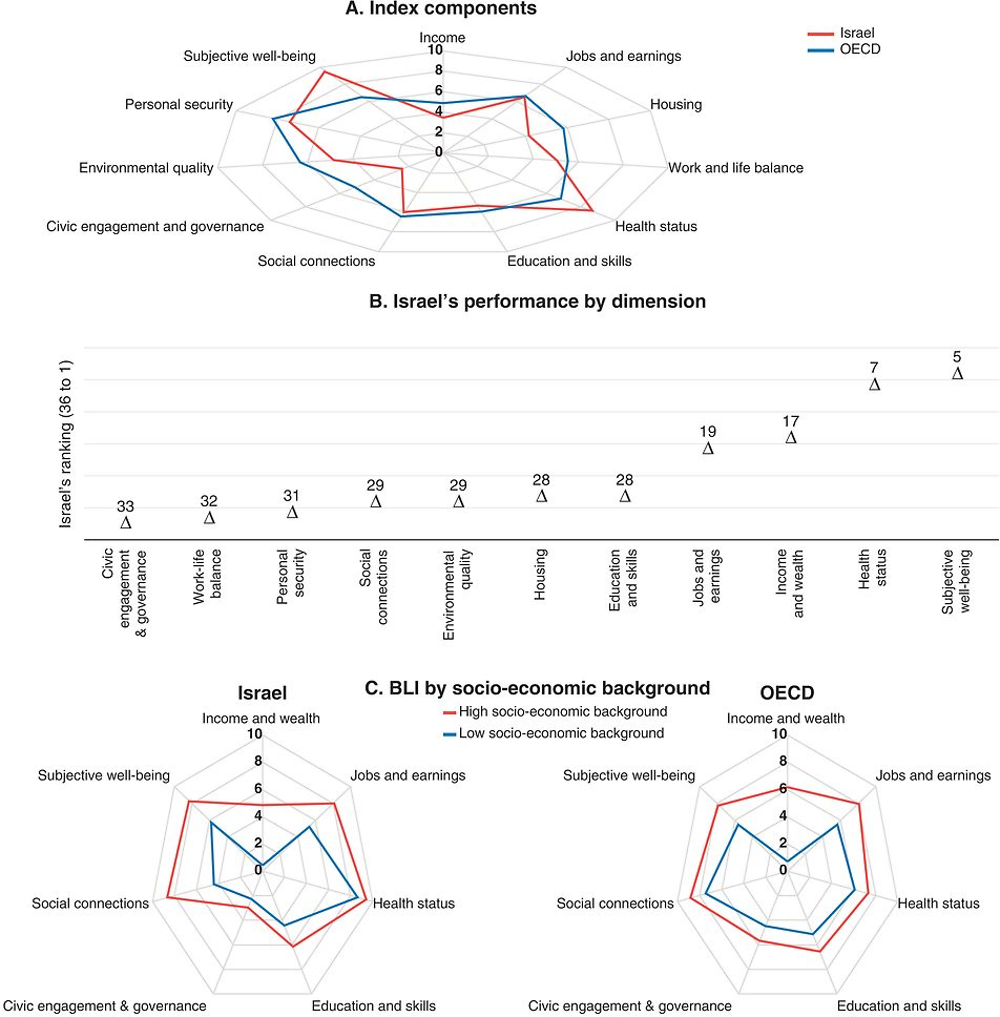
← 1. Each index dimension is measured by one to four indicators from the OECD Better Life Index (BLI) set. Normalised indicators are averaged with equal weights. Indicators are normalised to range between 10 (best) and 0 according to the following formula: (indicator value – minimum value) / (maximum value – minimum value) x 10. The OECD aggregate is weighted by population. Please note that the OECD does not officially rank countries in terms of their BLI performance.
Source: OECD (2015), OECD Better Life Index, www.oecdbetterlifeindex.org.
With the exception of health outcomes, the gap between the well-off and the disadvantaged in most dimensions of well-being is at least as large as the OECD average (Figure 3, Panel C). Inequalities in education and investment in human capital not only reduce opportunities for disadvantaged groups and weaken social mobility but also dampen growth (OECD, 2015a). In addition, there are particularly pronounced gaps when it comes to social connections. This seems symptomatic of the limited linkages between both the Haredim and Arab-Israeli communities and the remaining population, as manifest in spatial segregation and separate schooling, as discussed in previous Economic Surveys. Solid social connections are crucial for many dimensions of well-being and especially for avoiding the risks of poverty.
This risk of poverty is especially pronounced among Haredim and Arab Israelis because of their lower educational attainment and the particularly weak labour market participation of Haredi men and Arab-Israeli women (Chamlou et al., 2011). Among Arab- Israelis, these factors depress several dimensions of well-being (OECD, 2015b). The government’s approval of a NIS 15 billion (1.3% of GDP) five-year plan at end-December to assist the Arab community by improving housing, increasing investment in education, and providing subsidies for public transport is thus extremely welcome. By contrast, Haredim enjoy an unusually high average level of well-being, given their choice to study spiritual matters. Both Haredi and Arab-Israeli labour force participation has been rising, with the support of a number of government policy initiatives, including in the education and labour market areas. The pressures exerted by global economic developments and the growing importance of formal education in guaranteeing a minimum level of economic security are likely to result in further changes in these communities.
The Haredi and Arab-Israeli communities are together projected to account for half the population by 2060 (Figure 1, Panel H), and their integration into society and the workplace will therefore take on increasing importance. For example, Israel’s military service helps to create close social bonds between those who participate, with substantial benefits in terms of integration, employment and incomes (Asali, 2015). But Haredi and Arab-Israelis tend not to serve. A 2014 law requires Haredi men to do military service from 2017, but its enforcement has been weakened by recent amendments to this legislation that postpones its implementation until 2020 and abolishes penalties for those who refuse to do so.
However, the Haredi and Arab-Israeli communities are relatively disconnected from the rest of the population, and many voters are therefore reluctant to accept higher taxes needed to extend welfare programmes and to increase income redistribution (Dahan and Hazan, 2014; Alesina et al., 2001). To promote social cohesion and inclusion the authorities should therefore consider alternatives. One possibility is compulsory civilian service for those who do not perform military service. Currently voluntary national service (Sherut Leumi) allows young people to work in schools, government offices, hospitals, geriatric services, and with teens at risk, disadvantaged communities and many other non-profit organisations. This system provides its participants with similar benefit entitlements as military service (stipends, apartments in cities where they are serving, free bus and train transport, access to social programmes, etc.) and expose participants to different aspects of Israeli society. Making this civilian service mandatory for those who do not serve in the military would help to strengthen social cohesion and could also be used to further improve participants’ education and skills, as is the case for those serving in the army.
Maintaining an expansionary monetary stance and public debt reduction remains appropriate
Monetary policy in a challenging context
The primary objective of Israeli monetary policy is to maintain price stability, defined as consumer price inflation within a range of 1-3% through an inflation-targeting regime, which is an important nominal anchor for wage and price formation. Meeting this objective has been difficult for the BoI over the last two years. Inflation has been declining steadily since the end of 2013, and the overall price level fell by some 0.5% year-over-year in mid-2015 (Figure 4, Panel A). This is only in part due to the falling prices of imports and oil and to temporary factors (one-off reductions in tariffs for water and electricity at end-2014 and early 2015 lowered headline inflation by 0.4 percentage point). Core inflation has also declined, but it seems to have stabilised at around 0.5% year-on-year. Inflation expectations remain reasonably well anchored, although they have been drifting down on some measures.
The BoI has been cutting its policy rate since end-2011, bringing it to a historical low of 0.10% in March 2015 (Figure 4, Panel B), and it has resumed its interventions to limit the upward pressure on the shekel on the foreign exchange market. This came in addition to its currency purchase programme intended to limit appreciation resulting from the “Dutch disease” related to the impact of natural gas production (which began in March 2013) on the balance of payments. Given the very expansionary monetary policies of the major OECD central banks and the uncertain financial developments in the euro area, the BoI needed to act to avoid an undesirable currency appreciation and to dampen excessive fluctuations. This expansionary monetary policy remains appropriate to support activity and exports until inflation moves into the target range and the external environment allows interest rates to increase. In late 2015 the US authorities began to raise their official rates, while the European Central Bank may in contrast move to an even more expansionary position. It is difficult to predict the impact of such a combination on the Israeli economy. In “normal” circumstances this could be expected to impact the exchange rate according to the weights contained in the nominal effective exchange rate (26½ per cent both on the dollar and on the euro). However, in the last “taper tantrum” episode Israel actually experienced capital inflows. If further stimulus should become necessary, the potential side effects on the booming housing market as well as the problems posed by unconventional measures will have to be kept in mind (Rawdanowicz et al, 2013; BoI, 2015b; White 2015).
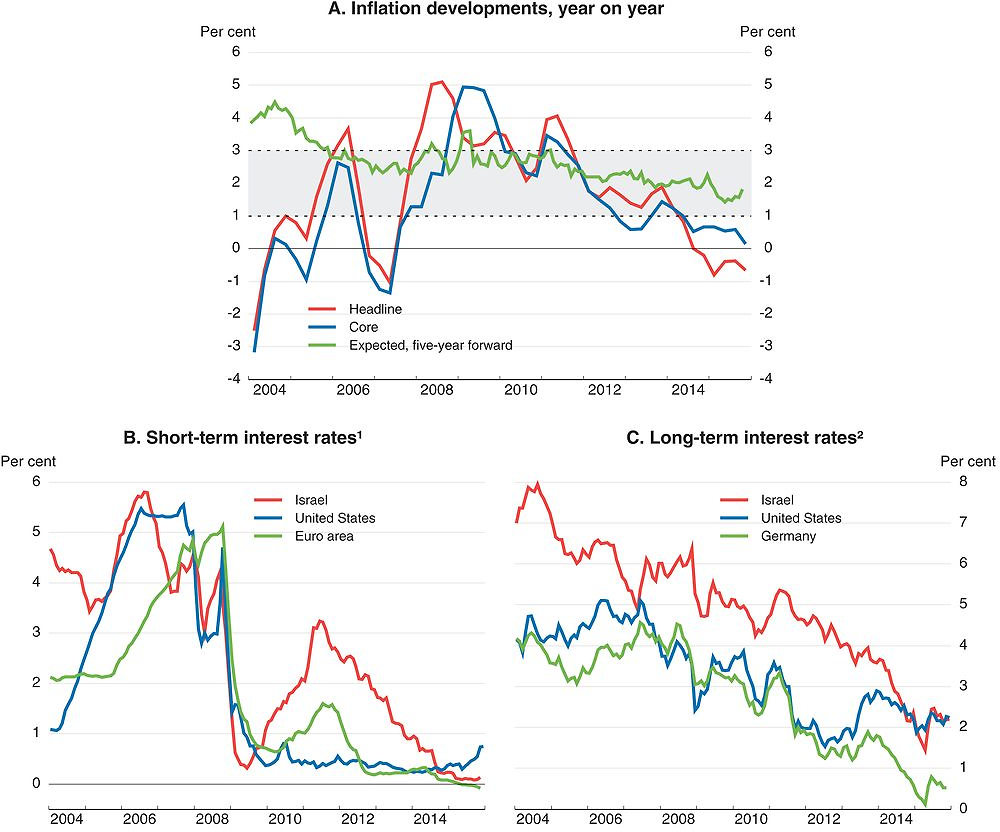
1. Three-month interbank rate.
2. Ten-year government bond rate.
Source: Bank of Israel; OECD, Economic Outlook Database.
Preserving financial stability
Banks’ capitalisation ratios and profitability have remained healthy, and non-performing loans have stayed low (Figure 5, Panels A, B and C). However, the prolonged period of low policy rates has fuelled increases in the prices of financial assets and real estate (BoI, 2015c). Combined with a limited supply response, low interest rates have helped push up real housing prices by some 65% since 2007. Moreover, banks’ exposure to the housing sector increased steadily from 34% to 44% of total loans between 2007 and 2014 (Panel D).
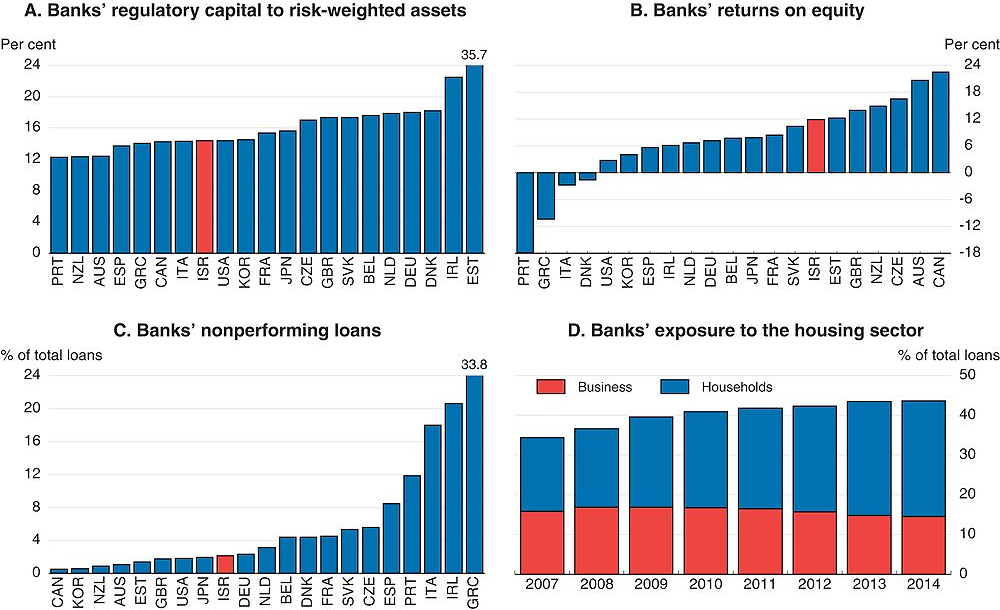
1. 2013 for France and Korea.
Source: IMF, Financial Soundness Indicators Database; Bank of Israel, Information on the Banking Corporations – Credit, Table IV-4.1.
To reduce the risks to financial stability, since 2009 the BoI has adopted macro-prudential measures in terms of both quantitative limitations (e.g. on loan-to-value and debt service-to-income ratios) and restrictions affecting the cost of mortgages for the banks (e.g. supplemental reserve and higher capital requirements). This has reduced the risk characteristics of new housing loans (Figure 6). Recent BoI stress tests, based on a sharp deterioration in the housing sector and severe recession, have emphasised the importance of these macro-prudential measures to ensure banks have the buffers to absorb the large losses that such a shock would entail (BoI, 2015c). The BoI has appropriately indicated that it remains prepared to take further macro-prudential measures in the housing market, if risks to the financial system rise.
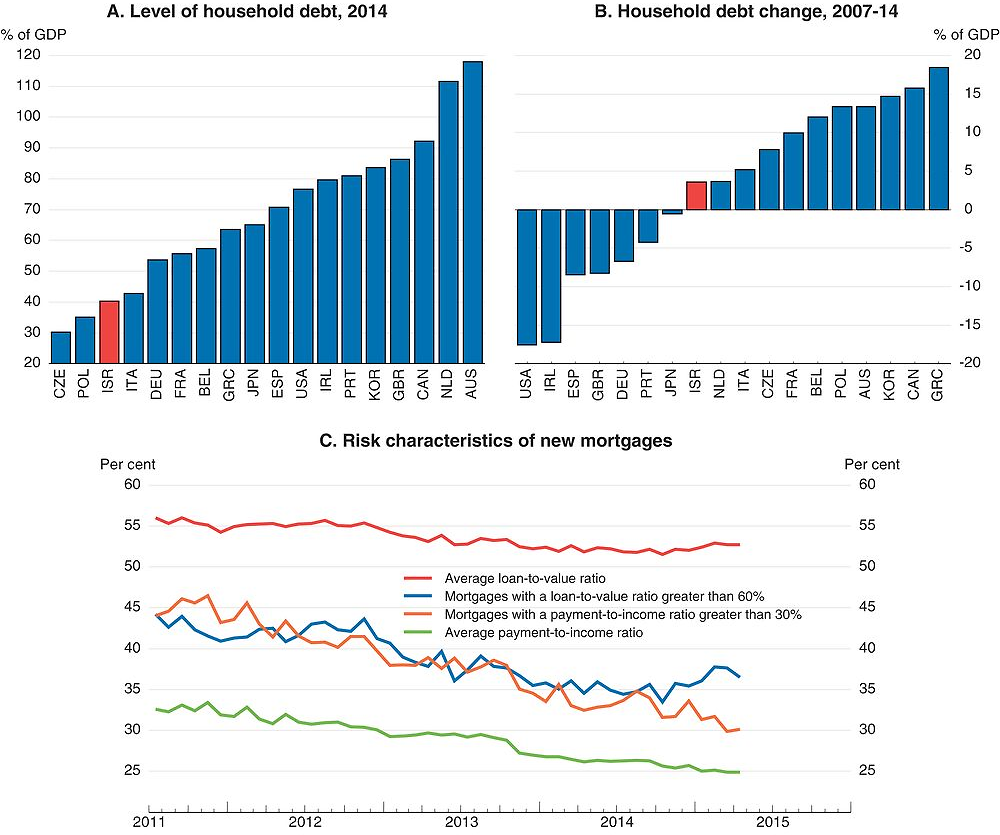
Source: Bank for International Settlements, Credits to Non-Financial Private Sector Statistics; OECD, Economic Outlook Database; Bank of Israel.
Risks extend beyond the housing sector. Corporate bonds accounted for 28% of Israeli business-sector financing at the end of 2013 and may be under-pricing risks because of persistently low interest rates and investors’ search for higher yields: corporate bond spreads over comparable government securities have been fairly low for the past two years (BoI, 2015d). Were the spreads to widen, corporates might face possible shortages of credit and debt-refinancing difficulties. In addition, the emergence of a grey market offering non-institutional financing bringing lenders and borrowers into direct peer-to-peer contact thanks to technological developments may pose new vulnerabilities (BoI, 2015e), although so far this unregulated and unsupervised market is estimated at only 1-2% of GDP.
The authorities have taken several steps to address these issues. They tightened the rules on corporate bonds (discussed in the 2011 Survey). The BoI has also recently requested that banks report more extensively on their non-mortgage credit risks to the household sector, given its rapid increase. In November 2014, an expert committee (the Andorn Committee) recommended improved debt settlement procedures, including early dialogue between a company facing financing difficulties and its bondholders, and reduced uncertainty regarding the legal consequences for firms failing to pay their financial debts on time. Another committee (the Goldschmidt Committee) investigated the direct-loan channel of insurance companies. In April 2014 it recommended establishing criteria for credit review and control, improving information about borrowers and strengthening reporting to the insurance regulator. Parliamentary action on both Committees’ recommendations would be helpful. This should be complemented by an investigation of the peer-to-peer market to assess how it can be regulated and supervised, while finding ways to satisfy the needs that have driven its emergence. To address these issues, coordination among the financial regulators at the BoI, the Ministry of Finance and the Israeli Securities Authority should be strengthened, as recommended in previous Surveys (OECD, 2011 and 2013a).
Adjusting the fiscal framework to better address the nation’s economic and social needs
Fiscal policy in Israel is based on a debt-reduction strategy that has been guided since 2004 by deficit rules and a spending growth ceiling. The spending ceiling has been amended several times (IMF, 2014) and now limits annual spending growth to 2.6% in real terms. The central government deficit target, which complements this expenditure rule, is a multi-annual objective, generally revised by every government. The implicit objective is to lower the debt to 60% of GDP by 2020 and to 50% over the longer term, a level that is consistent with the OECD analysis on prudent debt-level targets estimated for Israel (Fall et al., 2015). This fiscal strategy has led to a remarkable consolidation of the fiscal accounts. Public spending, revenues and debt have fallen by more than in other OECD countries in the last 10 years (Figure 7). Moreover, while up to 2007 government revenues and spending as a share of GDP had been close to or above the OECD average, they are now substantially below it.
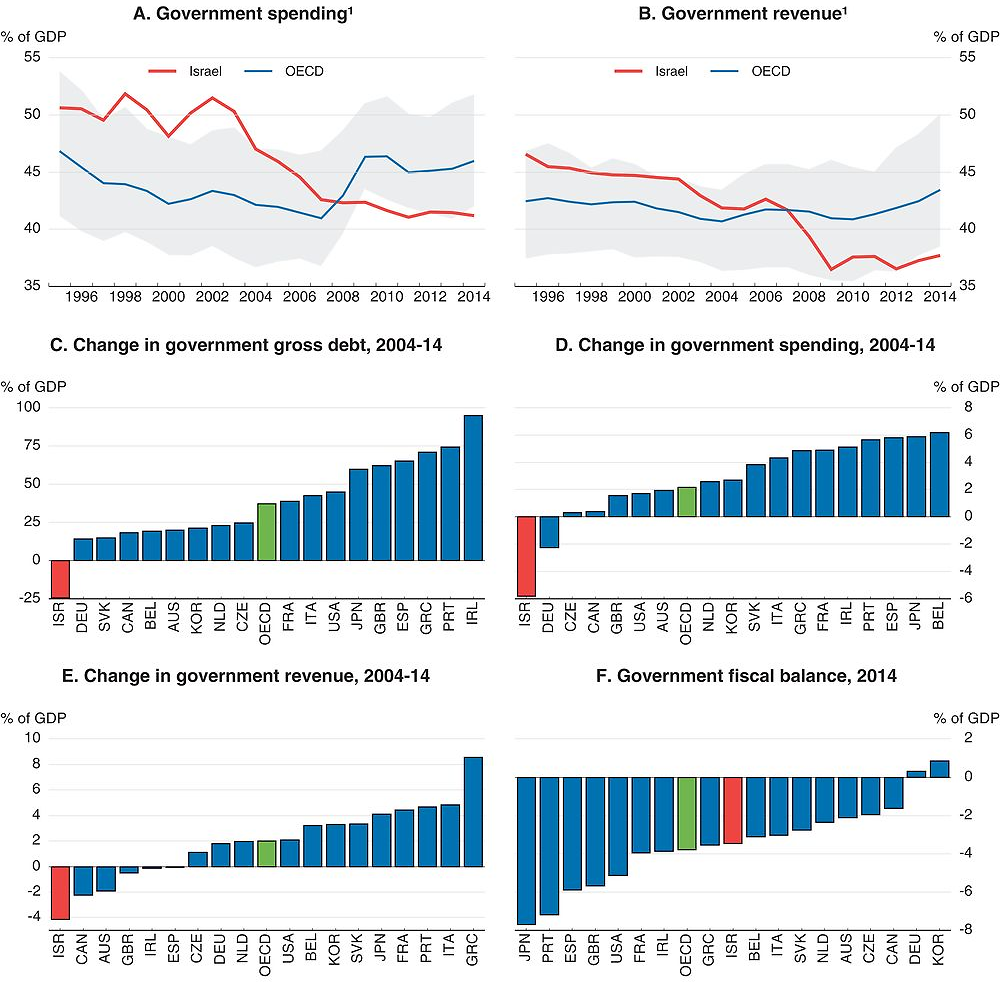
1. The shaded areas in Panels A and B are the 25th to 75th percentile range of available data for OECD countries.
Source: OECD, Economic Outlook Database.
It is, however, increasingly difficult for the authorities to pursue their deficit and debt-reduction objectives on the basis of further spending compression. Following the March 2015 election, spending and deficits for 2015-16 were revised up in the draft budget (Figure 8). Real spending growth in 2015 and 2016 was raised well above the 2.6% ceiling due to increases in education and social expenditure for families, low pensions, housing support, and the pay given to young people doing their military service. In response to stronger-than-expected tax revenue collected since the beginning of 2015, the government also reduced the VAT rate from 18% to 17% in October 2015 (at a cost of 0.4% of GDP) and lowered the corporate income tax (CIT) from 26.5% to 25% (costing 0.1% of GDP) as from January 2016. The resulting higher deficit means that the debt-GDP ratio will probably not fall in the next couple of years. In general, prudence would suggest avoiding using positive revenue surprises to implement discretionary tax cuts and instead to reduce the deficit and the debt. However, should the negative risks surrounding this projection materialise, there would be a strong case for letting the automatic stabilisers operate.
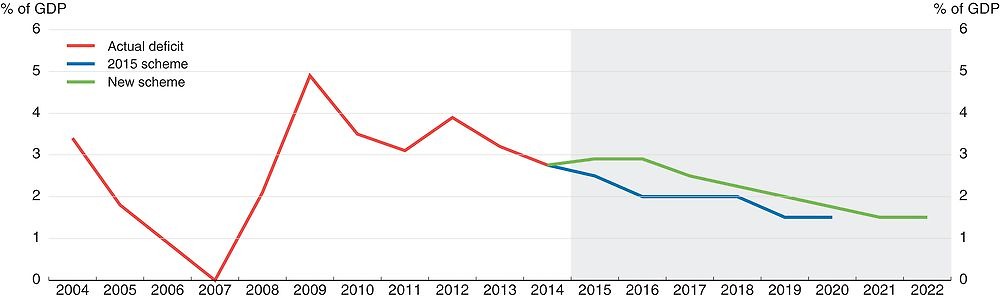
Source: Ministry of Finance.
Better developed medium-term budgetary planning would support the debt-reduction strategy. Given the low level of government receipts, ongoing upward public spending pressures have increased the risk of creative accounting and incentives to overestimate revenues, which would eventually weaken the usefulness of the existing budget rules (BoI, 2015f; Flug, 2015). To limit political interference, in 2012 reporting lines in the Ministry of Finance were adjusted to insulate the forecast from ministerial judgement, with apparently satisfactory results so far. The situation should be monitored, and, should these new procedures securing the independence of the forecast process be put at risk, then the authorities should consider assigning that function to an independent fiscal council, as in some other OECD countries (United Kingdom or Netherlands).
More recently, a draft law accompanying the 2015-16 budget would introduce limits on changes to government financial commitments over a rolling four-year horizon. The government would not be able to make new spending commitments or cut taxes if doing so breached the multi-year expenditure rule or the deficit ceiling. Adoption of such a multi-year mechanism would enhance the transparency of budgetary decisions and thereby strengthen the sustainability of medium-term fiscal objectives and deserves strong support.
The current structural budget deficit is too high to allow a substantial reduction in public indebtedness and thus needs to be better controlled. Given the low level of civil expenditure, deficit reduction should focus on raising additional revenues. Increasing taxes has proved politically difficult. Nevertheless, as suggested in the 2013 Survey (OECD, 2013a), the authorities should favour measures that offer dual benefits, for instance, by prioritising green taxes to combat carbon emissions and congestion. Israel’s commendable efforts to reduce tax evasion must also continue. Removing inefficient tax expenditures is another good way to raise revenues, such as the VAT exemption on fruit and vegetables, which has some positive redistributive effects but should be replaced by instruments, such as the negative income tax, that more efficiently target the poor (OECD, 2014a). Eliminating the tax breaks for company car purchases is another way of boosting revenues that will also have environmental benefits.
Limiting the real growth of government spending to 2.6% per annum, which is below the economy’s estimated trend growth rate of 3-3½ per cent, would continue to shrink public spending’s share in GDP. Spending restraint has improved public finances and macroeconomic results, partly by helping to reduce the government’s long-term borrowing spreads (Brender and Ribon, 2015). But it has also severely constrained civil spending because of the difficulty of compressing military outlays and interest payments on the public debt (Figure 9, Panels A, B and C). This has been particularly damaging to public investment (Panel D) and infrastructure (BoI, 2015a). Public education spending is also lower than in most other OECD countries when measured per student (Panel E), as is welfare spending (Panel F). Given the tight fiscal restraint, renewed efforts are needed to strengthen public spending efficiency. Following the recent review of defence spending by a specialised committee (the Locker Committee), discussions have, for instance, started on possible ways to enhance the effectiveness of such spending. There is also room for efficiency gains in public procurement (see below). To the extent that savings can be made on military outlays and debt service and sufficient revenues raised, civil spending on education, infrastructure and reducing poverty could be increased, and yet still leave a relatively lean public sector.
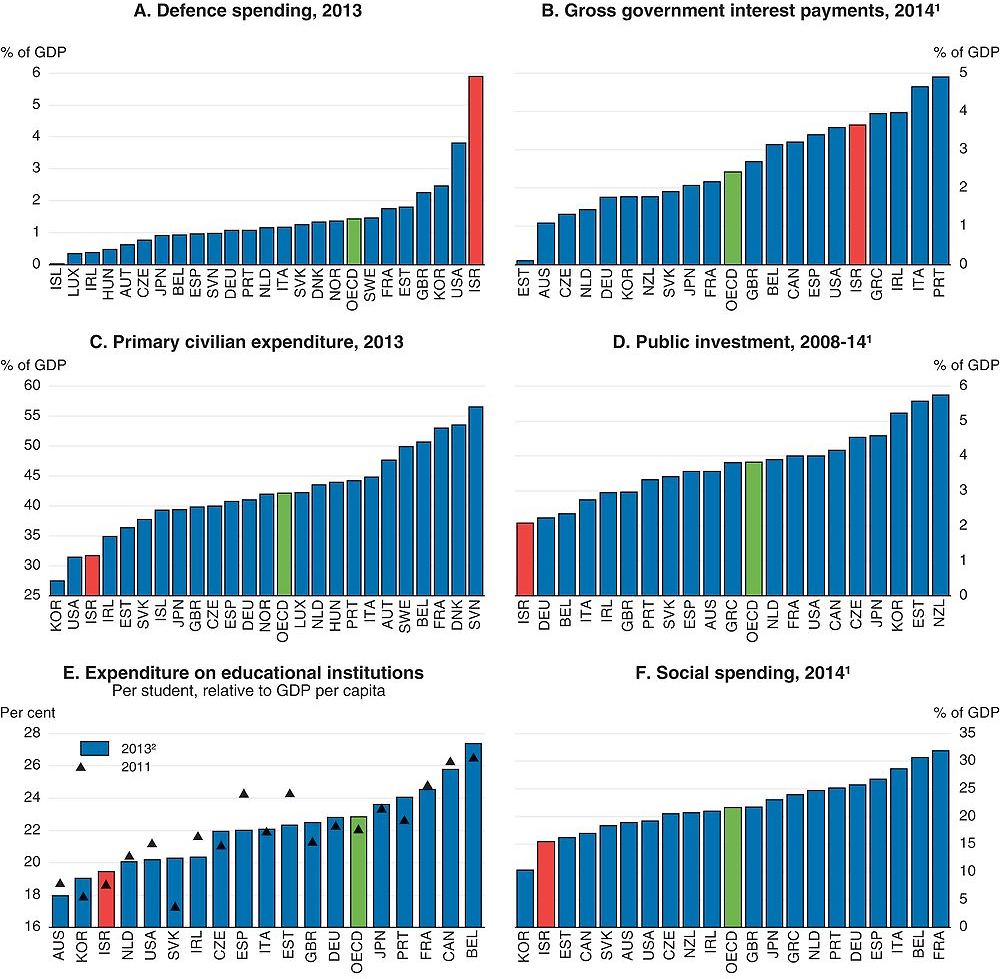
1. Or latest year available.
2. 2012 data for Australia, Canada and Chile and 2014 data for Israel. Data for 2013/2014 for public expenditure on educational institutions are estimated based on the 2013 growth rate of government expenditure on education. The number of students for 2013 is estimated on the basis of the 2010-12 average growth rate of full-time-equivalent students.
Source: OECD (2015), Education at a Glance 2015; OECD, National Accounts Database; Economic Outlook Database; and Social Expenditure Database.
The positive effect for growth and, more broadly, well-being of well-targeted public spending should not be underestimated, as for instance in the case of urban rail transport. Improved infrastructure in this domain would bring benefits in multiple dimensions, starting with a reduction of urban congestion costs, which are estimated at 1.5% of GDP every year (State of Israel, 2012), thanks to lower waste of time and productivity gains (Ben-David, 2013). Faster development in urban public rail transport would also be beneficial for the environment, reducing greenhouse gas emissions and local pollution. Moreover, good and reliable public transport infrastructure would help reduce the housing supply shortage, make it easier to live in lower-price house zones and promote labour market participation for those living in remote regions.
Productivity-enhancing reforms to boost growth and make it more inclusive
Israel’s income gap with leading OECD countries has narrowed over the last decade, mainly reflecting rising employment. However, productivity convergence with the most advanced countries remains slow (Figure 10, Panel A), which is paradoxical, given Israel’s justifiably strong reputation in the domain of innovation. As the one-off benefits of higher employment rates will gradually fade, improving productivity performance is a key policy challenge on which the authorities need to maintain a continuous focus. To address this issue, action is needed on a number of fronts, among which human capital plays a prominent role, especially for disadvantaged groups, as discussed in the 2011 Survey (OECD, 2011). Israel also needs to enhance its transportation infrastructure and product market competition, especially in the domestic-oriented sectors where productivity performance has been lagging over the last 20 years (Panel B). Moreover, lowering barriers protecting markets and promoting best-practice regulation is essential for creating the pressure to invest, innovate and promote the diffusion of knowledge across firms to develop better products and services at lower cost (OECD, 2015c). This requires meticulous and systematic assessment of microeconomic policy settings and regulation through independent, published analysis. In that perspective, the Ministry of Finance’s initiative taken in December 2015 to create a Commission headed by its Director General to recommend measures to increase productivity by 1 April 2016 is very welcome.
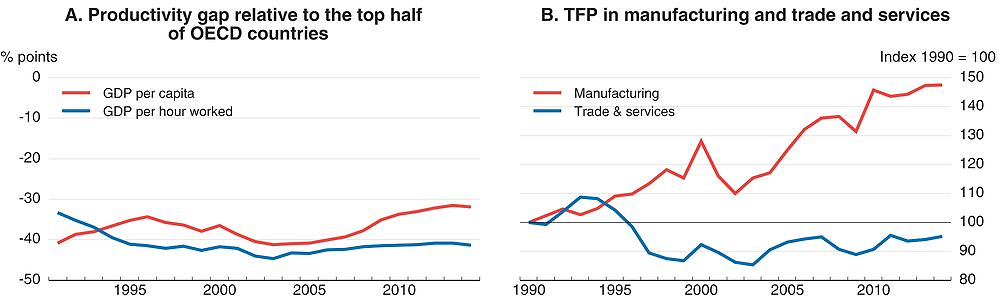
Source: OECD, National Accounts and Productivity Databases; G. Brand (2015), “The Evolvement of the College Wage Premium in the Israeli Labor Market Supply and Demand Factors” (in Hebrew), Milken Institute.
Strengthening competition in the sheltered sectors of the economy
Israeli product markets are characterised by: (i) relatively low foreign trade exposure (Figure 11, Panel A); (ii) oligopolies and monopolies in several markets; and (iii) regulations that are far from best practice (Panel B) – Israel’s indicators of services trade restrictiveness and product market regulation are the most restrictive in the OECD (see below). Progress in absolute terms seems to have been limited until 2013 and, indeed, even most recently, as shown by its decline from 30th to 40th place in the World Bank’s Doing Business ranking between 2008 and 2015.
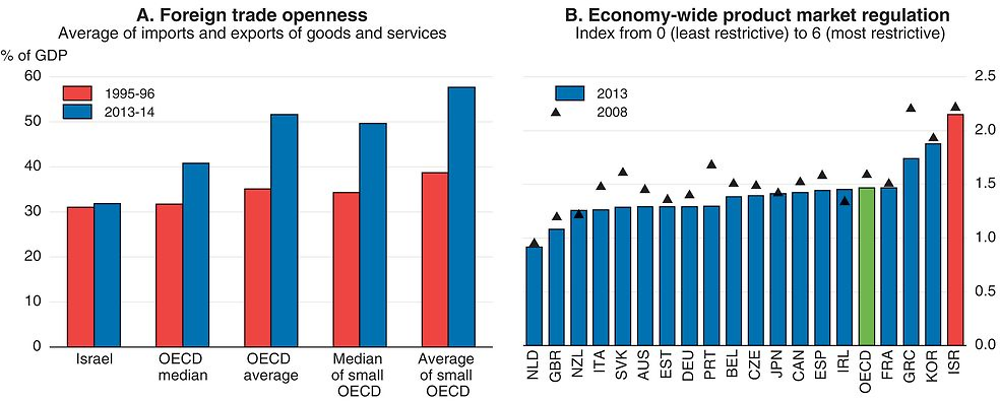
Source: OECD, Economic Outlook and Product Market Regulation Databases.
One of the main challenges of structural reform in Israel is to increase competition and efficiency in the economy’s sheltered sectors: their efficiency relative to exposed sectors is lower than the OECD average (Figure 12, Panel A). The result is low pay for a large proportion of the workforce (Panel B) and, often, high prices, although here factors other than weak competition are also at play (BoI, 2015a). The cost of living is 20% higher than in Spain and 30% higher than in Korea, both of which have similar per capita GDP to Israel (Panel C); price gaps are high compared to the OECD average in some sectors, particularly for food (Panel D). The authorities have launched a series of product-market reforms in recent years, and these efforts need to be maintained and intensified. Moving towards a more business-friendly regulatory environment, as represented by the OECD average, would increase GDP by about 3¾ per cent after 5 years and 5¾ per cent after 10 years, i.e. a growth gain of between ½ and ¾ percentage point per year over the period, according to OECD estimates (see Annex A.2 below), reflecting productivity gains and more well-paid jobs. These estimated effects, which only provide an order of magnitude of the potential benefits of product market reforms, would reflect for the most part (60%) the direct gains generated in each sector by the more business-friendly regulation of the sector itself, while the remainder (40%) would come from induced indirect gains in downstream sectors. While the size of these benefits seems reasonable when compared with those estimated for other OECD countries (Bourlès et al., 2010, Bouis and Duval, 2011; Anderson et al., 2014), they could however be somewhat overestimated because of the likely staggered nature of product market reforms, which are often spread over time even in the case of ambitious reform agendas and thus take time to fully materialise.
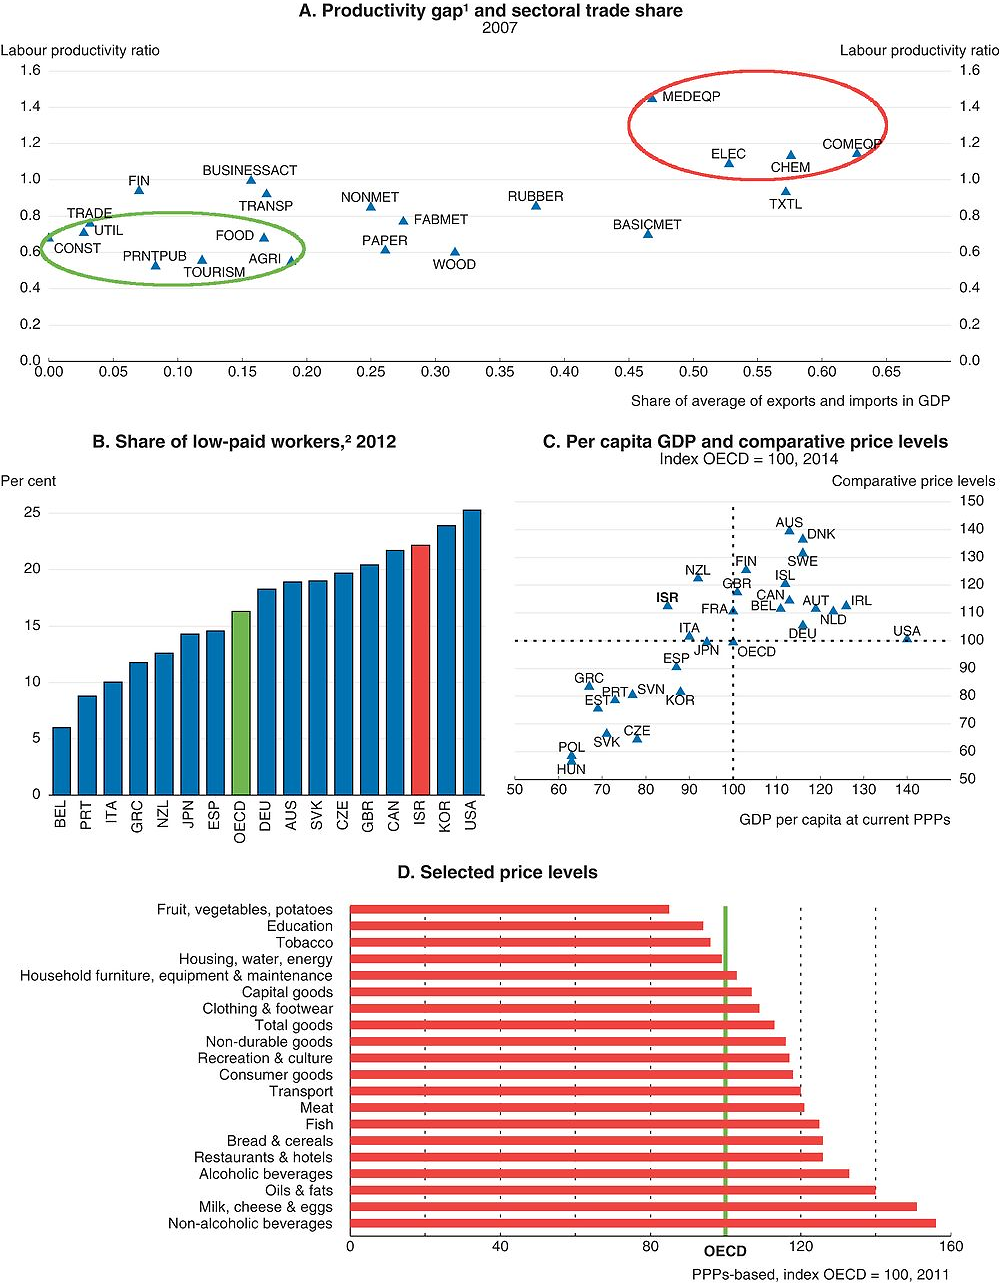
1. Gap between Israel and OECD average. For more details, see Figure 1.5.
2. Defined as workers earning less than two-thirds of median earnings.
Source: OECD (2014), OECD Employment Outlook 2014; OECD, Price and Main Economic Indicators Databases; Central Bureau of Statistics.
Stronger foreign competition is crucial for raising efficiency in sheltered sectors. Customs tariffs are relatively low but could fall further (Figure 13, Panel A). More important would be to reduce non-tariff barriers, which are higher than the OECD average (Panels B-D). In December 2014 the government accepted the recommendations of the Lang Committee to streamline complex and costly import procedures, such as those requiring prior authorisation and compliance with Israeli technical standards, which often differ from international standards. A wide-ranging plan was launched to remove regulatory barriers for importing products concerning all relevant ministries. The authorities should also review the many provisions that constrain the activity of foreign services providers in Israel, such as the 12-month limit on initial entry visas for people working for foreign firms.
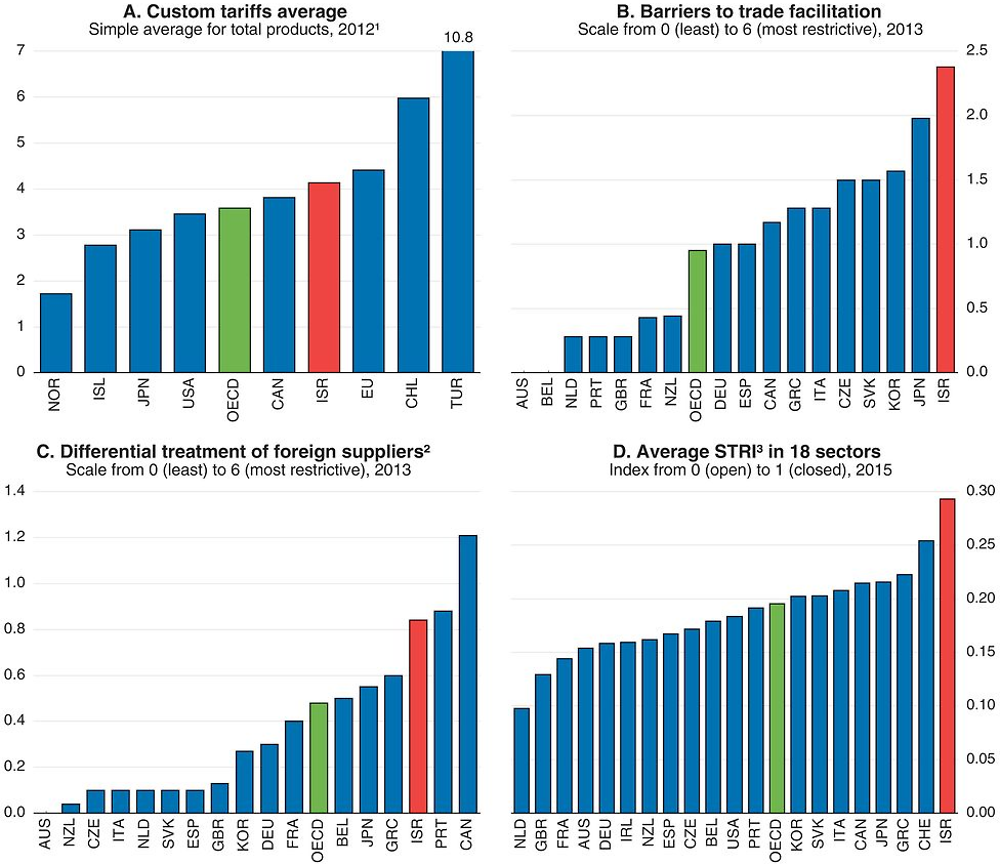
1. 2013 for Turkey.
2. Discrimination against foreign firms in taxes and subsidies, public procurement, entry regulation and appeal procedures.
3. Services trade restrictiveness index.
Source: UNCTAD, Trade Analysis and Information System (TRAINS) Database; OECD, Product Market Regulation Database and Services Trade Restrictiveness Index Database.
High food prices were a key factor in the 2011 social protests, and enhanced competition would lower costs along the entire agri-food chain:
-
Agricultural support has been brought below the OECD average, but distortive interventions – quotas, price guarantees and customs tariffs – still account for over 80% of total agricultural support in Israel, compared to around 20% in the United States and the European Union (OECD, 2014b). Consequently, in 2011-13 domestic production prices were higher than international prices for milk and beef, for example, by 37% and 73%, respectively. Current plans to replace quotas, guaranteed prices and customs tariffs with direct payments to farmers should be implemented, as planned, in goat dairy farming and then extended throughout the sector, even if this would have budgetary consequences.
-
Non-tariff barriers linked to health regulations and difficulties in kosher certification for imports are significant and contribute to higher prices for a number of imported food products (Figure 12, Panel D). The authorities intend to adopt the rules of EU countries for products that present a low health risk. This approach should be extended to “sensitive” products – such as dairy, eggs and meat – which represent over half of all imported foodstuffs, by applying the import procedures in force between EU countries.
-
Concentration is high throughout the whole agri-food value chain. Processing is dominated by two companies that the Israeli Antitrust Authority (IAA) declared to be monopolies in many market segments (Chapter 1). Food retailing, including openings of new stores, is more strictly regulated than in most other OECD countries (Figure 14), and price controls and supervision concern almost 20% of food products in the CPI basket. The authorities should proceed with their recent decision to end the exemption of the poultry sector from anti-monopoly legislation and systematically screen the regulation of other sectors; the OECD Competition Assessment Toolkit provides a methodology for doing so. Existing constraints for opening new shops and the specific restrictions applied to supermarkets should also be eased, and recent provisions adopted to foster local competition in the retail sector should be strictly enforced.
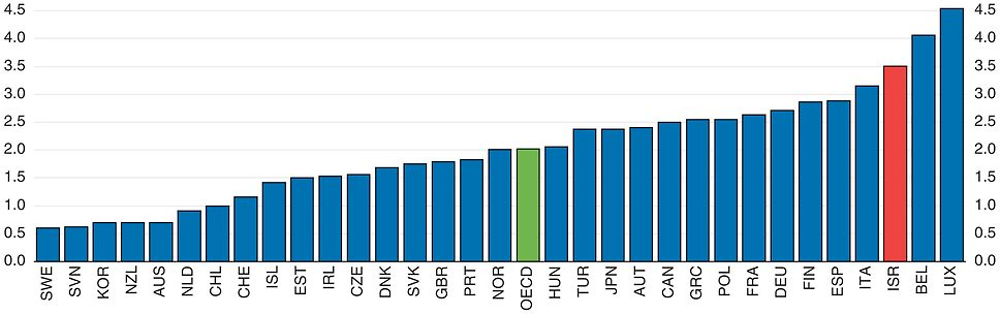
Source: OECD, Product Market Regulation Database.
The effectiveness of government intervention could be improved in a number of domains. For example, the authorities should accelerate the ongoing public procurement reforms that rationalise and standardise procedures, centralise ordering and promote e-procurement. Expanding the use of these new procedures could generate savings of 12-40% (Chapter 1). These reforms should also be extended to local governments. Another target for simplification is environmental authorisation procedures. The government’s commitment to reduce the existing regulatory burden by 25% between 2015 and 2019 and to systematically screen all new laws likely to affect competition as from early 2016 is welcome. High-quality regulatory impact assessments and strong enforcement will be critical to guarantee that the government’s objectives are met at minimum cost.
The banking sector has proved strong and stable despite the volatile and uncertain global environment, but it has an oligopolistic market structure, with the two largest banks controlling 57% of the market. Israeli banks are less efficient than the OECD average, have high operating costs and seem relatively slow to adopt innovation such as online banking (Figure 15). To strengthen competition, in 2013 the authorities embarked on a reform programme based on the recommendations of the Zaken Committee (BoI, 2012).
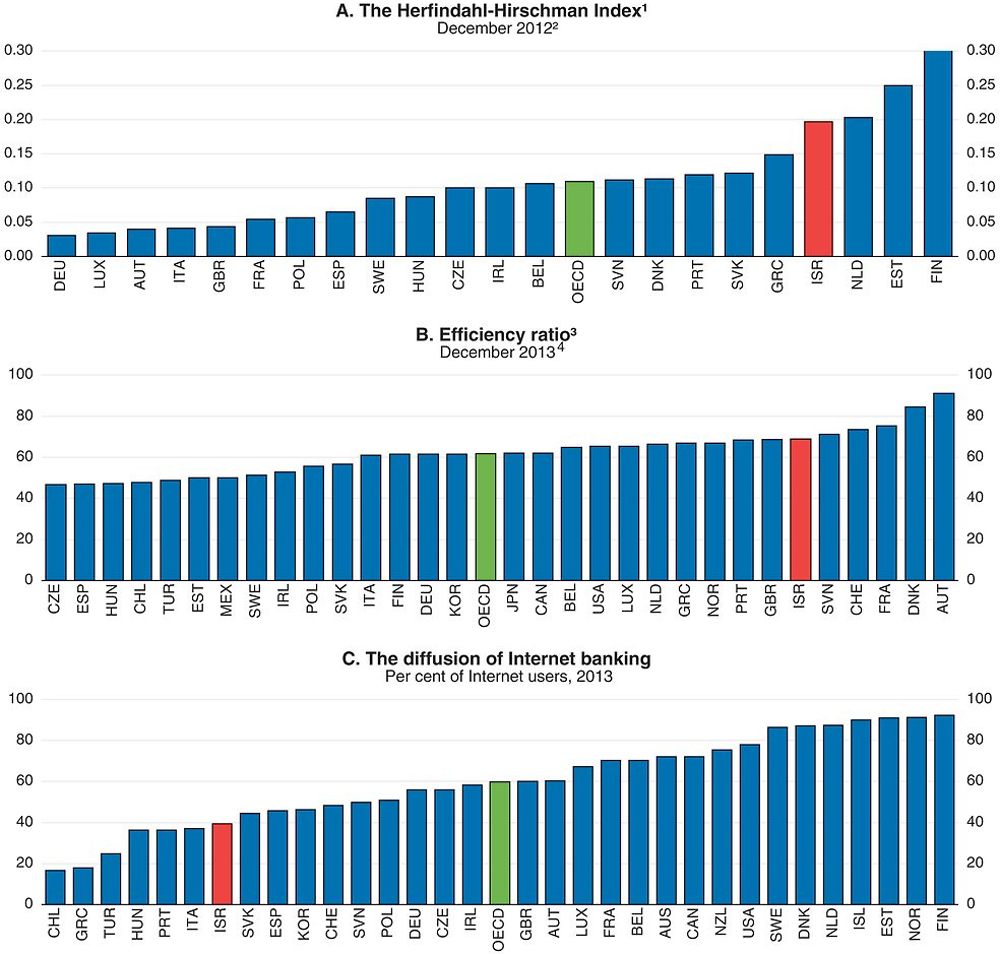
1. The Herfindahl-Hirschman Index (HHI) is a measure of the size of firms in relation to the industry and an indicator of the amount of competition among them. It is defined as the sum of squares of the market shares of the largest firms within the industry, where market shares are expressed as fractions. It can range from 0 to 1. For this chart, the HHI calculation is based on total assets of the commercial banks. For Israel, it is based on the total assets of the commercial banks and does not include activity of foreign banks, while for the other countries data include activity of foreign banks.
2. For Israel, data is for December 2013.
3. Ratio of total operating expenses to total net interest and non-interest income.
4. Or latest available data.
Source: Published financial statements for Israel and European Central Bank for all other countries for the HHI; IMF, Financial Soundness Indicators Database; OECD (2014), Measuring the Digital Economy: A New Perspective and ICT Database; Eurostat, Information Society Statistics and national sources.
Its implementation (by, for example, simplifying the process of changing banks and increasing fee transparency) has yielded initial positive results, such as a large drop in banking fees paid by households (Avissar, 2015). The implementation of other Zaken Committee recommendations, such as encouraging the entry of new competitors, should be speeded up. For example, barriers to entry would be lowered by the creation of a broader, open credit-rating system for households and SMEs to reduce the information handicap faced by new nonbank credit institutions and smaller banks compared to their well-established banking rivals. Additional measures being considered by a another new committee (Strum Committee), set up after the March 2015 elections, include the creation of a deposit insurance system, which would help strengthen the smaller banks, and the entry of institutional and non-banking entities into the retail and SME credit markets. These new lending entities will need to be supervised for prudential and consumer protection reasons. A third committee (Baris Committee) recently defined the regulatory framework for non-banking credit institutions, and the needed legal changes had already been subjected to public consultation prior to the cabinet approval before submission to the Knesset. Another option to boost competition would be to utilise the post office’s current capabilities. Nonbank financial institutions could be allowed to access its extensive network of agencies to distribute credit. Over a longer-term horizon the capacity of the postal bank should be further enhanced in order to allow it to play a more effective role in ensuring effective competition in a wider range of financial services (again, subject to appropriate prudential supervision).
Years of reforms in Israel’s network industries have led to significant price declines in air transport and mobile telephony. The decision to stimulate competition in broadband Internet by unbundling the local loop of the incumbent operators in early 2015 has led to promising results. Measures taken to restructure the public postal services operator, enhance its regulatory framework, widen its management leeway, partially privatise it and open to competition new segments of the market will improve customer services. However, the benefits will be reaped only if an independent regulator can guarantee the neutral and transparent application of this new regulatory framework; the same applies to telecommunications and other network industries (OECD, 2014c). Two new ports are being built at Ashdod and Haifa and will be managed by separate private operators, which should boost competition and efficiency in maritime shipping. It will also be important to modernise the infrastructure of the old ports to enable them to compete with the new players. Moreover, there is room to increase competition in the rail sector, which is still run by a public monopoly.
Necessary changes to the electricity sector were identified as early as in 1996 by the Electricity Sector Law and involved separating generation, transmission and distribution of electricity. But they were not implemented, and the market’s main player remains the Israel Electricity Corporation (IEC), a vertically integrated public company. Renewed reform efforts in 2013-14 were successfully opposed by IEC workers. However, IEC is financially weak (with a debt amounting to more than 2.5 times its annual revenues, or 7% of GDP, at end-2013) and faces the gradual but inevitable emergence of independent power producers and the growth of renewables. IEC reforms, which could be rolled out sequentially, should seek to increase management transparency and to create a holding company structure and then separate electricity generation from the grid (PUA, 2014). Preserving the independence of the regulator in this sector, possibly with a clearer mandate and set of objectives, is also important.
An efficient Israeli Antitrust Authority (IAA) is also crucial for guaranteeing and improving competitive conditions in product markets. In the past few years several reforms have enhanced its effectiveness (GCR, 2014). Since 2011, IAA funding and staff have increased substantially. Since 2012 its director has been able to impose monetary penalties for non-cartel violations, which were rarely punished before, and its competition advocacy role was institutionalised and broadened in 2013. In addition, its enforcement mechanisms, based on its investigators who have far-reaching powers, have demonstrated their effectiveness. Nevertheless, there is still room for further progress, for example, by increasing the maximum fines that can be imposed for competition violations and reforming the leniency programme, which cannot be used, for instance, once an investigation has been opened, even if it might speed up and improve results. Above all, it is essential to avoid a weakening of the IAA following the recent resignation of its director because of the conflict with the government regarding the natural gas sector.
The improvement of the functioning of the gas market, which is dominated by a private monopoly, has raised serious difficulties, which the measures taken by the government are expected to overcome. These difficulties led the Minister of Economy to overrule the IAA director, given the geopolitical importance of developing the existing gas reserves, including for securing export contracts with neighbouring countries, but also because there was limited room in the short term for promoting effective competition due to existing barriers partly related to inadequate infrastructure (such as pipelines and storage facilities). Given these constraints, the measures planned by the authorities aim at avoiding undesirable delays in the development of the largest Israeli gas field. They will regulate and lower the gas price in the local market and facilitate the access of firms to this cheaper and less polluting source of energy. They are also intended to gradually increase competition by attracting new competitors through forced divestment of some gas fields. These measures are welcome. However, to guarantee the emergence of competition, the authorities should ensure that the price controls do not become permanent and that the infrastructure required for an efficient market is properly developed.
Raising the education level of disadvantaged groups
Improving educational outcomes will be central to raising productivity and reducing poverty (Figure 16, Panels A-C). According to the Bank of Israel, increasing the proportion of students with higher education from 48 to 58% would raise per capita GDP by 3% (BoI, 2015g). Making progress in this domain requires raising the educational attainment of Arab and Haredi students who have low levels of formal education. Arab students’ low PISA scores (Panel D) (very few Haredim participated) provide an indication of the substantial challenges involved.
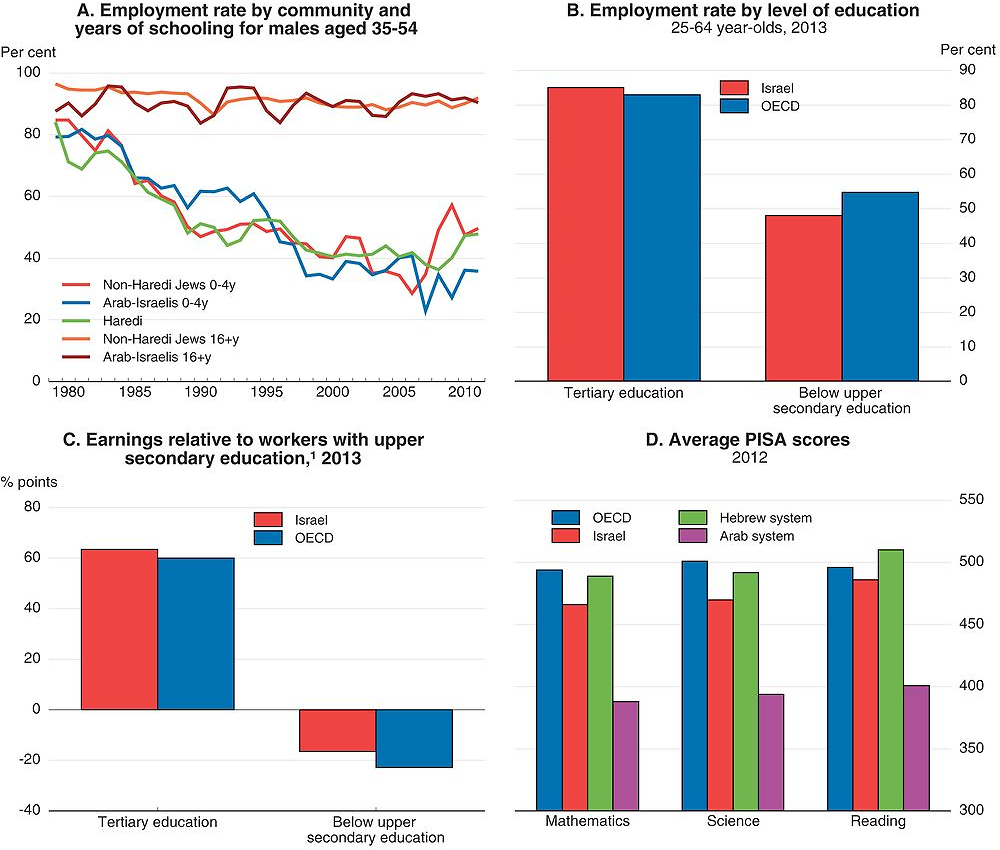
1. Average of men’s and women’s earnings for 25-64 year-olds.
Source: E. Regev (2013), “Education and Employment in the Haredi Sector”, Policy Paper Series, No. 2013.06, Taub Center for Social Policy Studies in Israel; OECD (2015), Education at a Glance 2015; Ministry of Education.
To address this issue the authorities have increased the resources of the education system since 2008 (Figure 17, Panel A) and engaged in a serious reform process, as discussed in the 2013 Survey (OECD, 2013a). Additional resources were targeted at the underprivileged; for example, class sizes in Arab schools were reduced (Panel B). PISA results improved between 2006 and 2012, and national tests show Arab-speaking students are progressing faster than their Hebrew-speaking counterparts (Panels C and D). By contrast, the level of formal education of young Haredim has not increased and is lower than their elders’ (Regev, 2013). The introduction of public funding for Haredi schools conditional on the number of hours of mathematics and English lessons in the curriculum was met with hostility by community leaders, a problem compounded by a lack of textbooks and insufficient numbers of Haredi teachers in these subjects. Notwithstanding these setbacks, the teaching of mathematics, science and foreign languages in Haredi schools is critical to give students the basic skills needed to find jobs.
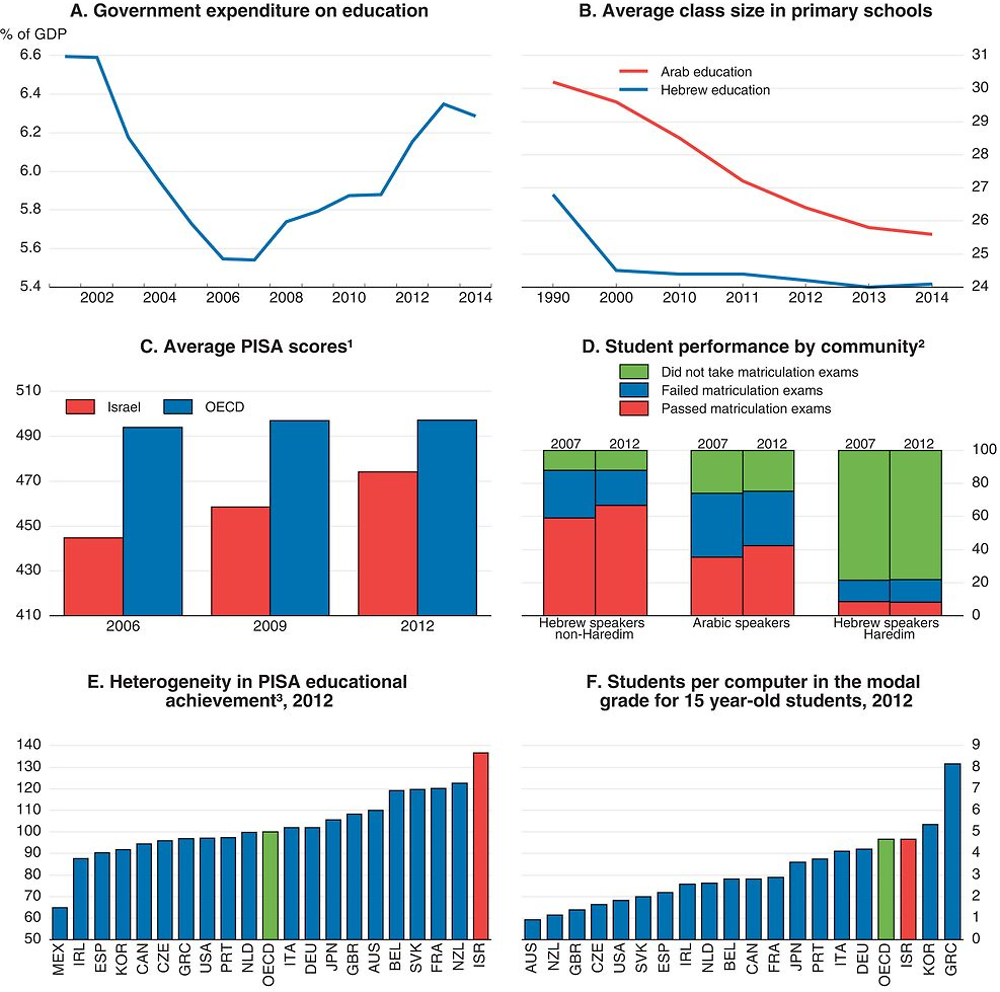
1. Combined scores of mathematics, reading and science assessments.
2. Distribution of 12th-grade age cohort by population group and matriculation status.
3. The heterogeneity is measured by the total variance of students’ results relative to the average PISA scores in mathematics, reading and science.
Source: Central Bureau of Statistics; OECD, National Accounts Database; OECD (2014), PISA 2012 Results: What Students Know and Can Do; OECD (2015), Economic Policy Reforms 2015: Going for Growth; OECD (2015), Students and Computers, Thematic Report, based on PISA 2012 (forthcoming); N. Blass (2014), “Trends in the Development of the Education System”, in State of the Nation Report 2014, Taub Center for Social Policy Studies in Israel.
Despite the increase in the education budget, average public spending per student remains lower than in most other OECD countries (Figure 9, Panel E), and there seems to be insufficient non-teaching resources, such as computers (Figure 17, Panel F). Indeed, with instruction in several languages, multiple curricula and a high number of immigrant children requiring special support, higher spending per student than the OECD average is clearly called for (Dahan and Hazan, 2014). Additional resources seem to be most in need in compulsory education to help more pupils to reach the level necessary to pursue higher education (BoI, 2015g).
These budget increases should be backed up by structural adjustments to maximise their returns. Comparisons of efficiency in the use of existing resources between secondary schools across and within 30 countries suggest that there is much room for efficiency gains in Israel (Agasisti and Zoido, 2015). Ongoing steps to increase schools’ autonomy are welcome, as they should help them adapt to the specific needs of their pupils. But, above all, the government must ensure that all students, including those in the Haredi community, are provided with the basic skills needed to find a job.
To that end vocational education and training (VET) should also be expanded. The 1990s immigration from the former Soviet Union provided a supply of workers well trained in technical fields. But these immigrants are now reaching retirement age and many sectors face an increasing shortage of such workers. There is less vocational provision than in many other OECD countries, funding seems inadequate and declining, and the number of students in the technology stream has fallen since the early 2000s (Musset et al., 2014). The authorities should therefore expand high-quality VET programmes for young adults following their military (or alternative) service, supported by close partnership with industry, and put greater emphasis on work-study programmes. VET could be made more attractive if students’ possible fear of being side-lined were reduced by developing more pathways between vocational and general education, including access to universities, and credit recognition for graduates of practical engineering programmes enhanced (Musset et al., 2014).
Well-designed reforms to promote social cohesion and share the fruits of growth
Better integrating the disadvantaged groups into the labour market
The labour market has continued to perform well in recent years: unemployment is down, including in structural terms (Elkayam and Ilek, 2013), and the employment rate has risen significantly (Figure 18, Panels A and B), generating significant increases in household incomes. Israel has a greater proportion (22%) of low-paid workers (those earning less than two-thirds of median earnings) than the OECD average (16%) (Figure 12, Panel B); they tend to be insufficiently skilled and take menial jobs in the sheltered sector. The supply of qualified and well-paid jobs in the sheltered sector, even for well-trained people, is modest (Brand, 2015). In addition, average real wages have advanced even more modestly than slow-growing productivity since 2003 (Figure 18, Panels C and D), possibly partly because of the rapid increases in labour supply; however, in after-tax terms gains have been larger.
The rising employment rate has not had much of an impact on poverty so far. This may partly reflect the arrival on the market of increasing numbers of low-skilled workers from various backgrounds, including Palestinians and foreign workers, with weak bargaining power at a time when union membership has been in decline (Panel 18, Panel E) and deregulated contractual jobs have expanded (Neuman, 2014). Since 2010 the authorities have increased the number of labour inspectors, investigations and penalties to improve compliance with labour law. The so-called “negative income tax” (or earned income tax credit, EITC), which adds an average 16% to the annual wages of eligible workers – those in the first quintile of the pay distribution – has demonstrated its effectiveness (BoI, 2015h), and the authorities should consider expanding it further. Budgetary resources dedicated to it have risen to 0.1% of GDP in 2015 but are still less than similar programmes in the United States and the United Kingdom (where spending reaches 0.4-0.5% of GDP).
In early 2015, the government endorsed the social partners’ agreement of a 16% increase in the minimum wage, spread over three years from April 2015 and, in November 2015, it agreed to a further 6% hike in the minimum wage for December 2017. This rise could sustain aggregate demand by bolstering the finances of the least paid workers who have a high propensity to spend. It also plays a complementary role to the EITC, which should not become a public subsidy for employers paying sub-standard wages (BoI, 2015a). However, minimum wage increases are not as effective in reducing poverty as the EITC. Such a large rise could reduce profitability and competitiveness, harming business investment and net exports and therefore could threaten employment opportunities for low-skilled workers and youths.
Active labour market policy merits greater public financial support (Figure 18, Panel F). Because of a lack of resources, the public employment service has a very limited set of tools to promote the reintegration of jobseekers on the labour market. Caseloads are very high, and case workers can offer vocational training opportunities to only a small number of jobseekers (OECD, 2013b). The authorities should step up their efforts following pilot projects, such as Employment Circles, which have shown promising results.
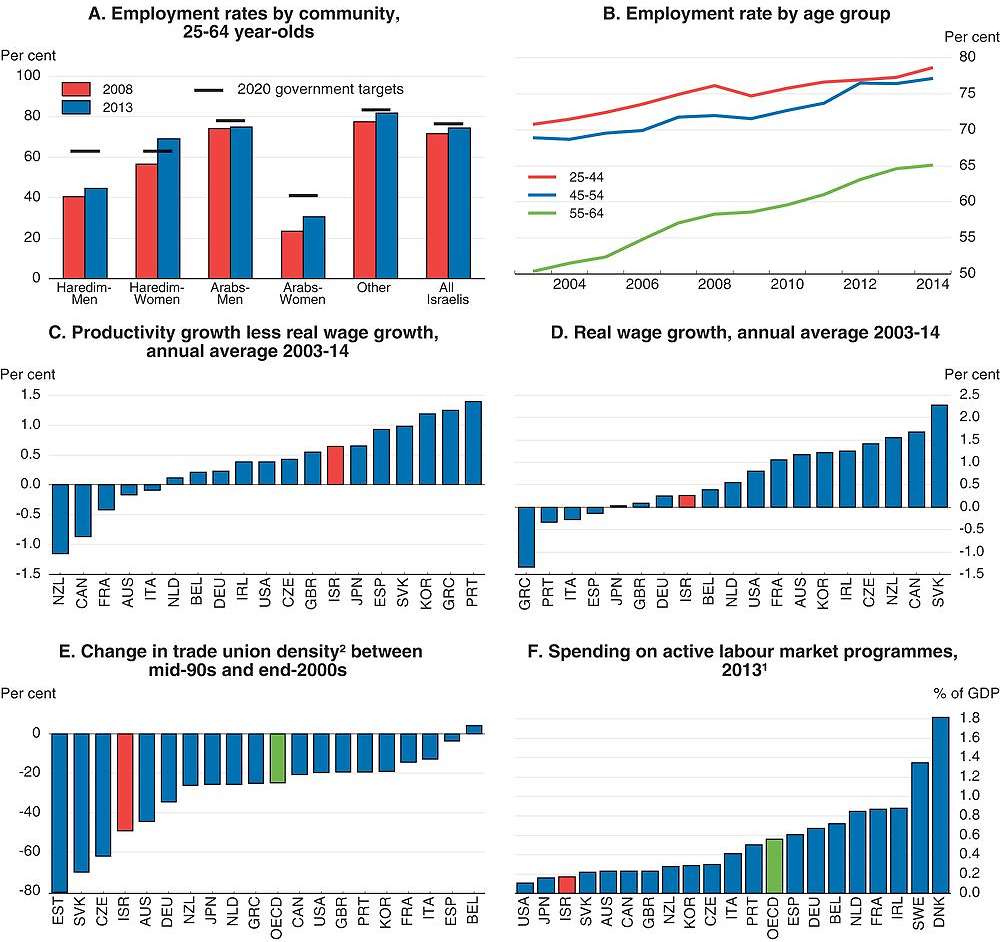
1. Or latest year available.
2. Trade union density corresponds to the ratio of wage and salary earners who are trade union members to the total number of wage and salary earners.
Source: Central Bureau of Statistics, Labour Force Survey; OECD (2014), OECD Employment Outlook 2014; OECD, Economic Outlook and Trade Union Databases.
Improving supply conditions on the housing market
Improving the functioning of the housing market is important for social and well-being reasons, especially for young families. Since 2008, the rise in house prices and rents, measured relative to wages, has been much sharper than in other OECD countries (Figure 19, Panels A and B). This has created an affordability problem, which is more severe for house purchases than rentals (BoI, 2014). The cost of a standard home at end-2013 came to more than 11 years of average pay, three years more than in early 2008 (State Comptroller, 2015). Although international comparisons should be treated with caution, median house prices ranged between 3.5 and 8 times median household income in the United States, Japan, the United Kingdom, Canada, Australia and New Zealand in mid-2013 (Demographia, 2014). Israel has a fairly small stock of social housing, having sold off substantial numbers of units starting in the mid-1980s (BoI, 2015a). Rather, it has chosen what is perceived as a more cost-effective solution in the form of rent subsidies for those on income support.
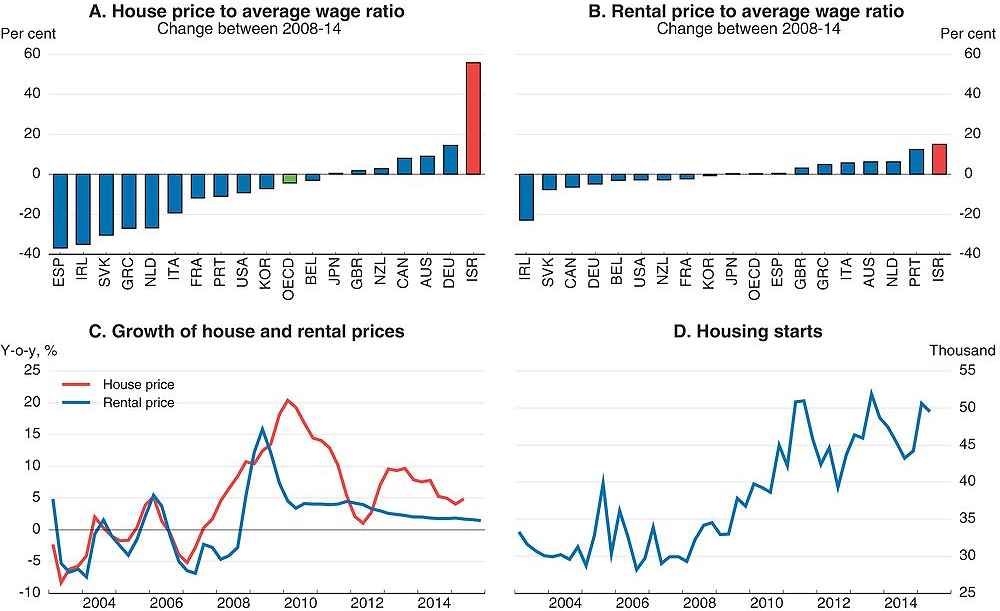
Source: OECD, Economic Outlook Database; Central Bureau of Statistics, Construction Statistics.
Surging prices in Israel have been caused by stagnant supply and growing demand fuelled by the rising number of households and falling interest rates. As mentioned in the 2011 Survey, there is a lack of land in central areas where demand is high, underdeveloped infrastructure in peripheral areas and an urban planning system involving a great many public entities with divergent interests (Hemmings, 2011). Fulfilling the requirements for planning and building a home in Israel takes an average of 13 years (BoI, 2015a), more than twice as long as in other OECD countries like Germany or Sweden (World Bank, 2014; Evans and Hartwitch, 2005).
While the shortfall of the housing stock is difficult to quantify precisely, various analysts put it at over 100 000 units, over two years’ worth of construction, because of the paucity of dwellings built between 2002 and 2010. Since then, the number of new homes constructed has been around 45 000 per year, similar to new household formation (Figure 19, Panels C and D). A number of measures have recently been taken to raise supply. In 2013, a specialised body, the ministerial “housing cabinet”, was created to co-ordinate government policy and eliminate supply bottlenecks. Agreements were signed between central and local governments to reduce barriers to the funding of the infrastructure required for new housing zones. Other pro-development measures include the army’s release of sites in central Israel and an agreed plan to develop intercity road infrastructure.
Building on these initiatives, in 2015 the government decided to bring all public planning entities together under the umbrella of the Ministry of Finance, which is now responsible for the whole supply process. The authorities expect this to shorten the average time required for house planning and building by more than half, to 5.5-6 years. Office space conversion into residential buildings and reclassifying public areas as building land will be facilitated. On the other hand, the tax on property investment was raised from 5-7% to 8-10% in mid-2015, reducing both rental supply and overall demand with an uncertain impact on prices. State subsidies will be granted to develop cheaper forms of housing for young couples purchasing their first apartment, and in 2015-17 the government will sell public land at discounted prices, using a mechanism meant to ensure the lower cost is passed on to home buyers (developers will compete for the lowest bid for the purchase price of apartments). On the other hand, lower house prices will raise demand, monitoring the quality of dwellings may prove challenging, and the revenue lost in the land sales is significant (0.2% of GDP per year). Housing shortages in cities could be relieved by improving urban public transport and the quality of suburban schools to encourage people to live in such zones.
Improving the pension system and the welfare of retirees
Israel has a young population but is entering a period of moderate demographic ageing (Figure 20, Panel A). It is relatively well prepared for this, thanks to the reforms implemented since the mid-1990s, which closed financially unsustainable defined-benefit pension schemes for private and public employees and established a two-pillar pension system, with limited public financing:
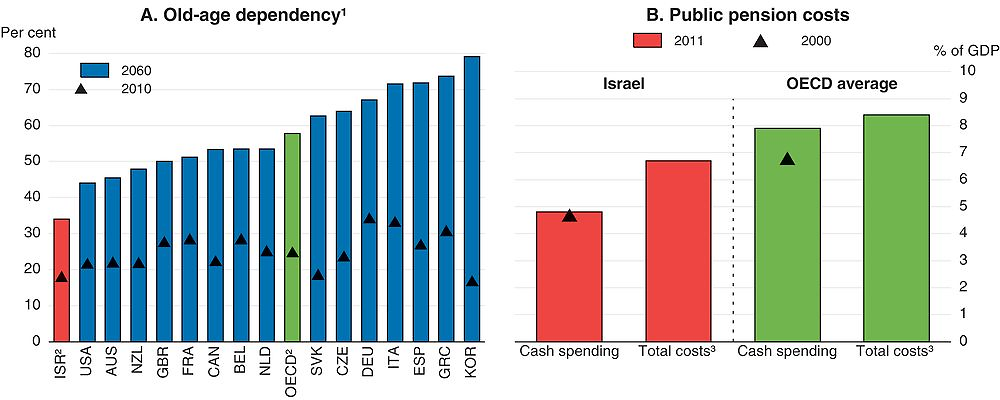
1. Elderly persons (65 and over) as a share of the working-age population (20-64).
2. Medium-term projections for Israel; simple average of member countries for the OECD aggregate.
3. Including tax deductions on contributions for the second-pillar pension funds.
Source: Central Bureau of Statistics (2012); United Nations (2015), World Population Prospects: The 2015 Revision; OECD, Social Expenditure Database and OECD estimates based on data provided by the Ministry of Finance.
-
The first pillar is a modest, publicly funded, defined-benefit pension with quasi-universal coverage, comprising a basic old-age allowance for all beneficiaries and an income supplement subject to strict means testing and other conditions.
-
The second pillar is a system of defined-contribution schemes in which beneficiaries can choose their provider. Since 2008, this second pillar has been a mandatory savings scheme for all workers (up to the level of the average wage), whose contribution rate has risen gradually. This system still benefits from tax incentives, including a non-refundable income tax credit for employees. By contrast, private pensions based on personal savings offer no tax advantages.
Total public spending on pensions, mainly public-sector pensions and first-pillar pensions, is relatively low and has been contained over the last decade (Figure 20, Panel B). Under current law, spending is set to rise by about ½ % of GDP by 2030, but this increase will be almost fully reversed by 2060 as lower public spending on civil servants’ pensions is projected to offset the rising cost of first-pillar pensions (Chapter 2). One option to pay for the pre-2030 increase within this spending domain (it could of course be financed elsewhere on the budget) is to raise the contribution rate of public employees hired before 2002-04, who benefit from a generous scheme and a much lower contribution rate (2% after tax) than for those in the current scheme (5.5%, but tax deductible). Raising this contribution rate would also enhance equity between older and younger public employees. Implementing the recommendations of a recent committee regarding military pensions would also reduce spending.
The replacement rate of first-pillar old-age pensions – the main source of income for around half the elderly who have mostly made only modest contributions to the second pillar before it became mandatory in 2008 – is low (Table 3), even though old-age poverty is more severe than in many other OECD countries (Figure 21, Panel A). Average first-pillar pensions have fallen relative to GDP per capita since the early 2000s, partly as the result of their indexation only to consumer prices since 2005. Catching up for this past erosion of generosity by raising the average basic pension as a proportion of GDP per capita to its 2000-02 average level would cost about NIS 2 billion annually (0.2% of GDP). The 2015-16 budget makes a step in this direction with an uprating of the income supplement by 5-13%, costing NIS 600 million annually. But further adjustment might be warranted, including by relaxing some restrictive conditions for the access to this income supplement, such as not owning an expensive vehicle. The fiscal impact of a more generous income supplement would be temporary. Over time, fewer and fewer retirees are likely to benefit from a more generous income supplement, because it is means-tested and a growing number of retirees will receive a second-pillar pension. However, since the income supplement is available even to those who have never worked, further large increases could also weaken work incentives.
1. Defined as those aged over 65.
2. The poverty threshold is 50% of median disposable income estimated for total households in each country.
3. After taxes and transfers.
Source: Ministry of Finance; OECD (2015), In It Together – Why Less Inequality Benefits All, Annex Table 1.A1.1; OECD, Labour Force Statistics Database; calculations from the OECD Income Distribution Database, www.oecd.org/social/income-distribution-database.htm.
The tax deduction for second-pillar contributions, costing 1.1% of GDP in 2014 (Table 4), was left unchanged when this scheme became mandatory in 2008, although making it mandatory removed the need for a tax incentive, at least for contributions up to the average wage. The incentive is very regressive. More than half its value goes to the top decile of the income distribution (Figure 21, Panel B), whereas the households who earn too little to pay income tax receive nothing at all. To address this issue the authorities plan to lower the tax-free limit on employer contributions from 4 to 2½ times the average wage. While welcome, such a move will not prevent the high mandatory contributions required of all employees regardless of their income, family circumstances or tax position from unbalancing low-income households’ revenue flows over their lifetime. There is thus a case for offsetting more of the impact on net current income of relatively high mandatory contributions to pension savings for low-income workers. The tax advantage on mandatory contributions could be made refundable, although this would come at a fiscal cost. Alternatively, it could be abolished for the mandatory contributions up to the average wage and replaced by a lower contribution rate below this threshold. In any case, measures aiming at addressing the regressive nature of the tax deductibility on contributions to the second pillar will need to be considered in the light of its implications for the progressivity of the tax-transfer system as a whole.
Employment rates of older people have been rising (Figure 21, Panel C), but some features of the pension system still discourage work. The minimum pension eligibility age for women-currently 62 – should be gradually aligned with the male minimum of 67 (Flug, 2014); this matter will be considered in the near future. Extending women’s working lifetimes, and thus the amount of their second-pillar pensions, would reduce the risk of poverty among older women, which is considerably higher than among men (Panel D). The authorities should also index the retirement age to keep constant the share of adult lifetimes expected to be spent in retirement (based on life expectancy at 65). Moreover, the effective marginal tax rate for a pensioner choosing to work without postponing pension receipt is excessively high: 74-97% (for a salary above half the average wage), due to the reduction of the basic allowance, which is means tested for men below 70 and women below 68, the loss of rights to the earned income tax credit and the impact of additional income tax and social contributions paid (Brill, 2014). This substantial disincentive to work should be sharply reduced or eliminated.
Israel’s pension fund management costs do not seem particularly high by international standards, but reducing them by enough to generate an average rise of one percentage point in the net annual return on pension savings schemes would increase pensioners’ assets by 20% after 40 years of contributions (Whitehouse, 2001; Sharpe, 2013). One promising route is the development of passive (indexed) pension funds, which mechanically replicate the average market performance and reduce management fees by as much as 97% in the United States (Bogle, 2014; Edelen et al., 2013). To promote their use the authorities should require that fund managers offer such schemes as the default option. Behavioural economics suggests that this would be effective owing to consumers’ inertia (Lunn, 2014). Moreover, giving preference to a simple choice could mitigate information asymmetries, given the complexity of both the pension system and the underlying financial products. An alternative means to achieve cost savings is for providers to streamline their distribution channels. This could be promoted if all new contracts with pension schemes were automatically awarded to the funds with the lowest management costs, as has been done in Chile and Mexico to strengthen competition in this sector (Ionescu and Robles, 2014).
Strengthening climate change policy
Israel accounts for only 0.2% of the world’s global greenhouse gas (GHG) emissions, and annual emissions per capita are not particularly high and have risen less than GDP per capita since 1990 (Figure 22). Under a business-as-usual (BAU) scenario, these emissions are projected to remain at a level of around 10.0 tonnes (CO2 equivalent) per capita until 2030, implying a level increase of around 27% relative to 2015 because of population growth and economic development.
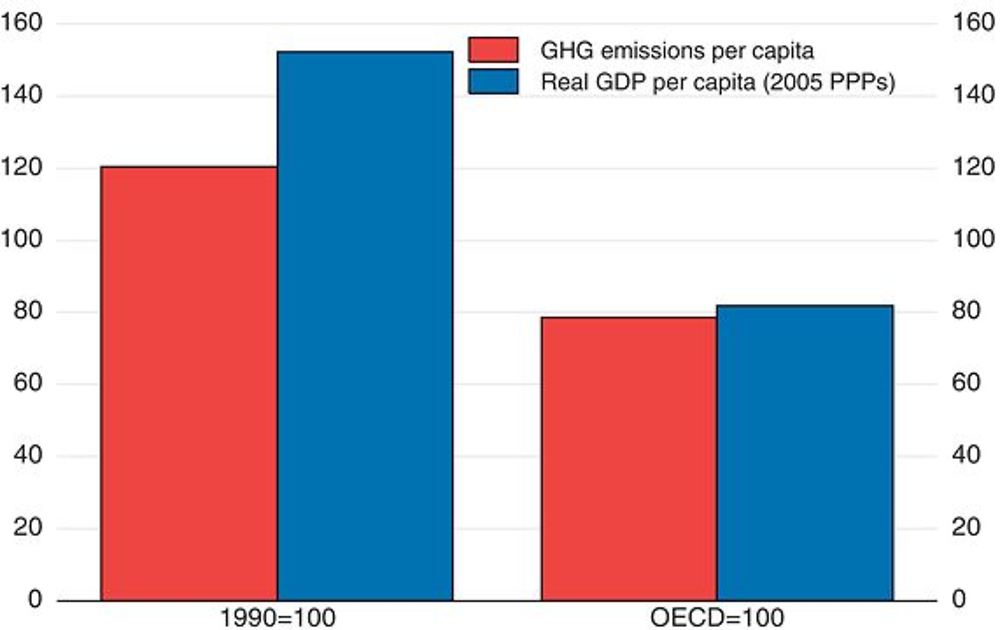
Source: OECD, Environment – GHG Emissions Statistics Database; National Accounts Database; Economic Outlook Database.
Israel ratified the UN Climate Change Convention in 1996 as a non-Annex I country and the Kyoto Protocol in 2004, and in 2010 it committed to reduce its GHG emissions by 20% by 2020 compared to the BAU scenario. In August 2015 the national emissions plan was cancelled, and the authorities focused on the preparation of policy measures and strategic planning for GHG emissions reduction by 2030, which was required for the December 2015 UNFCC climate change conference in Paris.
The objective is to maintain Israel’s emissions target on per capita basis below the OECD average. To this end, the costs and benefits of a list of possible abatement measures have been assessed, and a proposal has been developed for reducing GHG emissions per capita by 26% by 2030 compared to 2015 to 7.7 tonnes (CO2 equivalent), with an increase of the share of electricity generation from renewable sources from 5% now to 17%. A substantial expansion of solar electricity, which is almost the only source of renewable energy in Israel, will be needed. The strategy will also include a national monitoring system to follow up, record and report on its implementation.
As the previous Survey noted, Israel should more fully develop its economic instruments for environmental policy to meet its emissions reduction objectives at minimum cost. The authorities could use the existing levies on primary fuels as a basis for establishing carbon pricing in the form of a carbon tax. Alternatively, if a permit trading system is preferred, then this system should be designed with a view to raising revenues and to making possible participation in international emissions permits trading mechanisms. In the shorter term, greater use should be made of taxes based on kilometres travelled with vehicles rather than ownership, and the tax advantages for business vehicles should be reduced. Finally, faster development of urban public transport would also be desirable, as mentioned above.
Bibliography
Agasisti, T. and P. Zoido (2015), “The Efficiency of Secondary Schools in an International Perspective: Preliminary Results from PISA 2012”, OECD Education Working Papers, No. 117, OECD Publishing, Paris, https://doi.org/10.1787/5js1t53mrdf0-en.
Alesina, A., E. Glaeser and B. Sacerdote (2001), “Why Doesn’t the United States Have a European-Style Welfare State?”, Brookings Papers on Economic Activity, 2:2001, www.brookings.edu/~/media/Projects/BPEA/Fall%202001/2001b_bpea_alesina.PDF.
Anderson, D., B. Barkbu, L. Lusinyan and D. Muir (2014), “Assessing the Gains from Structural Reforms for Jobs and Growth”, Chapter 7 in IMF, Jobs and Growth: Supporting the European Recovery. www.imf.org/external/np/seminars/eng/2014/eurbook/pdf/7.pdf.
Asali, M. (2015), “Compulsory Military Service and Future Earnings: Evidence from a Quasi-Experiment”, IZA Discussion Papers, No. 8892, http://papers.ssrn.com/sol3/papers.cfm?abstract_id=2578244& download=yes.
Avissar, I. (2015), “BoI: Household Current Account Fees Sharply Down”, Globes, 16 July, www.globes.co.il/en/article-boi-household-current-account-fees-sharply-down-1001053902.
Ben-David, D. (2013), “Labour Productivity in Israel”, State of the Nation Report, Taub Center, www.tau.ac.il/~danib/israel/SNR2013-Productivity(Eng).pdf.
Bogle, J. (2014), “The Arithmetic of ‘All-In’ Investment Expenses”, Financial Analysts Journal, Vol. 70, No. 1, CFA Institute, http://johncbogle.com/wordpress/wp-content/uploads/2010/04/FAJ-All-In-Investment-Expenses-Jan-Feb-2014.pdf.
BoI (Bank of Israel) (2012), “Interim Report of the Team to Examine How to Increase Competitiveness in the Banking System”, Summary, https://www.boi.org.il/press/eng/120716/120716du.pdf.
BoI (2014), “Housing Affordability: Home Prices and Rents Across Districts in Israel, 2004-12”, Recent Economic Developments, No. 137, June, www.bankisrael.gov.il/en/NewsAndPublications/RegularPublications/Pages/develop137.aspx.
BoI (2015a), Annual Report – 2014, Jerusalem, www.bankisrael.gov.il/en/NewsAndPublications/RegularPublications/Pages/DochBankIsrael2014.aspx.
BoI (2015b), “Forward Guidance: Experience Accumulated Worldwide”, Recent Economic Developments, No. 138, February, www.bankisrael.gov.il/en/NewsAndPublications/RegularPublications/Research%20Department%20Publications/RecentEconomicDevelopments/develop138e.pdf.
BoI (2015c), The 2014 Survey of Israel’s Banking System, Jerusalem, www.bankisrael.gov.il/en/NewsAndPublications/PressReleases/Pages/24-06-2015-BankingSupervision2014.aspx.
BoI (2015d), Financial Stability Report 2014, December, Jerusalem, www.bankisrael.gov.il/en/NewsAndPublications/RegularPublications/Pages/FinancialStability2014b.aspx.
BoI (2015e), “Remarks by the Governor to the Knesset Economics Committee on the Gray Market”, 15 July, www.bankisrael.gov.il/en/NewsAndPublications/PressReleases/Pages/15-07-2015-GovernorSpeech.aspx.
BoI (2015f), “Fiscal Survey: A Look at the Fiscal Situation ahead of the Preparation of the 2015 Budget, and the Expected Budgetary Trends in the Rest of the Decade”, Recent Economic Developments, No. 138, February, www.bankisrael.gov.il/en/NewsAndPublications/RegularPublications/Research%20Department%20Publications/RecentEconomicDevelopments/develop138e.pdf.
BoI (2015g), “The Connection between the Quality of Education and Growth: Israel Compared to the World”, Recent Economic Developments, No. 139, June, www.boi.org.il/en/NewsAndPublications/PressReleases/Pages/03-06-2015-ResearchEducationQ.aspx.
BoI (2015h), “Report by the Research Team Monitoring the Earned Income Tax Credit Program”, www.bankisrael.gov.il/en/NewsAndPublications/PressReleases/Pages/03-05-2015-Labor.aspx.
Bouis, R. and R. Duval (2011), “Raising potential growth after the crisis. A quantitative assessment of the potential gains from various structural reforms in the OECD area and beyond”, OECD Economics Department Working Papers, No 835. www.oecd-ilibrary.org/fr/economics/raising-potential-growth-after-the-crisis_5kgk9qj18s8n-en.
Bourlès, R., G. Cette, J. Lopez, J. Mairesse and G. Nicoletti (2010), “Do Product Market Regulations in Upstream Sectors Curb Productivity Growth? Panel Data Evidence for OECD Countries”, NBER Working Papers, No. 16520.
Brand, G. (2015), “The Evolvement of the College Wage Premium in the Israeli Labor Market Supply and Demand Factors” (in Hebrew), Milken Institute.
Brender, A. and S. Ribon (2015), “The Effect of Fiscal and Monetary Policies and the Global Economy on Real Yields of Israel Government Bonds”, BoI Discussion Paper, No. 2015.02, January, www.bankisrael.gov.il/he/Research/DocLib/dp201502e.pdf.
Brill, N. (2014), Commission Report on Integration of Elderly to the Labour Market (in Hebrew), October.
Chamlou, N., S. Muzi and H. Ahmed (2011), “Understanding the Determinants of Female Labor Force Participation in the Middle East and North Africa Region: The Role of Education and Social Norms in Amman”, AlmaLaurea Working Paper, No. 31, www2.almalaurea.it/universita/pubblicazioni/wp/pdf/wp31.pdf.
Dahan, M. and M. Hazan (2014), “Priorities in the Israel Budget”, Israel Economic Review, Vol. 11, No. 1, http://papers.ssrn.com/sol3/papers.cfm?abstract_id=2411979.
DellaPergolla, S. (2014), “World Jewish Population 2014”, Berman Institute, North American Jewish Data Bank, University of Connecticut, www.jewishdatabank.org/Studies/downloadFile.cfm?FileID=3257.
Demographia (2014), “10th Demographia International Housing Affordability Survey: 2014”, data for 3rd quarter 2013, www.demographia.com/dhi2014.pdf.
Edelen, R., R. Evans and G. Kadlec (2013), “Shedding Light on ‘Invisible’ Costs: Trading Costs and Mutual Fund Performance”, Financial Analysts Journal, CFA Institute, Vol. 69, No. 1, www.cfapubs.org/doi/abs/10.2469/faj.v69.n1.6.
Elkayam, D. and A. Ilek (2013), “Estimating the NAIRU using both the Phillips and the Beveridge Curves”, Bank of Israel Discussion Paper, No. 2013.10, December, www.boi.org.il/en/Research/DiscussionPapers1/dp1310e.pdf.
Evans, A. W. and O. M. Hartwitch (2005), “Bigger, Better, Faster, and More. Why some countries plan better than others”, Policy Exchange, www.policyexchange.org.uk/publications/category/item/bigger-better-faster-more-why-some-countries-plan-better-than-others.
Fall, F., D. Bloch, J-M. Fournier and P. Hoeller (2015), “Prudent Debt Targets and Fiscal Frameworks”, OECD Economic Policy Paper Series, No. 15, July, OECD Publishing, Paris, www.oecd-ilibrary.org/docserver/download/5jrxtjmmt9f7.pdf?expires=1437159102&id=id&accname=guest&checksum=CF2E91E179073ECC2F32FFD52255A00E.
Flug, K. (2014), “Remarks by Governor Dr. Karnit Flug at the Pensions, Insurance and Financial Literacy Research Center at Ben Gurion University”, www.boi.org.il/en/NewsAndPublications/PressReleases/Pages/20-11-2014-GovernorSpeech.aspx.
Flug, K. (2015), “The Budgetary and Deficit Aggregates”, Speech by the Governor on 2 August, www.boi.org.il/en/NewsAndPublications/PressReleases/Pages/20-11-2014-GovernorSpeech.aspx.
GCR (Global Competition Review) (2014), The Handbook of Competition Enforcement Agencies 2014, http://globalcompetitionreview.com/rating-enforcement.
Hemmings, P. (2011), “How to Improve the Economic Policy Framework for the Housing Market in Israel”, OECD Economics Department Working Papers, No. 912, OECD Publishing, Paris, www.oecdilibrary.org/docserver/download/5kg0sjfjqz9x.pdf?expires=1435162474&id=id&accname=guest&checksum=4080827 AAA2A9C419CBC610FF7E57B83.
IMF (2014), “Fiscal Rules in Israel”, Article IV Selected Issues, January, www.imf.org/external/pubs/ft/scr/2014/cr1448.pdf.
Ionescu, L. and E.A. Robles (2014), “Update of IOPS Work on Fees and Charges”, International Organisation of Pension Supervisors, Working Paper 20 on Effective Pensions Supervision, April, www.iopsweb.org/Working%20Paper%2020%20Update%20on%20IOPS%20Work%20on%20Fees%20and%20Charges%20.pdf.
Lunn, P. (2014), Regulatory Policy and Behavioural Economics, OECD Publishing, Paris, https://doi.org/10.1787/9789264207851-en.
Musset, P., M. Kuczera and S. Field (2014), A Skills Beyond School Review of Israel, OECD Reviews of Vocational Education and Training, OECD Publishing, Paris, https://doi.org/10.1787/9789264210769-en.
Neuman, S. (2014) “Job Quality in Segmented Labour Markets: The Israeli Case”, IZA Discussion Papers, No. 8750, December, http://ftp.iza.org/dp8750.pdf.
OECD (2011), OECD Economic Surveys: Israel, OECD Publishing, Paris, www.oecd-ilibrary.org/economics/oecd-economic-surveys-israel-2011_eco_surveys-isr-2011-en.
OECD (2013a), OECD Economic Surveys: Israel, OECD Publishing, Paris, www.oecd-ilibrary.org/economics/oecd-economic-surveys-israel-2013_eco_surveys-isr-2013-en.
OECD (2013b), Review of Recent Developments and Progress in Labour Market and Social Policy in Israel: Slow Progress Towards a More Inclusive Society, OECD Publishing, Paris, https://doi.org/10.1787/9789264200401-en.
OECD (2014a), The Distributional Effects of Consumption Taxes in OECD Countries, OECD Tax Policy Studies, No. 22, OECD Publishing, Paris, https://doi.org/10.1787/9789264224520-en.
OECD (2014b), Agricultural Policy Monitoring and Evaluation 2014: OECD Countries and Emerging Economies, OECD Publishing, Paris, https://doi.org/10.1787/agr_pol-2014-en.
OECD (2014c), The Governance of Regulators, OECD Best Practice Principles for Regulatory Policy, OECD Publishing, Paris, https://doi.org/10.1787/9789264209015-en.
OECD (2015a), In It Together: Why Less Inequality Benefits All, OECD Publishing, Paris, https://doi.org/10.1787/9789264235120-en.
OECD (2015b), Measuring Well-being in Israel, OECD Publishing, Paris, forthcoming.
OECD (2015c), The Future of Productivity, OECD Publishing, Paris, www.oecd.org/eco/growth/OECD-2015-The-future-of-productivity-book.pdf.
PUA (Public Utilities Authority) (2014), “The Response of the Electricity Authority to the Recommendations of the Steering Committee for Examination of the Electricity Reform “, English translation of a letter of the Chairwoman of the Public Utilities Authority – Electricity, June 12.
RAND (2015), “The Costs of the Israeli-Palestinian conflict”, The Costs-of-Conflict Team, Rand Corporation. www.rand.org/content/dam/rand/pubs/research_reports/RR700/RR740/RAND_RR740.pdf.
Rawdanowicz, Ł., R. Bouis and S. Watanabe (2013), “The Benefits and Costs of Highly Expansionary Monetary Policy”, OECD Economics Department Working Papers, No. 1082, OECD Publishing, Paris, https://doi.org/10.1787/5k41zq8lwj9v-en.
Regev, E. (2013), “Education and Employment in the Haredi sector”, Policy Paper Series, No. 2013.06, Taub Center for Social Policy Studies in Israel, http://taubcenter.illuminea-dev.com/wp-content/files_mf/edu_emp_haredimtaubcenter.org.il_tauborgilwp_wpcontent_uploads_e2013.06haredim3.pdf.
Sharpe, W. (2013), “The Arithmetic of Investment Expenses”, Financial Analysts Journal, Vol. 69, No. 2, CFA Institute, www.cfapubs.org/doi/pdf/10.2469/faj.v69.n2.2.
State Comptroller (2015), “Audit Report on the Housing Crisis” (in Hebrew), www.mevaker.gov.il/he/Reports/Report_279/f43ab2c3-db98-447c-8e49-8b3977bc660d/003-diur-1-new.pdf.
State of Israel (2012), “Public Transport Development: Strategic Plan” (in Hebrew), Ministry of Finance and Ministry of Transportation, National Infrastructure, and Road Safety, December.
White, W. (2015), “The Road to Nowhere”, interview for Hindsight Letters, March, www.zerohedge.com/news/2015-03-24/belief-european-qe-will-work-far-fetched-bill-white-warns-will-end-very-badly.
Whitehouse, E. (2001), “Administrative Charges for Funded Pensions: Comparison and Assessment of 13 Countries”, in OECD Private Pension Systems: Administrative Costs and Reforms, Private Pensions Series, OECD Publishing, Paris, www.oecd.org/finance/private-pensions/1816104.pdf.
World Bank (2014), “Sweden’s Business Climate. Opportunities for Entrepreneurs through Improved Regulation”, www.doingbusiness.org/~/media/GIAWB/Doing%20Business/Documents/Miscellaneous/DB-Sweden-Report-2014.pdf.
← 1. The statistical data for Israel are supplied by and under the responsibility of the relevant Israeli authorities. The use of such data by the OECD is without prejudice to the status of the Golan Heights, East Jerusalem and Israeli settlements in the West Bank under the terms of international law.