
2. Number of Indonesian emigrants and their socio-demographic characteristics
This chapter provides an overview of the number of Indonesian emigrants living in OECD countries and selected non-OECD economies and its evolution since the beginning of the 2000s. The chapter further discusses their socio-demographic characteristics – gender, educational attainment, and citizenship status, across destination countries. Emigrants from the Association of Southeast Asian Nations (ASEAN) and the foreign-born populations living in OECD countries are used as comparison groups. The regional distribution of Indonesian emigrants in the main OECD destination countries is also presented. This chapter shows that Indonesian emigrants’ socio-demographic characteristics vary greatly across destination countries, reflecting diverse migration patterns and processes of migration.
Indonesian emigrants’ socio-demographic characteristics vary significantly across destination countries.
Two-thirds of the Indonesian emigrant population are concentrated in Saudi Arabia and Malaysia. Only 11% reside in OECD countries.
About 377 000 Indonesian emigrants live in OECD countries in 2015, the Netherlands, the United States, Australia, Japan, and Korea being the main destinations.
A sizable Indonesian emigrant population resides in Chinese Taipei, which almost tripled in two decades.
In 2015, 56% of Indonesian emigrants living in OECD countries were women. While share of women was quite high in the Netherlands (56%), the United States (58%), and Australia (57%), there were more male migrants in Korea (91%) and in Japan (65%). However, in other destination economies such as Hong Kong (China), Singapore, and Chinese Taipei, the share of women among Indonesian emigrants was very high.
Two-thirds of Indonesian emigrants in OECD countries are of working age between 15 and 65 and 15% of them have been living in their host country for less than five years. However, in the Netherlands, almost 95% of the Indonesian emigrant population resided longer than 10 years, while a significant share of Indonesian emigrants living in Germany and Hong Kong (China) resided for relatively a shorter period.
Indonesian emigrants are positively selected in terms of educational attainment and their level of education has increased in recent decades, especially in the United States and Australia. However, Indonesian emigrants are still less educated than the overall foreign-born population.
The share of host country citizenship holders among Indonesian emigrants in OECD countries is 62%, however, Indonesians’ observed naturalisation patterns vary across the main destination countries.
In 2015, Indonesia had an emigration rate (to the OECD area) of 0.2%, the lowest among the ASEAN countries.
About 377 000 Indonesian emigrants live in OECD countries
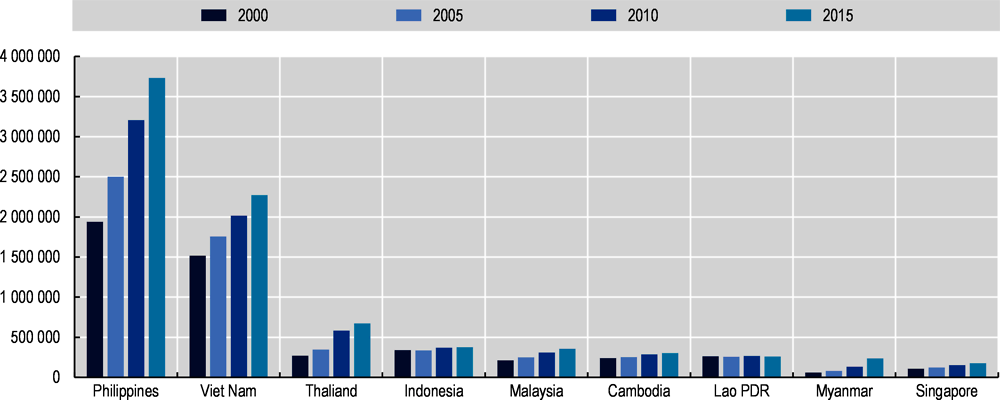
The most recent available data indicate that around 377 000 Indonesian emigrants resided in OECD countries in 2015 (Figure 2.1). It is the fourth largest emigrant population in OECD countries from Association of Southeast Asian Nations (ASEAN) countries, after the Philippines (3.7 million emigrants), Viet Nam (2.3 million emigrants), and Thailand (670 000 migrants).
The growth rate of the number of Indonesian emigrants in OECD countries is, however, much lower than that of all other ASEAN member countries except for Lao People’s Democratic Republic, the only country which experienced declines. The number of Indonesian emigrants grew only by 11% from about 340 000 in 2000 to about 370 000 in 2015, well below the growth rates of the migrant populations from the Philippines (93%), Viet Nam (50%), Thailand (148%), and Malaysia (67%).
Yet Indonesian’s emigration to OECD countries provides a partial picture of Indonesia’s migration trends as the vast majority of Indonesian labour migrants, particularly women working in the domestic or service sectors, reside in the Middle East and neighbouring Asian countries: Malaysia, Singapore, Hong Kong (China), Chinese Taipei, Saudi Arabia, Kuwait, and the United Arab Emirates (IOM, 2010[1]).
This report about emigrants from Indonesia specifically looks at people born in Indonesia and living abroad, especially in OECD countries. In particular, questions related to the children of emigrants born in host countries are not addressed because data on this group exist only in some OECD countries. While it is true that the broader diaspora, including children of emigrants born in host countries, can contribute significantly to the economic and social development of the origin country, data limitations make it challenging to enumerate them consistently and obtain information about their socio-economic characteristics across OECD countries.
In 2020, two-thirds of the Indonesian emigrant population globally were concentrated in Saudi Arabia and Malaysia
Indonesia is the fourth most populous in the world and has the second-largest migrant worker population in Southeast Asia. The amount of remittances sent statistics in 2020 – approximately USD 9.7 billion show their contributions in the economic development.
UNDESA estimates indicate that about 4.6 million Indonesian emigrants lived abroad in 2020 (Figure 2.2). Among them, 11% reside in OECD countries. The main OECD destination countries of people born in Indonesia are the Netherlands (118 000 emigrants), the United States (106 000), Australia (89 000), Japan (57 000), Korea (50 000), Germany (22 000), and Canada (21 000).
According to these estimates, about two-thirds of all Indonesian emigrants are concentrated in just two destination countries – Saudi Arabia (1.7 million) and Malaysia (1.2 million), which can be explained partly by religious or cultural and geographical proximity. As discussed in Chapter 1, these two countries have been consistently among the most popular destinations of Indonesian labour migrants, except during periods when the Indonesian Government banned recruitment for employment in those countries (Missbach and Palmer, 2018[2]).
The other main destination countries for Indonesian emigrants in the Middle East were UAE (320 000 emigrants), Kuwait (108 000), Oman (75 000), Qatar (44 000), Bahrain (34 000), and Jordan (19 000). In neighbouring Eastern and South-Eastern Asia, the main destinations of Indonesian emigrants were Chinese Taipei (254 000), Singapore (160 000), Bangladesh (150 000), and Hong Kong (China) (140 000).
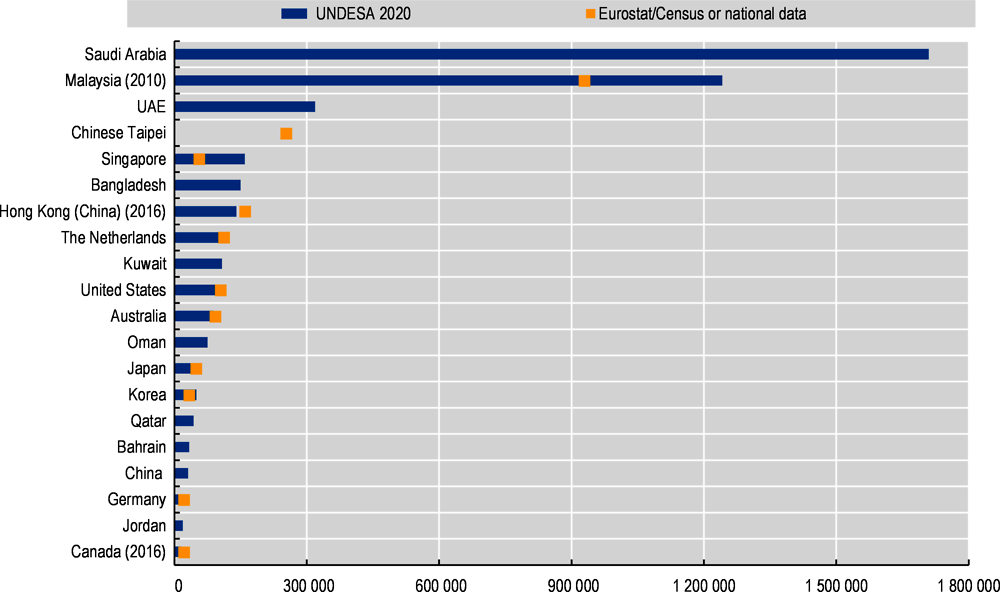
Note: Data from national statistical offices in destination economies come from censuses or registries. In Chinese Taipei, Hong Kong (China), Japan, and Korea, the Indonesian emigrant population is estimated by country of nationality, not the country of birth; in Germany, it is estimated by country of citizenship.
Source: UN DESA (2020), Malaysian Census (2010), Chinese Taipei National Immigration Agency (2020), Singapore Census of Population (2020), Hong Kong (China) By-census (2016), Eurostat (2020), American Community Survey (2020), Australian Bureau of Statistics, Estimated Resident Population (ERP) data (2020), Japanese Population Census (2020), Korean Immigration and Foreign Residents Statistics (2020), German Central Registry for Foreigners (2020), Canadian Census (2016).
The Netherlands, the United States, and Australia are preferred destinations for Indonesian emigrants within OECD countries
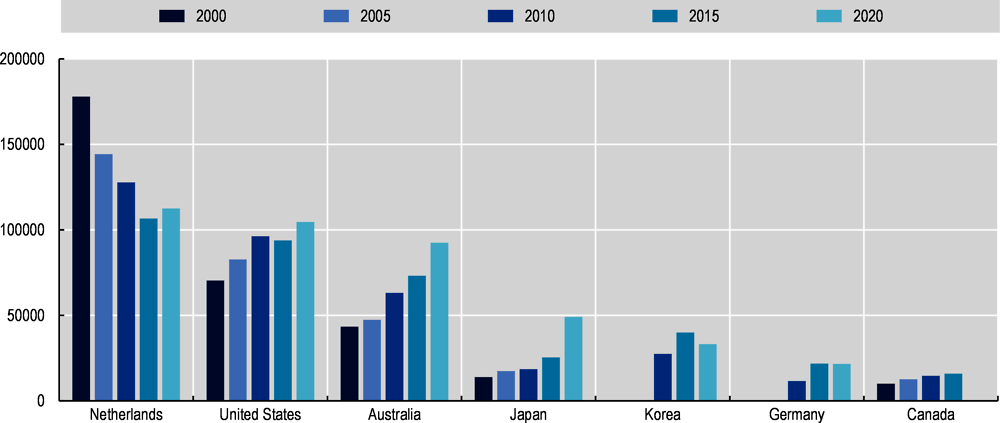
Figure 2.3 highlights the changes in the number of Indonesian emigrants in the main OECD destination countries from 2000 to 2020. The Netherlands, one of the traditional destination countries for Indonesian emigrants, still hosts the largest Indonesian migrant population in the OECD area: about 112 000 Indonesian emigrants live in the Netherlands in 2020. However, the number has gradually decreased by 37% from 178 000 in 2000, due to the limited inflows in the recent period and the ageing of the Indonesian-born population in the country. The United States, with around 105 000 Indonesian emigrants, and Australia, with around 92 000 Indonesian emigrants, are also among the main destinations of Indonesian emigrants – particularly for international students. These two countries have hosted more and more Indonesian emigrants since 2000, as suggested by the high growth rates of the Indonesian emigrant population in the United States (49%) and Australia (113%). Two Asian OECD countries, Korea (about 33 000) and Japan (about 49 000), are relatively new destinations for Indonesian migrant workers usually placed through bilateral programmes. The Employment Permit System (EPS), Korea’s flagship temporary labour migration programme, was first introduced in 2004, and Indonesia, along with five other Asian countries, signed a bilateral agreement with Korea, which became the basis of the programme established in 2006 (Yazid, 2017[3]).
Finally, the Indonesian emigrant population in Germany doubled from 11 500 in 2010 to 21 700 in 2020.
Note: Only countries with at least 20 000 Indonesian emigrant.
Source: OECD Database on Immigrants in OECD Countries (DIOC) 2000-15, Eurostat (2020), American Community Survey (2020), Australian Bureau of Statistics, Estimated Resident Population (ERP) data (2020), Japanese Population Census (2020), Korean Immigration and Foreign Residents Statistics (2020), German Central Registry for Foreigners (2020).
Indonesian emigrant populations outside the OECD area also grew rapidly. Figure 2.4 presents the evolution of Indonesian emigrants in selected non-OECD destination economies over the last two decades. There is a sizable population of Indonesian migrant in Chinese Taipei, which almost tripled from 83 000 in 2000 to 220 000 in 2020. Indonesian emigrants in Chinese Taipei already outnumbered other foreign workers, especially those from the Philippines (Melchert, 2017[4]). Hong Kong (China) and Singapore are other main economies of destination with 150 000 and 50 000 Indonesian migrants, respectively.
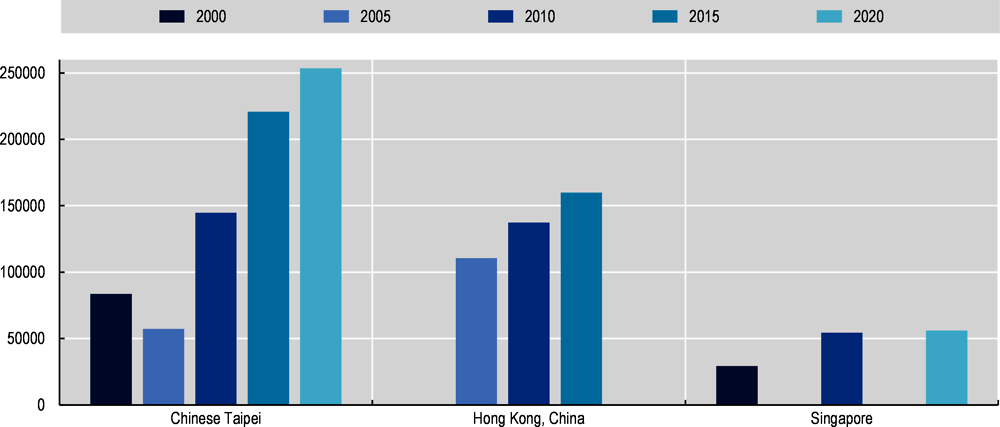
Source: Chinese Taipei National Immigration Agency (2020), Hong Kong (China) By-census (2016), Singapore Census of Population (2020).
Furthermore, current estimates indicate that a significant share of Indonesian migrants emigrated through international marriage (Box 2.2). These Indonesian emigrants with a native-born spouse are counted in the statistics in their respective host economies, but in practice, this depends on the data sources and practices of the host economies.
Indonesians’ international marriage migration has been a prevailing trend in the Asia-Pacific region (Jones, 2012[5]). In 2020, there were 30 500 Indonesian migrants with a native-born spouse in Chinese Taipei, 4 800 in Japan, and 1 000 in Korea. Especially in Chinese Taipei, Indonesia has the second-largest population with a native-born spouse following Viet Nam (9th in Japan and 15th in Korea). These figures have gradually increased in all three economies; from 2010 to 2020, the growth rate of these populations has been 15%, 24%, and 116% in Chinese Taipei, Japan, and Korea, respectively. Furthermore, the share of women among these groups is very high (98% in Chinese Taipei and 90% in Korea), which sometimes results in exploitative conditions.
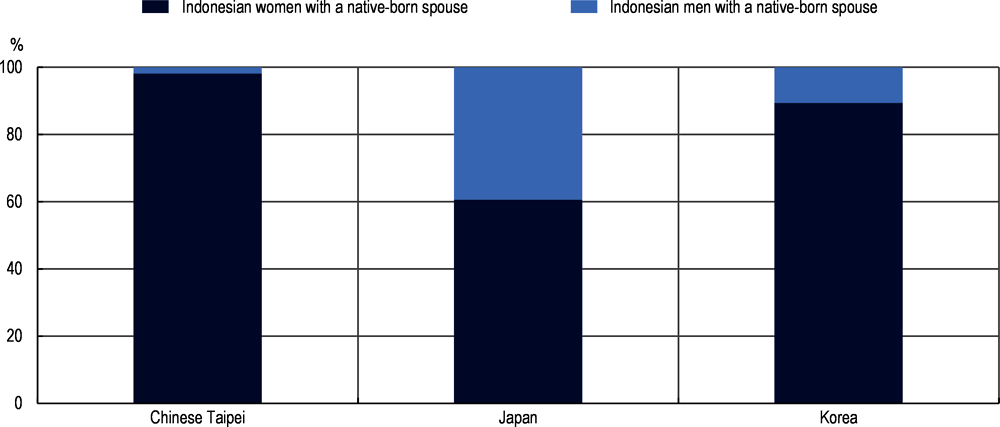
Source: Chinese Taipei National Immigration Agency (2010-20), Japanese Population Census (2010, 2015, 2020), Korean Immigration and Foreign Residents Statistics (2010-20).
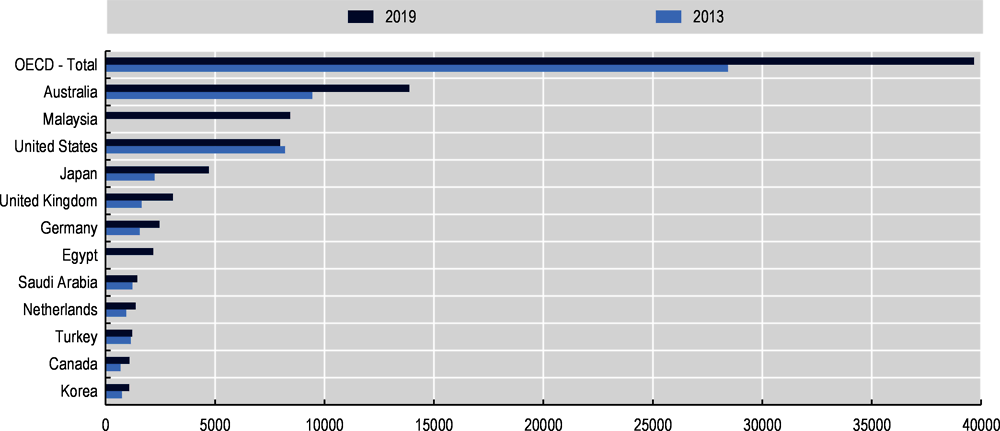
The international mobility of students is another distinct source of Indonesian emigration (Ananta and Arifin, 2014[6]). The number of Indonesian students abroad increased gradually between 2013 and 2019 from 29 800 to 53 500, an increase of approximately 80% (Figure 2.6). Among them, more than half were studying in three countries, Australia (13 900 or 26%), Malaysia (8 400 or 16%), and the United States (8 000 or 15%). Japan (4 700), the United Kingdom (3 100), Germany (2 500), the Netherlands (1 400), Turkey (1 200) and Korea (1 100) are the other main OECD destination countries for Indonesian international students.
Regional distribution of Indonesian emigrants in selected OECD destination countries
The regional distribution of Indonesian emigrants in destination countries can be compared to that of the foreign-born and native-born populations to better understand country-specific migration patterns.
In Korea, Indonesian migrants are underrepresented in the Seoul metropolitan area, where more than one-fifth of the foreign-born reside, but they are still concentrated in heavily industrialised Gyeonggi and Gyeongsang provinces which have actively supported exchanges and co-operation with Indonesia (Figure 2.7).
In Japan, one-third of Indonesian emigrants live in the Kanto region (the Greater Tokyo Area and seven neighbouring prefectures), which is a much smaller proportion than other foreign-born groups. However, they are overrepresented in other regions such as Chubu, Chugoku, Shikoku, and Kyushu and Okinawa region (Figure 2.8). These regions are normally the main destinations of Indonesian trainees deployed since 1993 (Kartikasari, 2013[7]).
Finally, in Australia, according to the 2016 distribution by State and Territory, almost half of Indonesian emigrants are concentrated in New South Wales, followed by Victoria (25%), Western Australia (16%) and Queensland (10%) (Figure 2.9).
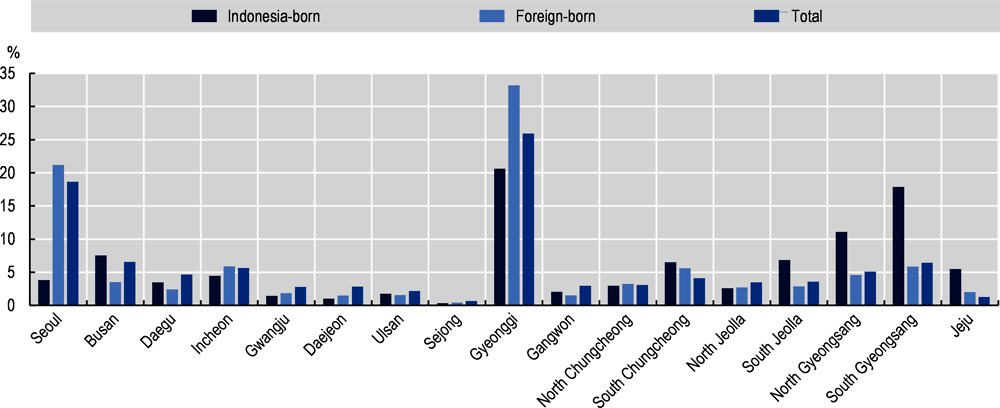
Source: Korean Immigration and Foreign Residents Statistics (2020).
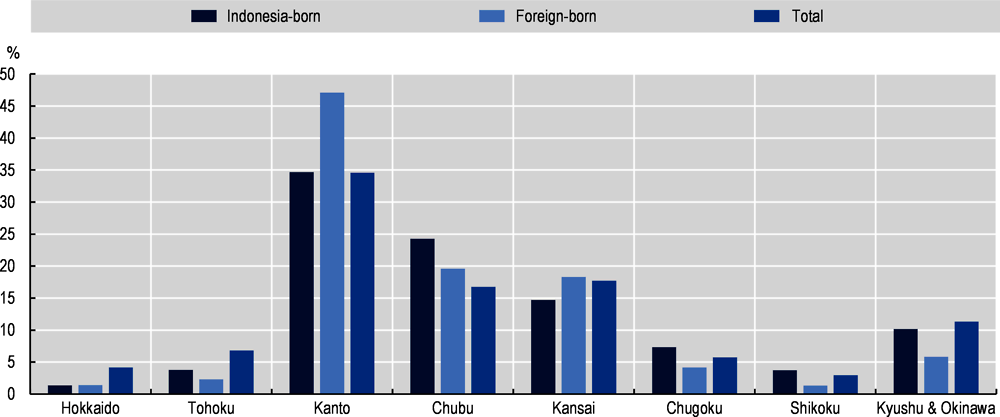
Source: Japanese Population Census (2020).
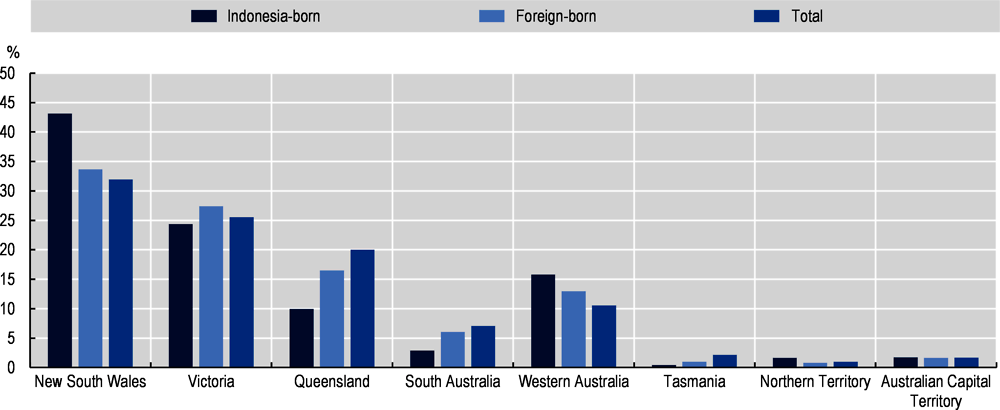
Source: Australian Census (2016).
More than half of Indonesian emigrants in OECD countries are women
In 2015/16, 56% – slightly below the ASEAN average of 58%, of Indonesian emigrants living in OECD countries were women, placing Indonesia the fourth most feminised diaspora among ASEAN countries (Figure 2.10). The Thai diaspora underwent most extreme feminisation of migration, with almost 70% female migrants, followed by the Filipino and Singaporean diasporas, with 61% and 57% respectively.
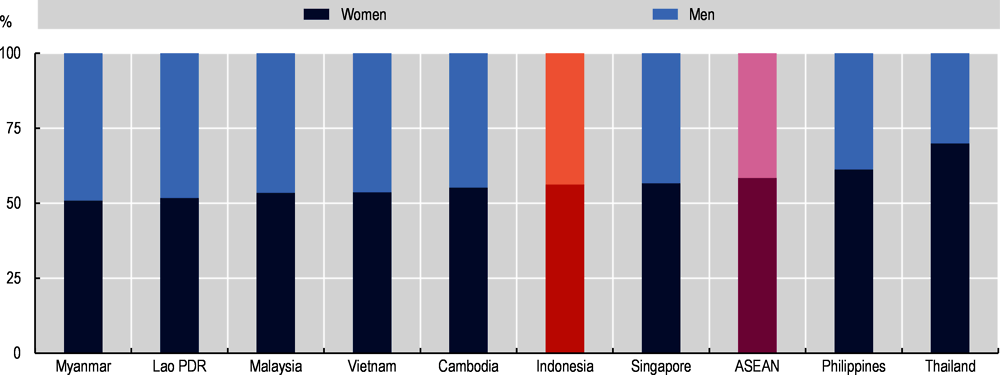
Note: Only countries with at least 150 000 emigrants in OECD countries in 2015 are included. ASEAN average includes Brunei. Indonesians in Latvia, Korea, Chile and Mexico are not included.
Source: OECD Database on Immigrants in OECD Countries (DIOC) 2015/2016.
However, the gender share of Indonesian emigrants varies significantly across destination countries. The share of women among Indonesian emigrants is well above 50% in most OECD countries – the Netherlands (56%), United States (58%), Australia (57%), and Germany (53%), and in other destination economies such as Hong Kong (China), Singapore and Chinese Taipei (see also Figure 2.12 and Figure 2.13). In 2016, there was almost 99% of women among Indonesian emigrants in Hong Kong (China). In Singapore and Chinese Taipei, the share of women among Indonesian emigrants is also very high (67% and 73%, respectively in 2020). Yet male migrants are dominant in Korea and Japan, with 91% and 65%, respectively, reflecting the fact that most Indonesian migrants in these two countries are labour migrants.
Seven out of ten Indonesian emigrants in OECD countries are of working age
Compared to other migrant populations – either foreign-born or ASEAN-born living in OECD countries, Indonesian emigrants in OECD countries are older, with a similar proportion of 0 to 24-year-old (around 15%), but a noticeably larger share of migrants aged 65 and more. Their old-age dependency ratio (39.7) is more than twice higher than that of foreign-born or ASEAN-born populations (18.5 and 17.4, respectively). This last group represents more than 25% of Indonesian emigrants, while it represents around 15% of all foreign-born people or ASEAN-born living in OECD countries, suggesting Indonesia’s old and matured diaspora communities in OECD countries (Figure 2.11). In total, around 70% of Indonesian emigrants are of working age (15-64 years).
Moreover, the age structure of the native Indonesian population shows how self-selected Indonesian emigrants are; the native-born Indonesian population is very young (27% of children aged 0 to 14 and 5%) and the average age of emigrants is necessarily much higher than that of the native population. Lastly, compared to the native-born population of OECD destination countries, Indonesian emigrants are again under-represented among children.
However, the distribution by age and sex of Indonesian emigrants varies across destination countries. As shown in Figure 2.12, Indonesian emigrants living in the Netherlands are significantly older than those residing in the other main destination countries; the proportion of people aged over 64 reaches almost 60%, whereas it is less than 1% in Korea and Japan. The proportion of young people of working age (15-24) is high in these two countries, especially among men. Overall, the majority of Indonesian migrants in OECD countries except for the Netherlands are aged between 15 and 64.
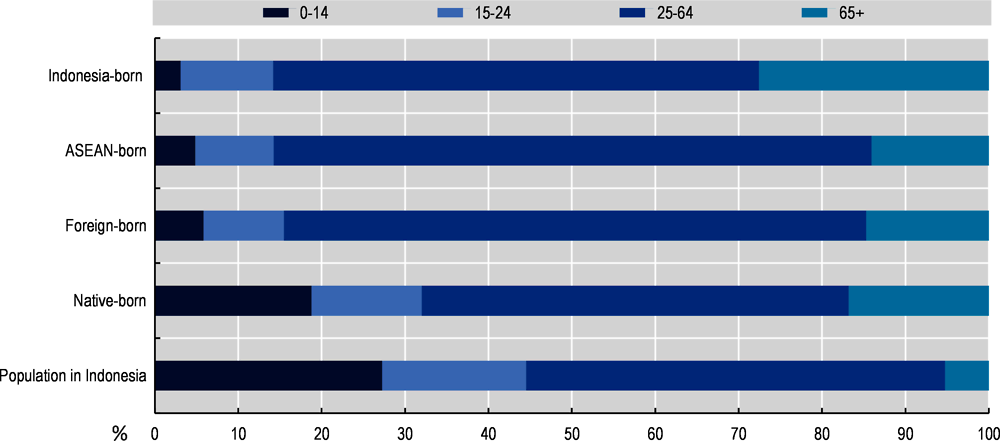
Note: Born in Indonesia: individuals born in Indonesia living in OECD countries in 2015/16. Born in ASEAN countries: individuals born in an ASEAN country living in OECD countries in 2015/16. Foreign-born: all immigrants living in OECD countries in 2015/16. Native-born: individuals born in an OECD country and living in their country of birth in 2015/16. Indonesians in Latvia, Korea, Chile, and Mexico are not included. Population in Indonesia: individuals living in Indonesia in 2015/16.
Source: OECD Database on Immigrants in OECD Countries (DIOC), 2015/16; Population in Indonesia: UNDESA World Population Prospects 2019 (2015 estimates).
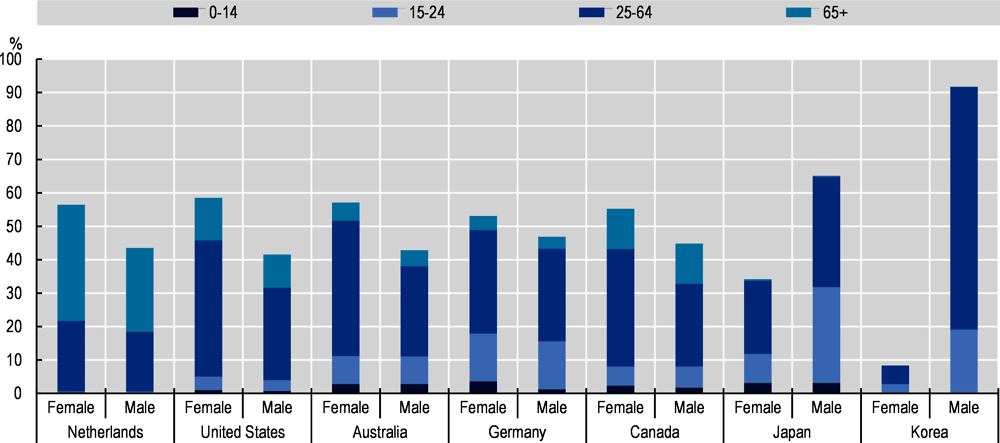
Note: Only countries with at least 10 000 Indonesian emigrants. For Korea, age group 25-64 and 65+ refer to 25-59 and 60+, respectively.
Source: OECD Database on Immigrants in OECD Countries (DIOC) (2000-15), Korean Immigration and Foreign Residents Statistics (2020).
The age structure of Indonesian emigrants outside OECD countries is also skewed in that only a small portion of child population is observed while the majority of them are aged between 25 and 64 in both Singapore and Hong Kong (China) (Figure 2.13).
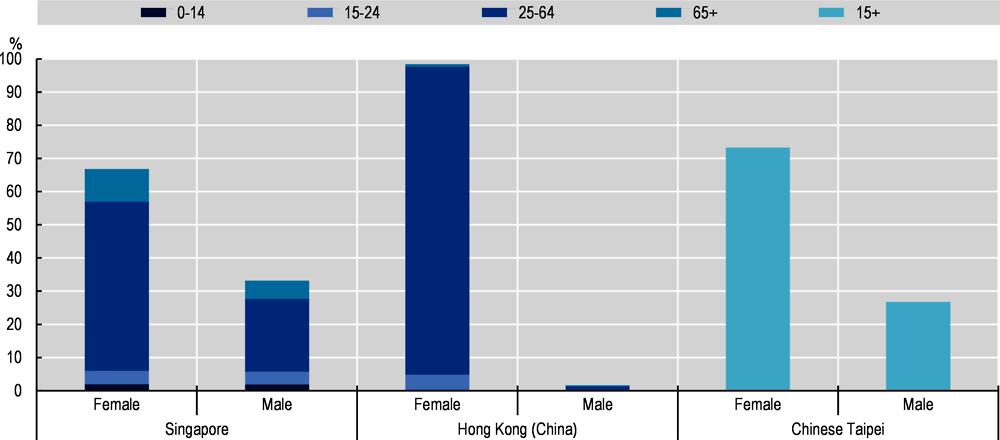
Source: Chinese Taipei National Immigration Agency (2020), Hong Kong (China) By-census (2016), Singapore Census of Population (2020).
Only one out of six Indonesian emigrants recently arrived in their host country
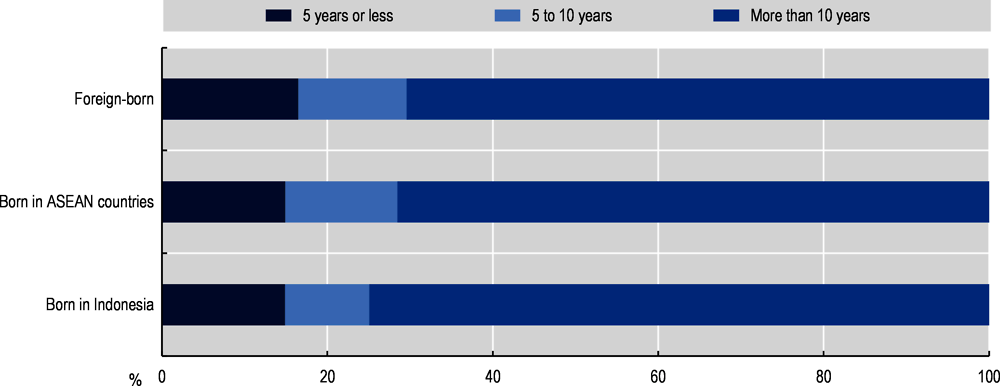
Around 15% of Indonesian emigrants had been living in their host country for less than 5 years in OECD countries according to 2015/16 data, while approximately 75% of them had been living abroad for more than 10 years (Figure 2.14). Indonesian diaspora in OECD countries is slightly older than other diasporas on average, suggesting again that Indonesians tended to emigrate to new destination countries outside OECD.
The differences in the duration of stay of Indonesian emigrants by country of destination could be used to identify the different migratory patterns to OECD countries (Figure 2.15). Among the main OECD destination countries, except for Korea and Japan where this information is not available, the Netherlands appears to host the most matured diaspora with almost 95% of Indonesian migrant populations staying longer than 10 years, which is well above the OECD average of 75%. While the United States being another country with a mature diaspora – 80% of Indonesian emigrants staying longer than 10 years, the significant share of Indonesian emigrants living in Australia (26%) and Germany (42%) has resided for relatively a shorter period. In the case of Hong Kong (China), the share of recent migrants staying 3 years or less is also high (48%).
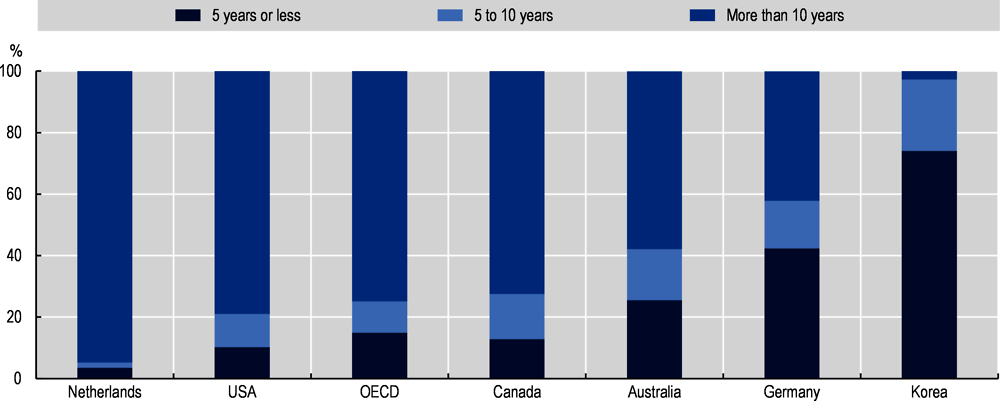
Note: OECD average does not include Korea, Japan, Chile, Latvia, Mexico, Poland, Turkey, and Iceland.
Source: OECD Database on Immigrants in OECD Countries (DIOC) 2015/16, Korean Immigration and Foreign Residents Statistics (2020).
The level of education of Indonesian emigrants has increased in recent decades
In 2015, more than 70% of Indonesian emigrants aged 15 years old and over living in OECD countries had at least upper secondary education, 46% had high educational attainment and 36% had medium educational attainment (Figure 2.16).
Compared to 2000, the level of education of Indonesian emigrants in OECD countries has increased significantly. The share of Indonesian emigrants with a low level of education fell by 7 percentage points, while the share of those with higher education increased by almost 10 percentage points. The level of education of all immigrants living in OECD countries also experienced similar improvement.
However, Indonesian emigrants residing in OECD countries have on average higher level of education than all foreign-born populations in OECD countries; the share of Indonesian emigrants with a high level of education is 46% while that of the overall foreign-born population is 31%. Furthermore, Indonesian emigrants in OECD countries are much more educated than the Indonesian native population living in Indonesia, reflecting a very strong positive selection of emigration from developing countries to OECD countries. Although the share of low educated Indonesian in Indonesia decreased between 2000 and 2015 (from 78% to 65%), it remains higher compared to other groups.
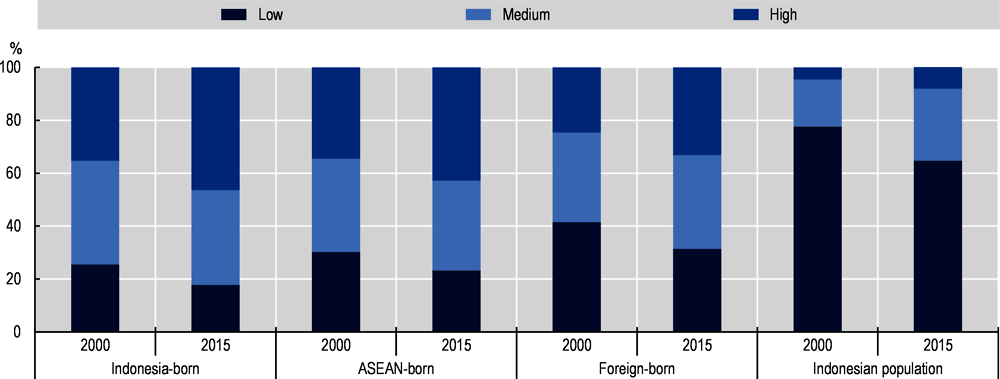
Note: Indonesians in Germany, Japan, Korea, Latvia, and Turkey are not included in 2000. Indonesians in Chile, Japan, Korea, Latvia, Mexico and Turkey are not included in 2015.
Source: OECD Database on Immigrants in OECD Countries (DIOC) (2000-15), Wittgenstein Centre for Demography and Global Human Capital (2018).
Compared to the emigrant populations of neighbouring ASEAN countries, Indonesian emigrants were relatively more educated – slightly above the ASEAN average (Figure 2.17). Among Indonesia’s neighbours, Malaysia, Singapore, and the Philippines had a more educated emigrant population than Indonesia, with less than 15% of its emigrant population being low educated and more than 50% highly educated. By contrast, other neighbouring countries of Indonesia have a less educated emigrant population. For instance, close to half of Burmese emigrants are low educated, almost three times the proportion of Indonesian emigrants.
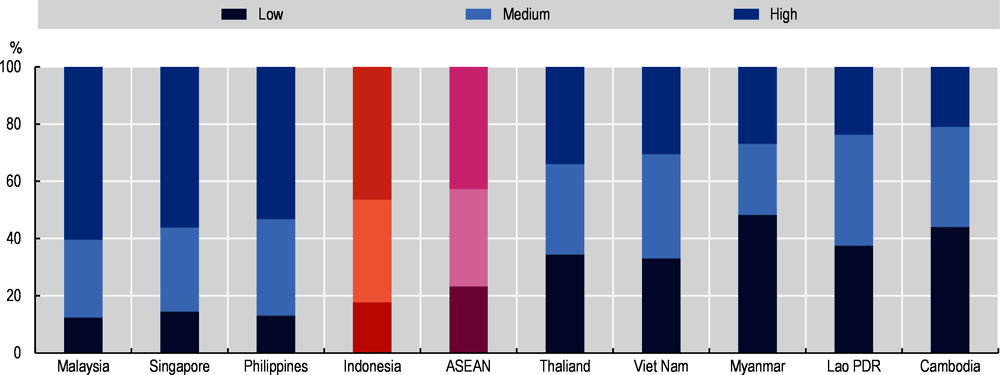
Note: Only countries with at least 150 000 emigrants in OECD countries in 2015 are included. ASEAN average includes Brunei.
Source: OECD Database on Immigrants in OECD Countries (DIOC) 2000-15.
Australia, the United States, and Singapore host highly educated Indonesian emigrants
Overall, in 2015, Indonesian emigrants aged 15 years old and over in OECD countries are highly educated; only 18% had low educational attainment, while 46% had a high level of education (Figure 2.18). There is, however, heterogeneity across destination countries. In Korea, one of labour migrants’ main destination countries, Indonesian emigrants had the lowest average level of education: 38% of them had a high level of education, while 33% had low educational attainment. To a lesser extent, Indonesian emigrants in Germany also had relatively low levels of educational attainment: the share of low educated among them was 20%. Indonesian emigrants in the United States and in Australia, two main destination countries of Indonesian international students, had, on average, a higher level of education: one-third of them had reached tertiary education in 2015/16, and the share of low educated individuals was only 9% in the United States and 8% in Australia.
Two main non-OECD destination economies, Singapore and Hong Kong (China) show two entirely different distributions. While 59% of Indonesian emigrants living in Singapore had a high level of education, only 12.5% were highly educated in Hong Kong (China).
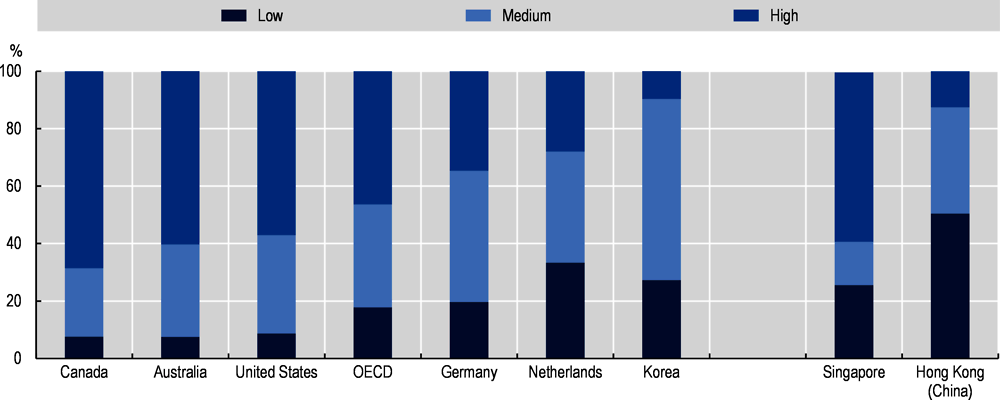
Note: Only countries with at least 10 000 Indonesian emigrants aged 15+. OECD average does not include Chile, Japan, Korea, Latvia, Mexico and Turkey.
Source: OECD Database on Immigrants in OECD Countries (DIOC) 2015/16, Korean Immigration and Foreign Residents Statistics (2020), Chinese Taipei National Immigration Agency (2020), Hong Kong (China) By-census 2016), Singapore Census of Population (2020).
Among Indonesian emigrants living in OECD countries, men still have a higher level of education than women
While 21% of Indonesian emigrant women are low educated, this share is 7 percentage points lower for men (14%) (Figure 2.20). Overall, in 2015, low educated Indonesian emigrant women aged 15 and over in OECD countries numbered around 40 000 persons whereas low educated Indonesian emigrant men represented fewer than 20 000 persons.
The differences in the distribution of education levels by gender among Indonesian emigrants vary by destination country (Figure 2.19). Among Indonesian emigrants in the Netherlands, women were more than 10 percentage points more likely than men to be low educated, with almost 40% of women having a degree from lower secondary education. In Germany as well, around 30% of Indonesian emigrant women were low educated, about 20 percentage points more than their male counterparts do. By contrast, in the United States or Australia, the distribution of education levels among Indonesian emigrants is relatively similar across genders.
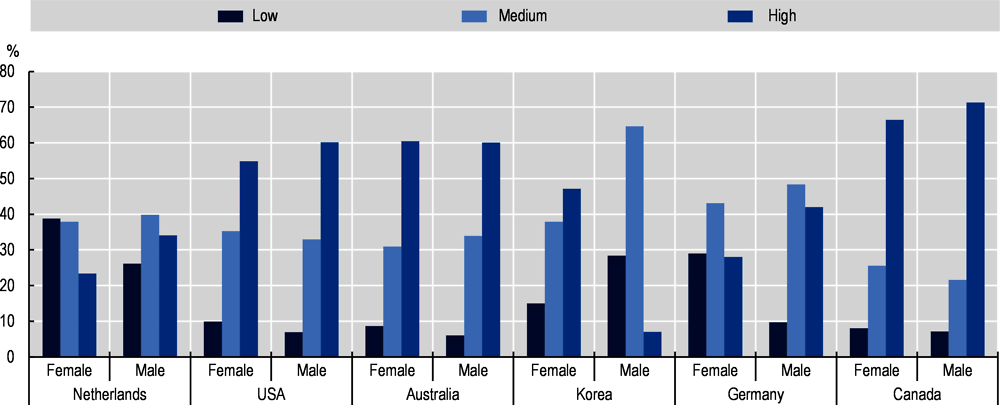
Note: Only countries with at least 10 000 Indonesian emigrants. OECD total includes all destination countries.
Source: OECD Database on Immigrants in OECD Countries (DIOC) 2015/16, Korean Immigration and Foreign Residents Statistics (2020).
Over time, gender disparities among Indonesian emigrants in terms of education level have reduced in OECD countries. More precisely, in 2000, Indonesian emigrant women were 9 percentage points more likely to have low educational attainment than men and 13 percentage points less likely to have a tertiary degree than men (Figure 2.20). However, in 2015/16, Indonesian emigrant women are only 6 percentage points less likely to have a high level of education.
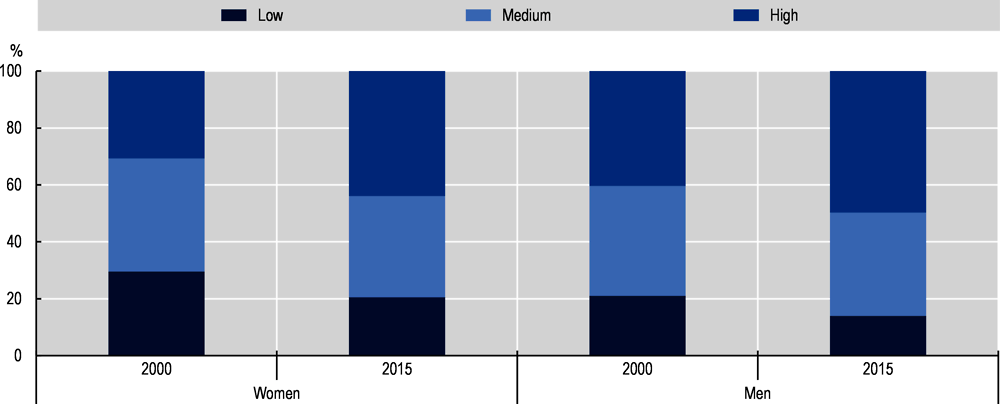
Source: OECD Database on Immigrants in OECD Countries (DIOC), 2015/16.
Indonesian emigrants have a lower-than-average probability to acquire the nationality of the destination country, except in the Netherlands
According to OECD International Migration Database which includes information on the annual numbers on acquisitions of nationality in OECD countries, there are some notable patterns of Indonesian emigrants’ naturalisation observed in the main destination countries – the United States, Australia, the Netherlands, Korea, Germany, and Canada. While the number of Indonesian emigrants who newly acquired the citizenship of their host country fluctuated in the United States and Australia, the numbers stay relatively stable in Korea and in Germany. However, in the Netherlands, the number almost halved from 456 in 2000 to 215 in 2019 (Figure 2.21).
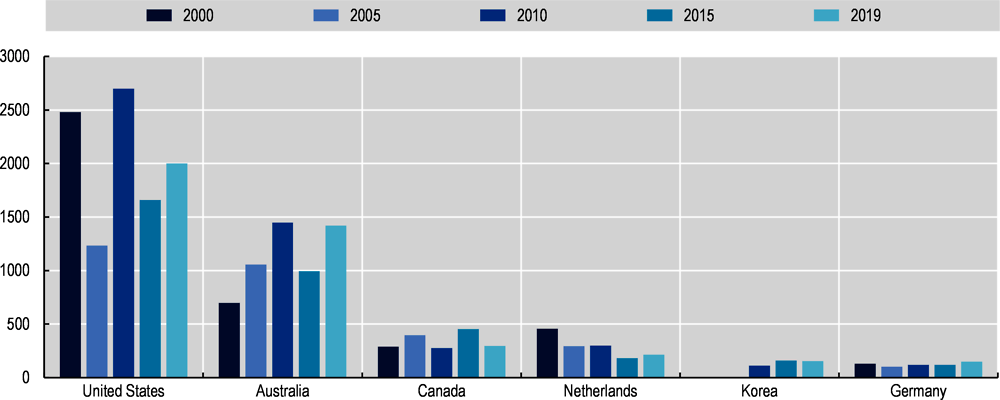
Note: Only countries with at least 10 000 Indonesian emigrants. OECD total includes all destination countries.
Source: OECD International Migration Database, Korean Immigration and Foreign Residents Statistics (2020).
Similar patterns can be observed in Chinese Taipei. From 2000 to 2019, the number of Indonesian emigrants who acquired citizenship decreased by 83%.
However, the naturalisation rate for Indonesian emigrants in 2015 was surprisingly high for some countries: 93% for the Netherlands and 100% for Japan – possible sampling bias for Japanese case. This high rate of Indonesian emigrants who acquired the Dutch citizenship shows Indonesian emigrants’ long history of emigration to the Netherlands (Figure 2.22).
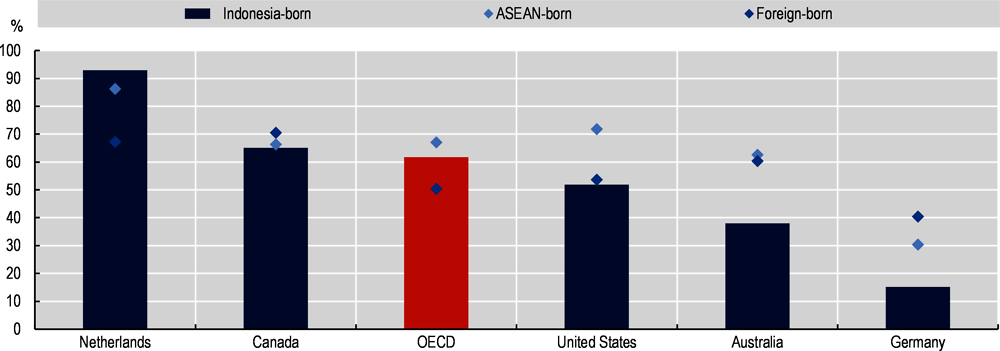
Note: Only countries with at least 5 000 Indonesian emigrants. The OECD average does not include Chile, Korea, Mexico, Latvia, Austria, New Zealand, and Turkey.
Source: OECD Database on Immigrants in OECD Countries (DIOC), 2015/16.
Six out of ten Indonesian emigrants held the citizenship of their OECD host country in 2015
According to the most recent data available, the share of host country citizenship holder among Indonesian emigrants in OECD countries is 62% (Figure 2.23). This is around 4 percentage points lower than that of ASEAN emigrant population and more than 10 percentage points higher than that of the foreign-born population in OECD countries. Among the ASEAN member countries, Indonesia is the sixth country with the highest rate of naturalisations.
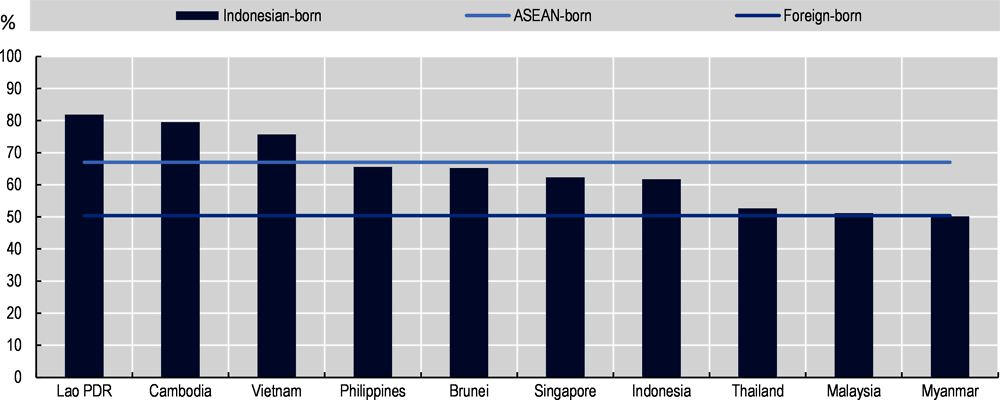
Note: Only countries with at least 150 000 emigrants in OECD countries in 2015 are included. ASEAN average includes Brunei. Percentage of ASEAN migrants holding the citizenship of the OECD country where they reside.
Source: OECD Database on Immigrants in OECD Countries (DIOC) 2015/16.
Emigration rates are defined as the ratio between the number of emigrants from a specific country living in OECD countries and the total sum of the resident population of this country and emigrants living in OECD countries. In 2015, Indonesia had an emigration rate of 0.2% for the total population aged over 15 and 1.0% for high-educated population, the lowest among the ASEAN countries, reflecting that only a few Indonesians have the intention to emigrate as discussed in the previous chapter (Figure 2.24).
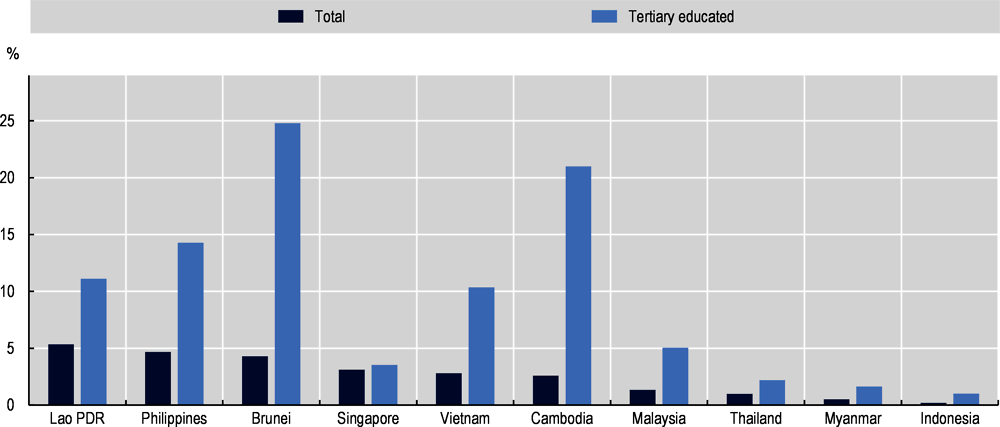
Source: Emigration rates to OECD countries, 2015/16.
This chapter analysed the size and the socio-economic characteristics of Indonesian emigrants in main OECD destination countries and other non-OECD economies since 2000. Among one out of ten Indonesian emigrants residing in the OECD area, more than half are women and most of them are of working age. Indonesian emigrants are overall positively selected in terms of educational attainment. Different channels of emigration – education, employment, and international marriage, explains diverse patterns of diaspora observed by destination countries.
References
[6] Ananta, A. and E. Arifin (2014), “Emerging Patterns of Indonesian’s International Migration”, Malaysian Journal of Economic Studies, Vol. 51/1, pp. 29-41.
[8] Farbenblum, B., E. Taylor-Nicholson and S. Paolett (2013), Migrant Workers’ Access to Justice at Home: Indonesia.
[1] IOM (2010), Labour Migration from Indonesia: an Overview of Indonesian Migration to Selected Destinations in Asia and the Middle East, IOM, Jakarta, https://labordoc.ilo.org/permalink/41ILO_INST/1s2ok2m/alma994722903402676.
[5] Jones, G. (2012), “International Marriage in Asia: What do we Know, and What Do We Need to Know?”, Asia Research Institute Working Paper Series, Vol. 174.
[7] Kartikasari, N. (2013), “Effects of Labor Immigration Policies on Indonesian Migrant Workers in Japan and South Korea”.
[4] Melchert, P. (2017), “Indonesian Migrants in Taiwan: Religion and Life-Style”, Institute of Ethnology Working Papers in Social Anthropology, Vol. 4.
[2] Missbach, A. and W. Palmer (2018), Indonesia: A Country Grappling with Migrant Protection at Home and Abroad.
[3] Yazid, S. (2017), “Labour Migration From Indonesia to South Korea: Challenges in Maximizing Potentials”, Jurnal Hubungan International, Vol. 6/1, pp. 1-10.