
1. General assessment of the macroeconomic situation
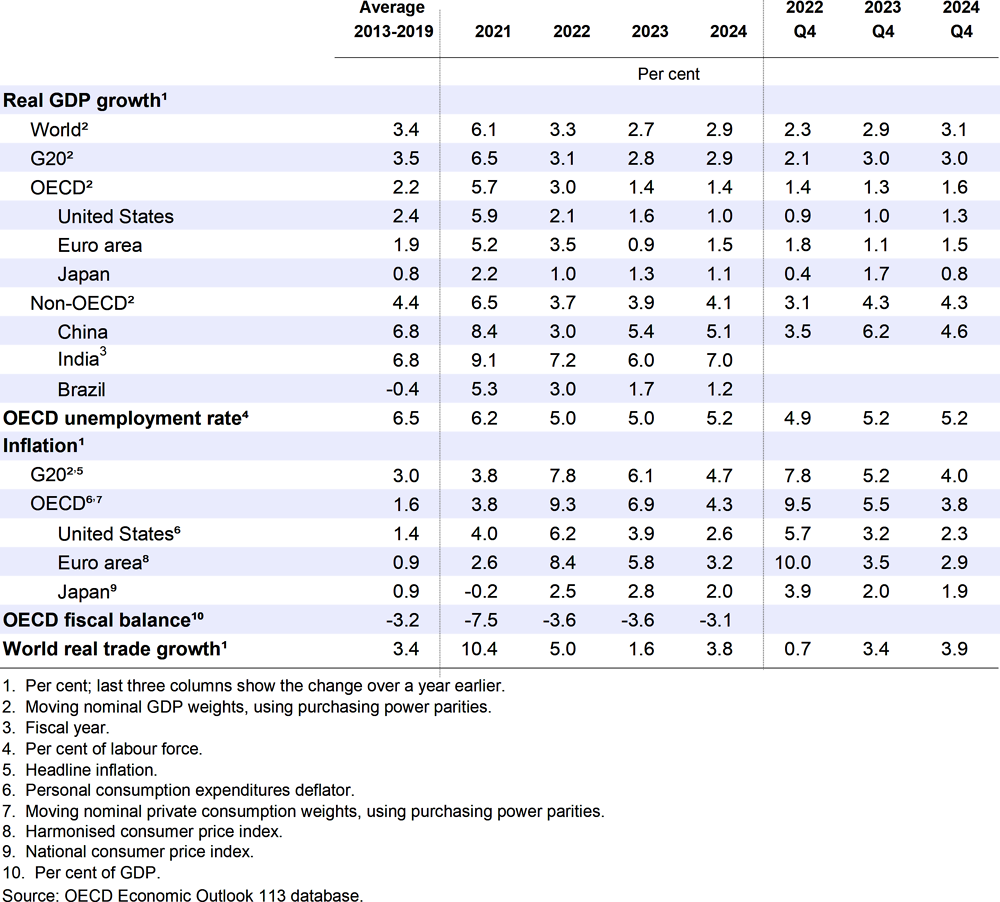
Global economic developments have begun to improve, but the upturn remains fragile. Lower energy prices are helping to bring down headline inflation and ease the strains on household budgets, business and consumer sentiment are picking up from low levels, and the earlier-than-expected full reopening of China has provided a boost to global activity. At the same time, core inflation is proving persistent, reflecting higher profits in some sectors and still-elevated cost pressures in resilient labour markets. The impact of higher interest rates around the world is also increasingly being felt, particularly in property and financial markets. Signs of stress have started to appear in some financial market segments as investors reassess risks, and credit conditions are tightening. Global GDP growth is projected to moderate from 3.3% in 2022 to 2.7% in 2023, before edging up to a still subdued 2.9% in 2024. Restrictive monetary policy will constrain demand growth for some time to come, with the full effects from policy tightening in 2022 only appearing later this year or in the early part of 2024. Annual consumer price inflation in the G20 economies is projected to decline from 7.8% in 2022 to 6.1% in 2023 and 4.7% in 2024, helped by lower energy and food retail prices, moderating demand pressures and lower supply bottlenecks. Core inflation is projected to be relatively sticky but ease gradually towards target in the major advanced economies by the end of next year.
Significant uncertainty about economic prospects remains, and the major risks to the projections are on the downside. One key concern is that inflation could continue to be more persistent than expected. Significant additional monetary policy tightening may then be required to lower inflation, raising the likelihood of abrupt asset repricing and risk reassessments in financial markets. A related concern is that the strength of the impact from the monetary policy tightening that has already occurred is difficult to gauge after an extended period of very accommodative policy and the speed at which policy interest rates have subsequently been raised. While a cooling of overheated markets and moderation of credit growth are standard channels through which monetary policy normally takes effect, the impact on economic growth could be stronger than expected if tighter financial conditions were to trigger stress in the financial system and undermine financial stability. Sharp changes in the market value of bond portfolios may further expose liquidity and duration risks. Rising household and corporate debt-service burdens and the greater potential for loan defaults also raise credit risks at banks and non-bank financial institutions, and could result in a further tightening of lending standards. Tighter than expected global financial conditions could also intensify vulnerabilities in emerging-market economies, adding to debt servicing costs and capital outflows, and reducing credit availability for borrowers relying on foreign lenders. Another key downside risk to the outlook relates to the uncertain course of Russia’s war of aggression against Ukraine and the associated risks of renewed disruptions in global energy and food markets. On the upside, reduced uncertainty from an early end to the war, easier-than-expected financial conditions, more robust labour force growth, and greater use of accumulated savings by households and businesses would all improve growth and investment prospects. However, the impact of these individual shocks on inflation could vary.
The need to durably lower inflation, adjust fiscal policy support and revive sustainable growth creates difficult challenges for policymakers.
Monetary policy needs to remain restrictive until there are clear signs that underlying inflationary pressures are durably reduced. This may require additional interest rate increases in economies in which high core inflation is proving persistent. Policy decisions will need to be carefully calibrated given uncertainty about financial market developments and the need to take stock of the cumulated impact of past interest rate increases. If additional financial market stress occurs, central banks should make full use of the set of financial policy instruments available to enhance liquidity and minimise contagion risks. Clear communication will be necessary to minimise uncertainty about apparent conflicts between the pursuit of price stability and financial stability mandates. Policy space in most emerging-market economies is constrained by the need to keep inflation expectations anchored and tight global financial conditions. In the event of exchange rate pressures, countries should let their currencies adjust as much as possible to reflect underlying economic fundamentals. However, temporary foreign exchange interventions or restrictions on capital movements could be employed to mitigate sudden moves that generate severe risks to domestic financial stability.
Ensuring the sustainability of the public finances has become more challenging due to the multiple impacts of the pandemic, the war and energy shocks. Almost all countries have higher budget deficits and debt levels than before the pandemic, and many face rising future spending pressures from ageing populations, the climate transition and the growing burden of servicing public debt given higher interest rates. Careful choices are needed to preserve scarce budget resources for future policy priorities and to ensure debt sustainability. Credible fiscal frameworks setting out future expenditure and tax plans are needed to provide clear guidance about the medium-term trajectory of the public finances. In the near term, with food and energy prices having declined, and minimum wages and welfare benefits having now been permanently increased to take account of past inflation in many countries, fiscal support to mitigate the impact of higher food and energy prices should become targeted on vulnerable households inadequately covered by the general social protection system. This would preserve incentives to reduce energy use, help to limit aggregate demand pressures on inflation, and better align fiscal and monetary policies.
The conjuncture, the long-term decline in potential growth rates, and pressing future challenges such as ageing populations and the climate transition point to a clear need for ambitious supply-boosting structural reforms. Rekindling reform efforts to reduce constraints in labour and product markets, and strengthen investment, labour force participation and productivity growth would improve sustainable living standards and strengthen the recovery from the current slowdown. Enhancing business dynamism, lowering barriers to cross-border trade and economic migration, and fostering flexible and inclusive labour markets, including through skill improvements and the removal of remaining barriers to labour force participation, are all key policy areas where well-designed reforms would help to boost competition, revive investment, and alleviate supply constraints.
Gender employment and wage gaps have generally narrowed at a relatively modest pace over the past decade, calling for further action across a broad range of policy areas to strengthen participation, skills and opportunities for women. Such action would improve growth prospects, make them more inclusive and ensure that all talent is utilised effectively. Key priorities include improving access to affordable high-quality childcare, incentivising better sharing of parental leave between parents, reforming tax-benefit systems to remove disincentives for women to participate in labour markets, and encouraging gender equality within firms.
The series of shocks to the global economy in recent years and longer-term global challenges such as climate change underline the need for enhanced international cooperation. At the same time, geopolitical tensions have increasingly hindered cross-border flows of goods, services, capital and labour, and contributed to food insecurity for many countries. The rise in debt distress among low-income countries makes it particularly urgent that creditor countries and institutions take joint action – building on the initial steps taken under the G20 Common Framework – to ensure that debt burdens are sustainable, and avoid the risk of a lost decade of development for many low-income countries. More generally, in an interconnected world, countries have to find ways to ensure that frictions in some areas do not prevent progress being made on issues of common interest, including climate change mitigation, open markets, economic security, and responding to pandemics.
After weak global growth in 2022, there are signs of improvement in 2023
Global growth slowed substantially over the course of 2022 in both advanced and emerging-market economies (Figure 1.1, Panel A). The large spike in food, fertiliser and energy prices following Russia’s invasion of Ukraine added to the already sizeable increases during 2021, pushing up headline inflation considerably in almost all countries and generating declines in household real disposable incomes. The ratio of aggregate OECD end-use energy expenditures to GDP rose sharply in 2022, reaching the highest level since the early 1980s, raising costs for firms and eroding the purchasing power of households (OECD, 2022b). Significant tightening of monetary policy by almost all major central banks pushed up policy interest rates and began to weigh on interest-sensitive components of expenditure. The slowdown in the OECD economies was led by housing investment, which contracted during 2022, but the growth of consumers’ expenditure and business investment also eased through the year. By the fourth quarter of 2022, global growth had slowed to an annualised rate of just 2%, with growth over the year falling to 2¼ per cent, just over half the pace seen through 2021. Output declined in 15 OECD economies in the fourth quarter, with most of these in Europe. Outcomes were also relatively weak in the Asia-Pacific economies, with activity in China continuing to be held back by a wave of COVID-19 infections and public health restrictions. China’s GDP grew by only 3% in 2022, less than in any year in the past four decades with the exception of 2020, which was even more severely affected by the pandemic.

Note: In Panel A, annual growth denotes the change over the year to the quarter shown. Quarterly growth at a.r. denotes quarter-on-quarter growth at an annualised rate. Global aggregates in Panels C and D are PPP-weighted aggregates. The retail sales measure uses monthly household consumption for the United States and the monthly Real Consumption Activity indicator for Japan.
Source: OECD Economic Outlook 113 database; S&P Global; OECD Main Economic Indicators database; Bank of Japan; and OECD calculations.
Economic indicators in the first months of 2023 have improved, with global GDP growth picking up to an annualised rate of just over 3% in the first quarter, despite mixed outcomes across countries. Growth rebounded in Brazil, China, India and Japan, but slowed in the United States, and there was only a modest output rise in the euro area and the United Kingdom. Business surveys have improved markedly relative to late 2022, particularly in the services sector (Figure 1.1, Panel B) and consumer confidence indicators in major economies have also begun to recover from the very low levels seen last year.
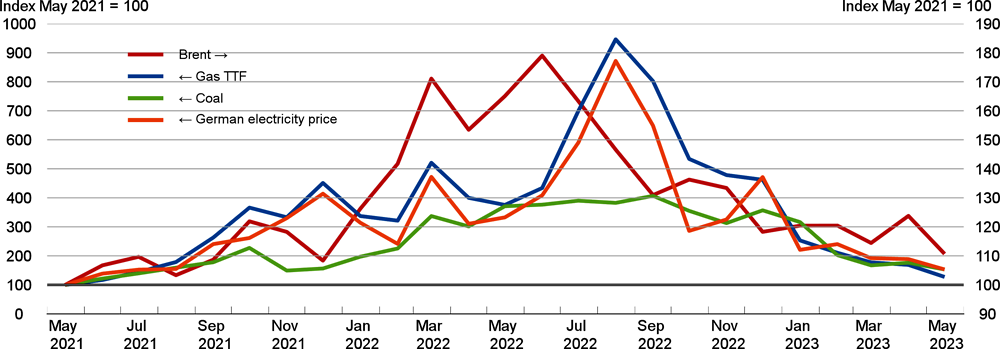
The improvement in the early part of this year is driven to some extent by declines in energy prices and better prospects for China. Energy commodity prices have fallen sharply since last summer, with a particularly marked decline in the price of natural gas, above all in Europe (Figure 1.2). However, this has yet to be fully reflected in lower retail prices in many countries. The spot prices of oil and coal have also come down a long way from the peaks reached after the invasion of Ukraine last year, easing pressures on households and companies. Even so, prices generally remain higher than seen prior to the pandemic. China’s earlier-than-expected reversal of its zero-COVID policy in December 2022, combined with a loosening of both fiscal and monetary policy, has also boosted business sentiment, as stronger growth of the Chinese economy will have positive benefits in the Asia-Pacific region and more widely.
Recent monthly activity indicators have been mixed. The manufacturing sector is still weak (Figure 1.1, Panel C), notably in several Asian economies, in part due to subdued tech sector activity. In most economies, the improvement in early 2023 has been more apparent in services sectors, helped by a rebound in consumer demand in China and solid growth in the United States (Figure 1.1, Panel D). However, demand for durable goods remains soft, in part reflecting the greater sensitivity of such spending to financial conditions.
The impact of tighter monetary policy is becoming increasingly visible in property markets. Housing investment declined in all the large OECD economies in the second half of 2022. In the fourth quarter of 2022, housing investment in the OECD economies with available data was 7½ per cent weaker than a year earlier, with the decline approaching 19% in the United States and exceeding 13% in Canada (Figure 1.3, Panel A). Housing investment continued to contract in the United States and Canada in the first quarter of 2023. House prices have also begun to adjust to policy tightening, with nominal price declines now underway in many economies (Figure 1.3, Panel B), and even larger real price declines given high consumer price inflation. Price adjustments have been relatively quick in countries with elevated price-rent ratios, high household debt, and a sizeable share of adjustable-rate mortgages. Price changes have been less marked in countries with strong population growth and a large share of mortgages at fixed borrowing rates (OECD, 2022b). Even so, many mortgages have rates that float or are fixed for only a few years, and mortgage-holders will increasingly be faced with rising payments if mortgage rates remain at their new higher levels. Past experience has shown that swings in real house prices are often associated with business cycle fluctuations (Hermansen and Röhn, 2017; Cavalleri et al., 2019; Figure 1.4, Panel C), both because of the substantial drag on economic activity from lower investment and pressures on household finances and balance sheets, and because of associated strains in the financial sector.
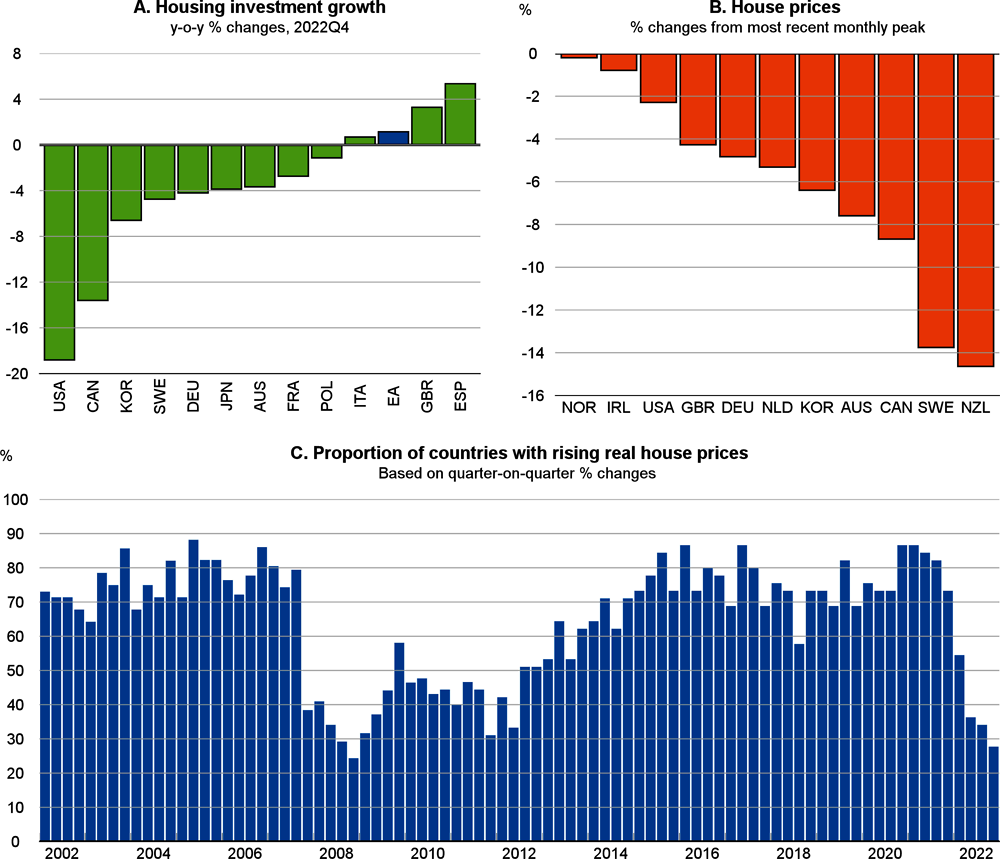
Note: In Panel B, the peak corresponds to November 2021 for New Zealand; January 2022 for Australia; February 2022 for Sweden; May 2022 for Canada and Korea; June 2022 for Germany, the Netherlands and the United States; August 2022 for Norway and the United Kingdom; and December 2022 for Ireland. Latest available information is December 2022 for Sweden; January 2023 for Korea; March 2023 for Ireland and the United States; April 2023 for Canada, Germany, New Zealand, Norway and the Netherlands; and May 2023 for Australia and the United Kingdom. Data are seasonally adjusted. In Panel C, sample based on the OECD economies except Costa Rica, plus Brazil, Bulgaria, China, Croatia, India, Indonesia, Romania and South Africa.
Source: OECD Economic Outlook 113 database; OECD Analytical House Price database; Australia, Core Logic; Canada, Teranet-National Bank; Germany, Europace; Ireland, Central Statistics Office; Statistics Netherlands; New Zealand, REINZ; Real Estate Norway; Sweden, Valueguard; United Kingdom, Nationwide Building Society; United States, Standard and Poor's Case-Shiller Index; and OECD calculations.
Global trade growth was relatively robust in 2022, at 5%, despite the war in Ukraine, high geopolitical tensions and commodity prices, and widespread dollar appreciation. Trade was supported by the gradual easing of supply bottlenecks, the continued recovery in consumer demand for travel services, and the gradual lifting of COVID-related travel restrictions, particularly in Asia. Despite the relatively strong annual growth, trade in goods and services faltered in the fourth quarter of 2022, with a 7% annualised quarterly decline in trade volumes. Tighter monetary policy, slowing industrial production, high inventory levels, and a downturn in the semiconductor cycle lowered demand. In addition, a renewed wave of COVID-19 infections in China restricted trade within Asia. Global trade volumes recovered partially in the first quarter of 2023, with an estimated rise of 1.8% (at an annualised rate), but global merchandise trade remained very weak. Transport prices and shipping volumes are weak and survey measures of new manufacturing export orders generally remain at low levels, although services export orders continue to improve (Figure 1.4). With global supply bottlenecks having now largely eased, and China having reopened, subdued demand for manufactured goods and commodities, which make up almost 80% of total trade volumes, will weigh on global trade growth.
Despite war-related trade restrictions and the potential risk to the supply of key agricultural products from Ukraine, global food exports have held up relatively well. Exports of wheat, maize and barley from Ukraine fell by 9.1% in 2022, to 41.3 million tonnes, but the Black Sea Grain Initiative has facilitated over 16 million tonnes of approved food shipments from Ukraine in 2022 and more than 15 million tonnes in the first five months of 2023. Accelerating the food transported through this initiative, by supporting inspection and trade insurance, would increase Ukraine’s exports to its traditional markets in the Middle East and Africa and enhance food security in these countries.1
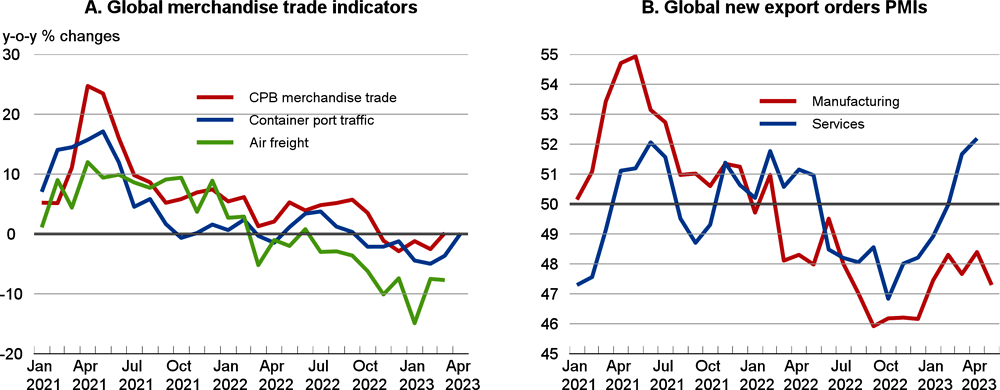
Source: CPB Netherlands Bureau for Economic Policy Analysis; Institute of Shipping Economics and Logistics; IATA; S&P Global; and OECD calculations.
Financial market conditions remain tight and volatile
The impact of monetary policy tightening is increasingly being reflected in financial market developments, particularly credit conditions and the prices of long-term fixed-income assets. Significant stress has also appeared in parts of the banking system, heightening market volatility, though this has not led to a substantial generalised further tightening of financial conditions.
The failure of some regional US banks in recent months and the forced takeover of Credit Suisse, a global systemically-important bank, quickly generated tensions in global banking markets. Bank equity indexes fell sharply, and banks’ credit default swap (CDS) spreads soared by some 60 to 80 basis points in the United States and the euro area. While noticeable, the increase was significantly lower than at the peak of the global financial crisis in 2008. Timely policy measures to deal with the failing institutions and address banks’ liquidity pressures have helped to stabilise financial conditions (Figure 1.5), but significant liquidity, duration and credit risks remain in segments of financial markets.
The rising cost of funding for banks (Figure 1.8, Panel A) and the need to further strengthen capital and liquidity buffers are likely to result in more restrictive credit conditions. Bank lending standards have already tightened substantially in most major advanced economies, particularly in the United States and in the euro area (Figure 1.8, Panel B), although not in Japan, where monetary policy remains accommodative. In the United States, lending standards have tightened at a faster pace than in previous tightening cycles, but have not yet reached the peaks seen at the height of the global financial crisis. Changes in policy interest rates in other countries have been quickly transmitted to deposit rates and banks have passed through the high cost of funding to lending rates, leading to a slowdown of credit growth in many economies (Box 1.1). New loans for house purchases have been falling sharply in several OECD countries, including the largest European economies.
Note: The chart shows various indicators of systemic stress in financial markets. These summarise disruptions in normal market functioning across a range of market segments, including money markets, equity markets, bond markets, credit markets and foreign exchange markets. Positive and negative values indicate that financial stress is respectively above or below the long-run average. Data are standardised.
Source: European Central Bank; Federal Reserve Bank of Kansas City; Office of Financial Research; and OECD calculations.
The impact of monetary policy on financing conditions for households and firms is a key channel for the transmission of changes in the policy stance.1 Ultimately, the effectiveness of monetary policy depends on the speed and extent to which changes in policy rates are passed through to economic agents. Rising policy rates have already been quickly transmitted to money market rates and bank funding costs over the past year, with inter-bank interest rates and deposit rates reaching levels not seen since the peak of the global financial crisis in some countries. This Box assesses the extent to which these developments are affecting financing conditions for households and companies. The analysis suggests that changes in policy rates in the advanced economies are being quickly reflected in bank credit conditions, with transmission occurring at a broadly similar pace to that seen in past tightening cycles. The pass-through of monetary policy to corporate bond yields appears to be taking place more slowly.
Comparing movements in policy rates and the interest rates charged on new bank loans provides one means of assessing the strength and speed of monetary policy pass-through.2 Banks generally base the lending rates they charge to firms and households on their own funding costs, plus a mark-up.3 On average, across countries, banks have swiftly passed through the higher cost of funding to economic agents (Figure 1.6, Panels A and B), especially to non-financial corporations, where bank lending rates have on average increased almost one to one with policy rates. Transmission is occurring at a similar pace to past tightening cycles on average, but with significant variation across countries. The largest relative changes in new bank lending rates are in Australia, Canada, New Zealand, Norway and Sweden, in some cases reflecting an earlier start to policy tightening.
In some countries, including Germany, Sweden and the United Kingdom, the increase in bank lending rates has outpaced the changes in deposit rates, pointing to a somewhat slower pass-through of monetary policy to savers than borrowers.4 However, deposit rates have started to rise more rapidly recently, with banks trying to counteract tighter liquidity conditions and an acceleration in deposit outflows by offering higher rates to their customers. Euro area data suggest that bank lending rates charged on short-term loans to non-financial corporations have generally increased faster than those on lending at longer maturities, while lending rates on consumer loans to households have risen less than rates on loans for house purchases.
Fast-rising bank lending rates have been associated with a slowdown in the pace of nominal credit growth (Figure 1.6, Panels C and D). The slowdown has been somewhat more pronounced for credit to households, although credit to firms has contracted in a handful of countries. In the majority of the countries considered, credit growth has been more muted than at similar points in previous tightening cycles, and also lower than on average over 2000-19, particularly in the case of credit to households. The available evidence thus suggests that monetary policy transmission is proving at least as effective as in past tightening cycles. The slowdown in credit growth is even stronger if measured in real terms, as inflation has been higher in most countries than in many previous monetary tightening cycles.
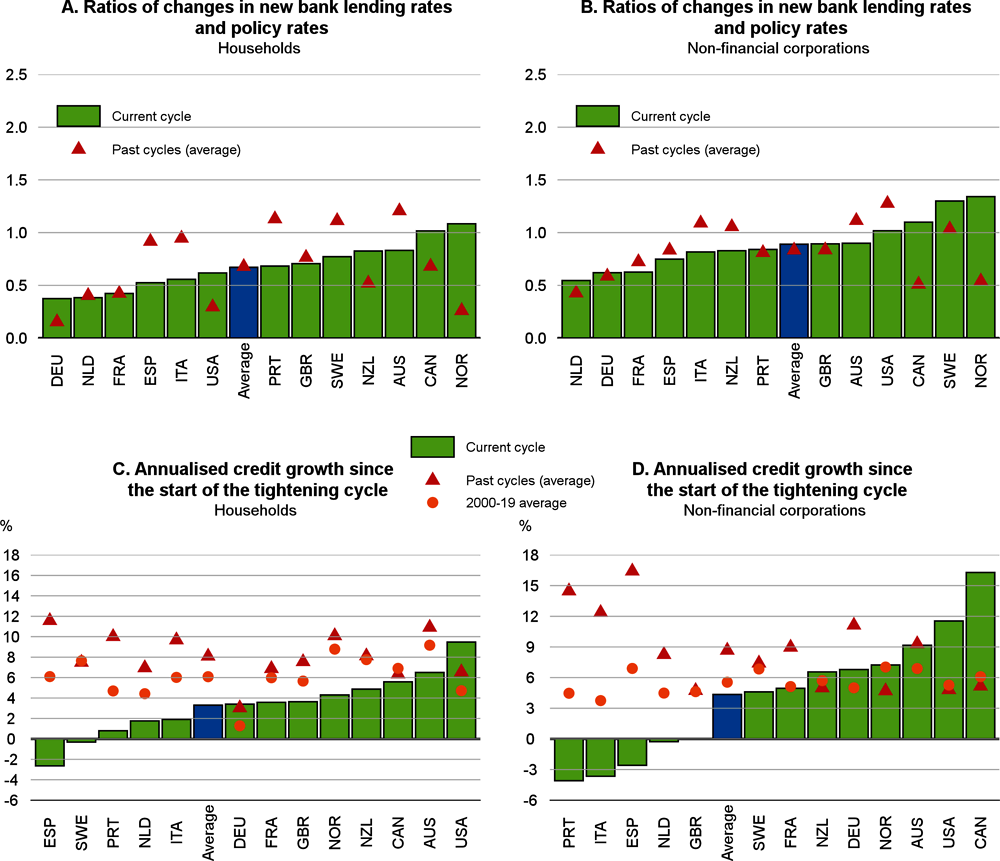
Note: For the current tightening cycle, changes in policy rates, new lending rates and credit growth are computed between the date of the first policy increase and March 2023. Similarly, across past tightening cycles, changes are computed since the first rate increase and over a period matching the one elapsed since the first increase in the current cycle. Changes across past tightening cycles are computed as simple averages of individual country tightening cycles since 2000. 'Average' is computed as a simple average across countries. Bank lending rates and credit growth to households are for house purchases.
Source: Reserve Bank of Australia; Bank of Canada; Bank of England; European Central Bank; Bank of Japan; Reserve Bank of New Zealand; Statistics Norway; Sveriges Riksbank; Swiss National Bank; Board of Governors of the Federal Reserve System; and OECD calculations.
Bank lending surveys suggest that slowing credit growth and higher lending rates observed in the advanced economies reflect a combination of tighter credit standards and falling credit demand. While data are only available for a few countries, banks overwhelmingly report a tightening of credit standards in recent quarters, especially for mortgage lending in the euro area and for lending to non-financial corporations in the United States. Credit standards for mortgage lending have also tightened in the United Kingdom, albeit by less. Surveys point to a sharp decline in credit demand as well, especially for house purchase in the euro area and in the United States, reflecting a range of factors, including weak income growth. In the euro area, the decline of credit demand for house purchases is similar to that seen during the global financial crisis. Banks expect a further deterioration of credit conditions in the second quarter of 2023, especially for loans to households, again overwhelmingly reflecting tighter credit standards and, in the euro area and in the United States, a further decline of credit demand.
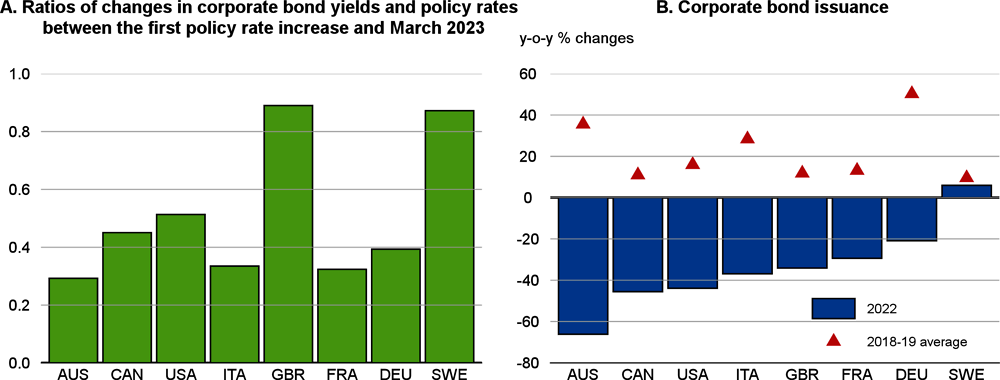
Rising policy rates have also been reflected in the cost and quantity of market-based debt available to firms. Yields on corporate bonds have risen in recent quarters in most advanced economies (Figure 1.7). The pass-through of monetary policy to corporate bond yields appears to be generally slower than for bank lending rates. In addition, corporate bond issuance has recently dried up in most economies. There is also evidence from euro area firm-level data that riskier firms have reduced their bond issuance since June 2022 more vigorously than other firms (Lane, 2023). Due to lags in the transmission of monetary policy, the effect of all of the recent increases in policy rates on financing costs has yet to fully materialise. As banks continue to pass through higher policy rates to households and corporates, financing conditions could tighten further in coming quarters, weighing on economic activity.
← 1. The literature emphasises three main transmission channels of monetary policy: the interest rate channel, the asset price channel and the credit channel (Bernanke and Gertler, 1995; Mishkin, 1996). The interest rate channel transmits changes in policy rates to retail lending and deposit rates via money markets, causing adjustments to investment and saving decisions. The asset price channel works through the prices of bonds, stocks and real estate, changing the effective cost of capital and the net worth of households and firms and thus affecting consumption and investment. Finally, the credit channel transmits monetary policy signals by influencing the balance sheets of banks, firms and households, and hence credit supply and demand.
← 2. In addition to changes in the monetary policy stance, bank lending rates can also reflect other factors, including exogenous changes in demand and supply conditions.
← 3. The size of the mark-up depends on several factors, including banks’ business models, balance sheet and leverage conditions, the degree of competition in the banking system, business cycle conditions and banks’ appetite for risk (Maravalle and Gonzalez Pandiella, 2022).
← 4. Income earned by banks on their activity of maturity transformation increased in 2022, enabling banks to rebuild profit margins after the pandemic. In contrast, data point to a renewed decline in bank profitability across a number of countries at the start of 2023.
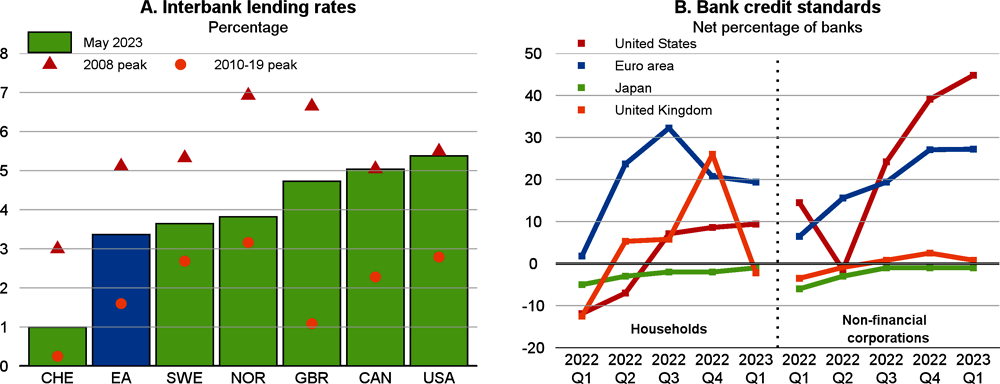
Note: Panel A shows 1-month interbank interest rates, and Panel B shows quarterly net percentages of credit standards from bank lending surveys in 2022 and in 2023Q1. In Panel B, net percentages are defined as the difference between the sum of the share of banks reporting a tightening in credit standards and the sum of the share of banks reporting a loosening of credit standards. A positive (negative) balance indicates tighter (easier) credit standards. For the United Kingdom, credit standards are proxied by inverted loans approved. For the United States, the United Kingdom and Japan, credit standards to non-financial corporations are for large firms.
Source: Bank of Canada; Bank of England; European Central Bank; Bank of Japan; Central Bank of Norway; Sveriges Riksbank; Swiss National Bank; Board of Governors of the Federal Reserve System; and OECD calculations.
Wider market conditions have been volatile, but the prices of risky assets have regained momentum in recent months. Rapid changes in market expectations about the future path of monetary policy have generated continued volatility in government bond markets (Figure 1.9, Panel A), surpassing the peak observed at the height of the pandemic. Foreign exchange market volatility has declined from its March 2023 peak, but remains elevated (Figure 1.9, Panel B). Aggregate equity price indices have risen in most countries since late 2022, and bank equity prices have recovered in most advanced economies from low levels in March. Ten-year government bond rates have edged down in the United States but have risen in the euro area and in the United Kingdom (Figure 1.10), and term spreads in sovereign bond markets have generally widened. Real long-term rates on government bonds remain lower than typically observed prior to the global financial crisis. Sovereign spreads also remain contained across the euro area, helped by the availability of the ECB’s Transmission Protection Instrument and flexibility across countries in Eurosystem bond reinvestments. However, corporate bond spreads have widened, especially on corporate bonds in the advanced economies that are below investment grade.
The US dollar has depreciated against most advanced and emerging-market currencies since November 2022 (Figure 1.10, Panel C), helped by narrowing policy interest differentials between the United States and other countries and market views that US policy rates might be close to a peak. This has helped to limit signs of financial stress in emerging-market economies. Equity price indices have risen a little in China, reflecting the reopening of the economy, but fallen in some energy exporters amid lower commodity prices (Figure 1.10, Panel A). Yields on local-currency government bonds have generally declined in major emerging-market economies (Figure 1.10, Panel B), but spreads over US government bonds remain elevated in countries characterised by high inflation or risk premia. Foreign-currency government bond spreads over US government bonds have also declined in most emerging-market economies, suggesting sovereign credit risk so far remains contained. Investment-grade corporate bond yields in emerging-market economies are still below their peak in 2022, but above their average for that year.
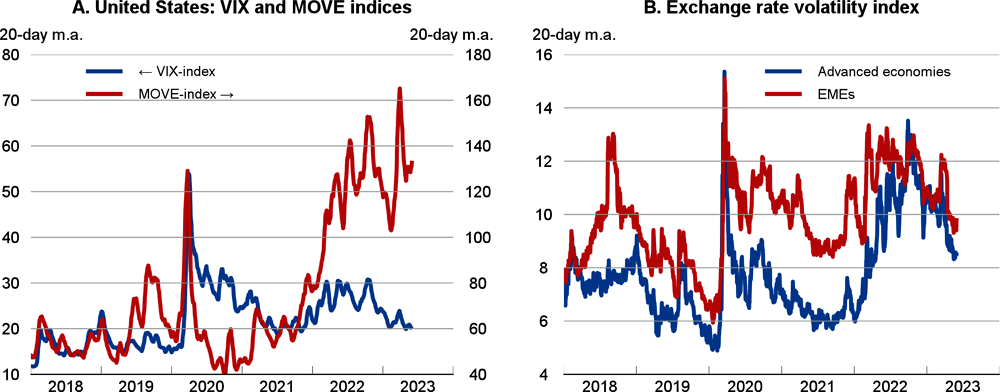
Note: In panel A, implied volatility as measured by the VIX index can be interpreted as the market expectation of risk (future volatility). The MOVE index is a yield curve weighted index of the normalised implied volatility on 1-month Treasury options which are weighted on the 2-, 5-, 10- and 30-year contracts. The panel B shows J.P. Morgan foreign exchange volatility indices for major advanced economies and emerging market economies. The indices are aggregates of implied volatility from foreign exchange options of a basket with 1-month, 3-month, 6-month, 9-month and 1-year maturities traded ‘at-the-market’.
Source: Federal Reserve Bank of St. Louis; Merrill Lynch Option Volatility Estimate; FactSet; and OECD calculations.
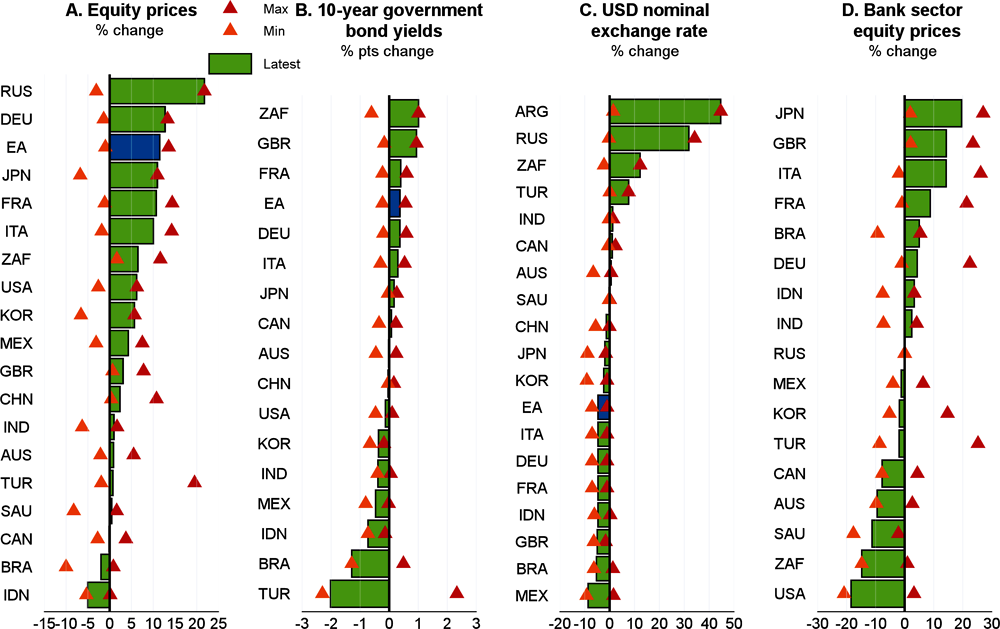
Note: “Latest” refers to the change between the average of November 2022 and the latest available data up to 2 June 2023. Maximum and Minimum refer to the biggest increases and falls from the average of November 2022. Based on a 10-day average of daily observations. Panel C: a positive value indicates a depreciation.
Source: OECD Exchange Rates database; FactSet; and OECD calculations.
Underlying inflationary pressures remain high
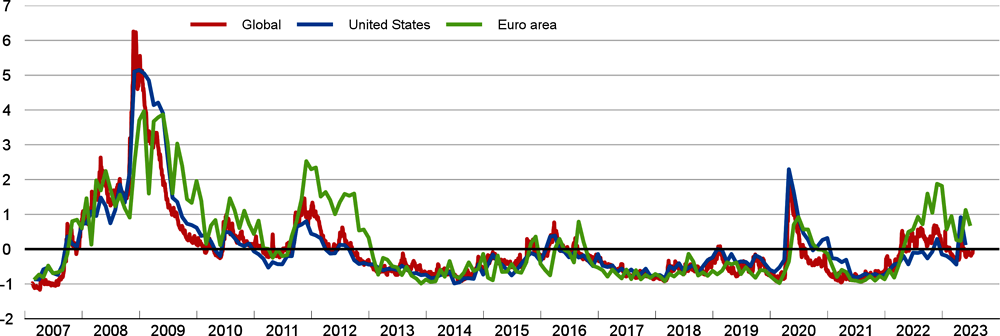
Headline inflation has fallen in most economies in recent months due to the downturn in energy prices, even though food product and services prices have continued to rise rapidly. However, core inflation – excluding food and energy – remains stubbornly high in many countries (Figure 1.11). Core inflation is dominated by services, and services price inflation tends to be less variable than goods price inflation and more dependent on labour costs. Some services prices are also adjusted infrequently. For example, the rental component of consumer prices (including the imputed rents of owner-occupiers in some countries) generally lags the movements in market rents (new rentals), as prices for existing rents are only changed gradually, often once a year.2 Rising services price inflation also reflects the ongoing normalisation of demand patterns after the sharp shifts seen in the first year of the pandemic. Demand for services has rebounded, converging towards the pre-pandemic path in many countries, while the earlier surge in goods demand, particularly for durable goods, has ebbed.
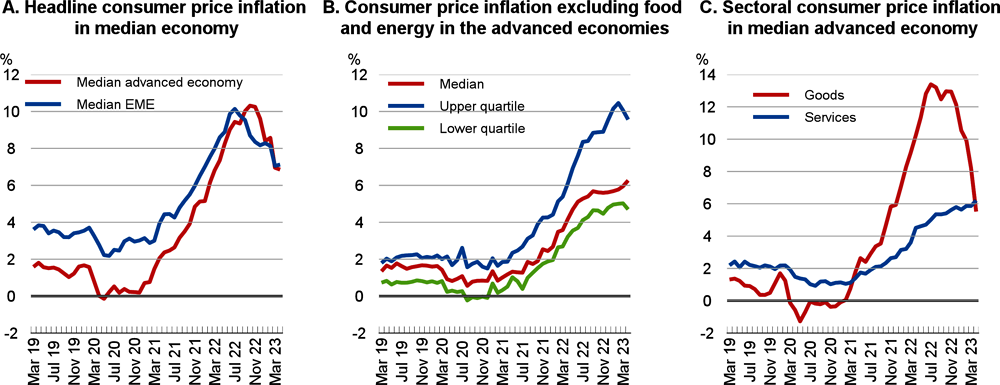
Note: Calculations using annual inflation rates up to April 2023. EME denotes emerging-market economies. Based on figures for 33 advanced economies and 16 emerging-market economies.
Source: OECD Consumer Price database; Australian Bureau of Statistics; Bureau of Economic Analysis (BEA); Eurostat; Ministry of Statistics and Programme Implementation, India; INEI, Peru; and OECD calculations.
The upsurge in inflation in 2021-22 has led to declines in real wages and, in many countries, household disposable incomes (Figure 1.15, Panel A). However, continued employment growth and fiscal policy support have helped to limit the overall drop in household disposable incomes in some countries, especially in Europe.3 The weakness of household incomes, and the associated pressures on household purchasing power, have prompted concerns that the high rates of inflation seen in the past year have been due in part to firms raising their profits rather than simply passing on higher input costs. A decomposition of the factors contributing to the rate of growth of the GDP deflator – an indicator of domestically-generated price pressures – suggests that increases in both unit profits and unit labour costs help to account for the upturn in inflation, albeit to a different extent across countries (Box 1.2). A significant part of the unit profits contribution has stemmed from profits in the energy and agriculture sectors, well above their share of the overall economy, but there have also been increases in profit contributions in manufacturing and services.
Despite the slowdown in output growth, labour markets generally remain tight across most OECD economies, with OECD-wide employment and labour participation rates reaching historic highs in the fourth quarter of 2022 and the OECD unemployment rate remaining at a low of 4.8% in March this year. Labour supply shortages, which point to a need for additional well-targeted reforms in some countries, and real wage declines have generated a pick-up in nominal wage agreements, though the pace has remained relatively moderate. Some signs of easing labour market pressures are now emerging in many advanced economies. The number of vacancies has started to decline from elevated levels, layoff rates are increasing, employment of temporary help services has declined, and nominal wage increases have generally levelled off and in some countries even begun to decline (Figure 1.15, Panel B).
The price of every good or service can be broken down into the unit cost of inputs bought from other firms and value added per unit, with the latter in turn being decomposable into profits per unit, unit labour costs, and unit taxes (net of subsidies). With the upsurge in inflation in 2021-22 creating a cost-of-living crisis in many countries, there has been much interest in whether this is mainly attributable to firms securing higher unit profits, to higher wages (pushing up unit labour costs), or to some combination of the two. This Box explores the contributions from these different components to domestically generated inflation, and also compares recent experience with that seen in the 1970s, an earlier period of high inflation.
The data needed to estimate the impact of changes in unit profits, unit labour costs and unit taxes on consumer prices are not generally available directly. However, this breakdown can be calculated for the GDP deflator using the income measure of GDP (Arce et al., 2023; European Commission, 2023). The change in the GDP deflator (GDP inflation) differs from consumer price inflation, as the composition of household consumption is different from the composition of domestic output. Notably, many OECD economies are net importers of fossil fuels and food, and energy and food prices increased dramatically in 2021-22. Thus, for these countries, consumer prices increased by much more than the GDP deflator over that period. Conversely, for oil and gas exporters, the prices of goods produced domestically and then exported rose rapidly, pushing GDP inflation above headline consumer price inflation.
A decomposition of GDP inflation thus gives only a partial picture of the aggregate contribution of profits and labour costs to headline consumer price inflation.1 Nevertheless, since the GDP deflator measures the price of domestic value added, GDP inflation is an indicator of domestically generated inflation, and can shed light on the extent to which headline inflation is domestically generated or imported.
Conducting this decomposition for a range of OECD economies yields a number of insights:
The recent period is characterised by more frequent simultaneous increases in the contributions to inflation from unit profits and unit labour costs, a phenomenon last seen in the 1970s.
A large part of the higher unit profits contribution originates from mining and utilities, even in commodity-importing economies.
The recent period – so far at least – is unlike the 1970s in that GDP inflation was generally much higher in the 1970s, notably on account of stronger increases in unit labour costs.
The decomposition of GDP inflation since 2019 for three commodity-exporting OECD economies (Australia, Canada and the United States) and six commodity importers is shown in Figure 1.12. As expected, the commodity exporters experienced higher GDP inflation over 2021-22 than the commodity importers.
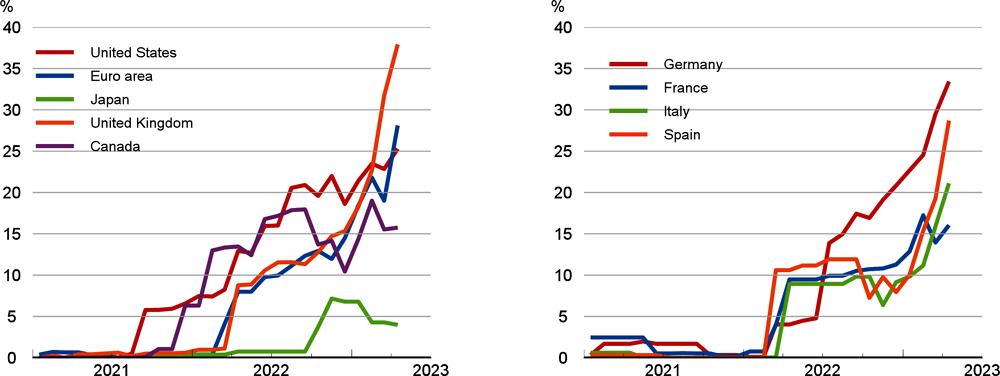
The contribution from unit profits was relatively stable in the last four quarters for the United States as well as for Germany, following several quarters of significant positive contributions.
In contrast, the contribution from unit profits has recently increased in many other European countries, including the aggregate euro area, France, Italy, Spain, and the United Kingdom.
The contribution from unit labour costs has recently risen in Australia, the euro area (including France, Germany and Italy), the United Kingdom and the United States.
While it is usually stable and small, the contribution from unit taxes was particularly volatile following the COVID-19 shock, reflecting pandemic-related subsidies that have subsequently been phased out and changes in the composition of expenditure, particularly household consumption.
Despite recent increases, the GDP inflation rate remains significantly below the levels seen in the 1970s, especially for commodity importers. In the oil crises of the 1970s, both unit labour costs and unit profits boosted GDP inflation to double-digit rates.2 In the current inflationary episode, the contribution of unit labour costs and, to a lesser extent, unit profits have been much smaller, especially for commodity importers.
The combination of rising unit labour costs and rising unit profits seen in 2021-22 for many countries, including Australia, Canada, the euro area (including Germany and Italy), the United Kingdom and the United States, is relatively unusual. Over the two decades prior to the pandemic, there was usually a negative correlation between unit profits and unit labour costs, with increases in one being partially absorbed by falls in the other. This relationship has weakened of late, with the median correlation amongst 17 OECD countries shrinking from -0.6 over 2000-19 (using quarterly data) to -0.2 over 2021-22, similar to the value for the decade 1971-81, another period characterised by large energy and food price shocks. This suggests that a period of rising input cost inflation may be conducive to unit profits and unit labour costs rising together, at least in nominal terms.
A key policy issue is whether the observed aggregate increase in unit profits reflects a generalised lack of competitive pressures throughout the economy, or specific factors that have contributed to strong profit growth in a few sectors or in a subset of firms. Moreover, an increase in unit profits (profits per unit of value added) does not necessarily entail higher profit margins (profits as a proportion of sales) as the increase of input costs (including intermediate consumption) can result in profits per unit of value-added moving differently to profits on gross output (or sales) (Colonna et al., 2023).
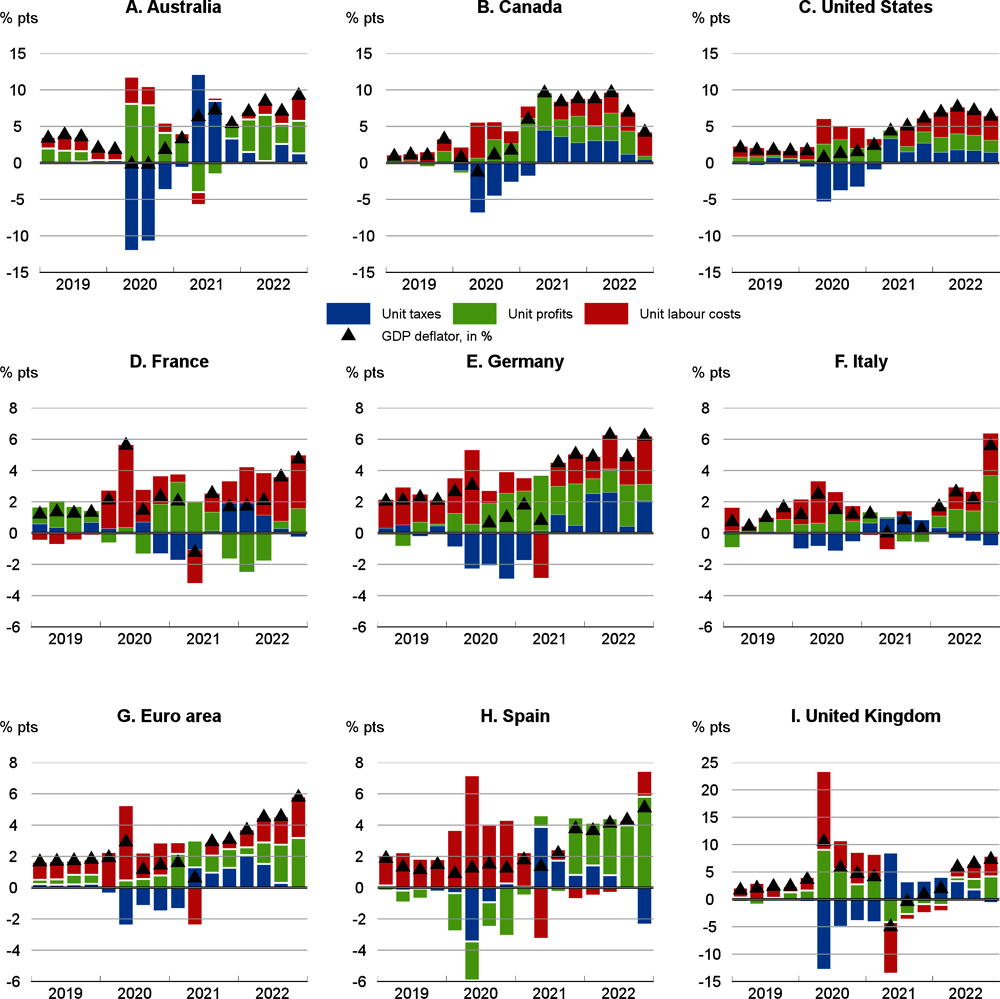
Note: GDP inflation is the rate of change in the GDP deflator at market prices. A small statistical discrepancy between the sum of the components and the GDP deflator is not shown. Unit taxes correspond to taxes on production net of subsidies per unit of real GDP; unit profits to gross operating surplus per unit of real GDP; and unit labour costs to compensation of employees per unit of real GDP. The published gross operating surplus data include mixed income, which incorporates the income of the self-employed. The calculations in this figure adjust the published gross operating surplus data by allocating part of self-employment incomes to unit labour costs, based on the assumption that the self-employed receive on average the same compensation per head as employees, following Schwellnus et al. (2018).
Source: OECD Economic Outlook 113 database; OECD Quarterly National Accounts database; and OECD calculations.
Evidence on the recent evolution of profit margins is mixed. Colonna et al. (2023) find that margins have risen in the United States and in non-tradeable sectors in Germany, and returned to pre-pandemic levels in Italy after an earlier decline. Weber and Wasner (2023), using firm-level data in the United States, argue that rising prices after COVID-19 were mainly the result of market power and implicit agreements between large firms. In contrast, Glover et al. (2023), suggest that the rise of mark-ups during 2021-22 was due to firms anticipating future cost increases rather than an increase in monopoly power or higher demand. A recent review of competition policy and inflation suggests that weaker competition may have contributed to the observed rise in cost pass-through and corporate profits (OECD, 2022c).
Indirect evidence that aggregate profitability has risen is provided by the evolution of the share of profits in GDP. In most advanced economies, the ratio of the gross operating surplus to GDP in 2022 was higher than in 2019 (Figure 1.13), implying that unit profits have risen faster than GDP inflation over this period.
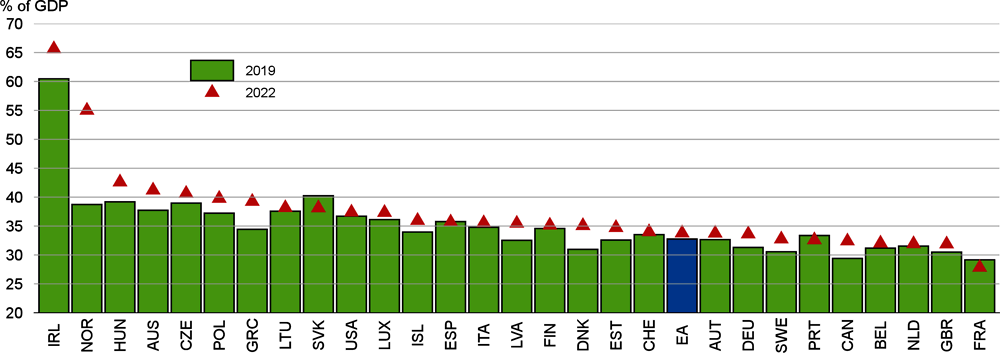
Note: The calculations in this figure adjust the published gross operating surplus data by removing the part of self-employment incomes that is estimated to reflect labour compensation rather than profits. This is done using the assumption that the self-employed receive on average the same labour compensation per head as employees, following Schwellnus et al (2018).
Source: OECD Economic Outlook 113 database; OECD Quarterly National Accounts database; and OECD calculations.
One indication of the extent to which rising aggregate unit profits reflects a broad-based increase in pricing power across sectors is to decompose the change in unit profits by sector. Doing this for the 13 OECD commodity-importing economies with an available sectoral breakdown of GDP, and computing unit profit as value added minus labour compensation and taxes, suggests that a disproportionate part of the observed increase of unit profits in 2022 came from mining and utilities: that is, mining and quarrying together with electricity, gas and water supply (Figure 1.14, Panel A). This sector accounts for only about 4% of the average economy but more than 40% of the rise of unit profits in 2022 as a whole. For commodity-importing countries this likely corresponds mainly to electricity and gas supply, including renewable electricity producers, who did not suffer from higher costs but benefited from higher retail prices. On a quarterly basis, the contribution of other sectors to the rise of unit profits gradually increased through 2022, with stronger effects from both manufacturing and services. The relatively small share of agriculture in the economy (less than 2% for the euro area) also masks a relatively large increase of the contribution of unit profits in this sector.
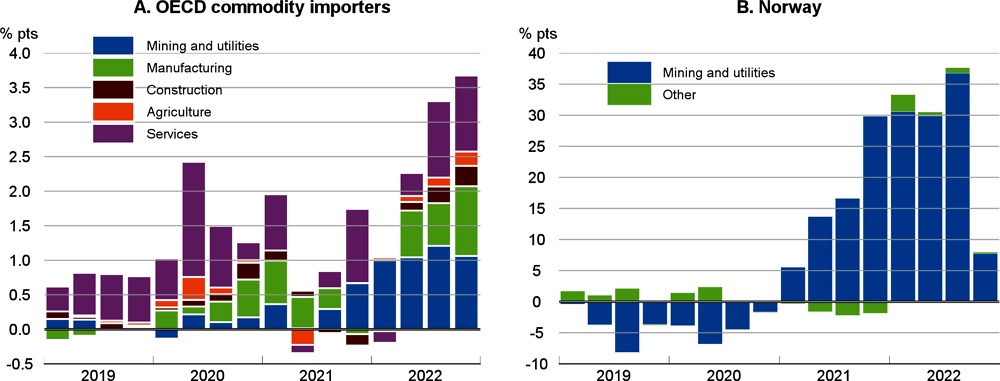
Note: Unit profits based on estimated sectoral gross operating surplus in current values. The latter is computed as sectoral output minus sectoral labour compensation and an estimate of unit taxes (based on the value at the macroeconomic level in per cent of GDP applied to sectoral GDP) and reconciled so that the sum across sectors equals the macroeconomic level. OECD commodity importers correspond to a simple average of Austria, Belgium, Denmark, Finland, France, Germany, Greece, Ireland, Italy, the Netherlands, Spain, Sweden and the United Kingdom.
Source: OECD Quarterly National Accounts database; and OECD calculations.
Due to an absence of compensation data by sector for most OECD commodity exporters, only Norway can shed some light on sectoral developments of unit profits for this group of countries. As expected, the bulk of the large increase in unit profits in Norway in 2022 came from mining and utilities (Figure 1.14, Panel B), with the contribution of unit profits to GDP inflation plummeting in 2022Q4 because of the global fall in energy prices. It is likely that mining similarly accounts for a large share of the rise in unit profits during 2021-22 in other commodity exporters such as Australia and Canada.
← 1. Diev et al. (2019) use an alternative approach that decomposes core CPI inflation instead of GDP inflation with some additional contributors to inflation (including the terms of trade excluding food and energy) but using the same definition of unit profits and unit labour costs. Haskel (2023) proposes a similar decomposition of headline CPI inflation.
← 2. There are a few countries in which the GDP deflator growth rate is relatively similar to the 1970s: for example, the average annual growth rate over 1971-81 in Germany was 5%, slightly below the value for 2022 (5.5%).
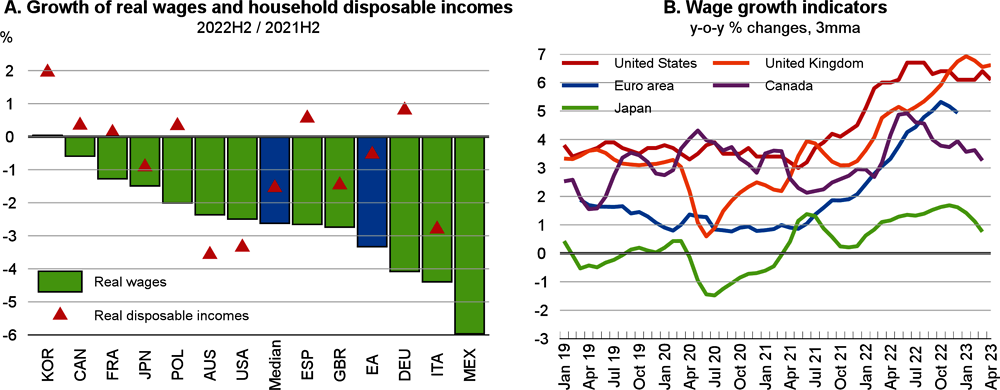
Note: Panel A shows compensation per employee deflated by the personal consumption expenditures deflator. The median is the median of all available OECD countries. Comparable data for household disposable income are not available for Mexico. In Panel B, wage indicators vary across countries. United States: median change in hourly wage of individuals observed 12 months apart; euro area: median of the annual change in wages and salaries advertised in job postings on Indeed; Japan: contractual earnings per employee for all establishments with 5 or more employees; Canada: fixed-weighted index of average hourly earnings for all employees; United Kingdom: median of annual pay growth for all individuals.
Source: OECD Economic Outlook 113 database; Federal Reserve Bank of Atlanta; Indeed; Ministry of Health, Labour and Welfare of Japan; Statistics Canada; Office for National Statistics; and OECD calculations.
Despite the signs of improvement seen in the early months of this year, the outlook is for a period of subdued growth and persisting inflation amidst acute risks. The full effects on output from the quick and synchronised tightening of monetary policy since the start of 2022 are likely to appear over the course of 2023 and early 2024, particularly on private investment. Central banks, faced with persistent above-target inflation, are expected to keep interest rates high, and most countries are set to adopt a tighter fiscal stance to start alleviating debt burdens worsened by the pandemic. However, stronger public investment, supported by NGEU grants, could provide some support to activity in many European countries. Household incomes remain under pressure, with lower energy and food commodity prices yet to be fully reflected in retail prices, although use of additional savings accumulated during the pandemic could help to cushion demand. The disruption from the war in Ukraine is also likely to continue to weigh on the global economy.
Global GDP growth in 2023 is projected to be 2.7% (Figure 1.16, Panel A), the lowest annual rate since the global financial crisis, with the exception of the pandemic-hit year of 2020. A modest improvement to 2.9% is foreseen for 2024, but this would still be a relatively poor outcome by historical standards. The slowdown in annual growth from 2022 masks a gradual improvement in the year-on-year growth of global activity over the course of 2023. This improvement partly reflects the fall in energy prices, but mainly stems from the emerging-market economies and the positive impetus provided by the rebound in China after fully reopening its economy. In addition, a disproportionate share of global growth in 2023-24 is expected to continue to come from Asia (Figure 1.16, Panel B). If the economic impact of China’s reopening is less than expected, a main pillar of global growth this year and next would be weakened.
Annual OECD GDP growth is projected to be below trend at 1.4% in both 2023 and 2024, although it will gradually pick up on a quarterly basis through 2024 as inflation moderates and real income growth strengthens. Business investment is projected to be nearly stagnant in the OECD area in 2023, and housing investment is projected to decline in many economies. Overall GDP growth is sustained by steady increases in private consumption and government final expenditure, the former being supported by continued, albeit modest declines in saving ratios on average across the OECD this year. Real wages, which fell in all major OECD economies in 2022, are projected to stop declining over the course of 2023 in most, and OECD-wide employment is projected to keep expanding in 2023-24, underpinning incomes. Any negative shocks to household sentiment or wealth, or a less benign evolution of the labour market, would yield weaker growth in consumption and output.
The prospects for individual major economies and regions are as follows.
In North America, the sharp rise in interest rates since late 2021 has been reflected in a slowdown in final domestic demand growth in both the United States and Canada. Housing investment has declined sharply, and business investment is showing signs of weakness. Lower saving rates and robust increases in employment are helping to maintain private consumption growth, but this is set to fade. Annual GDP growth in the United States is projected to be 1.6% this year, helped by strong carryover effects from late 2022, and 1.0% in 2024. Annual growth in Canada is projected to be 1.4% in both 2023 and 2024, supported by strong population growth and a resilient labour market. In both economies, the average annual growth numbers obscure a projected improvement in quarterly growth rates through the course of next year, helped by the moderation of inflation towards 2% by the end of 2024.
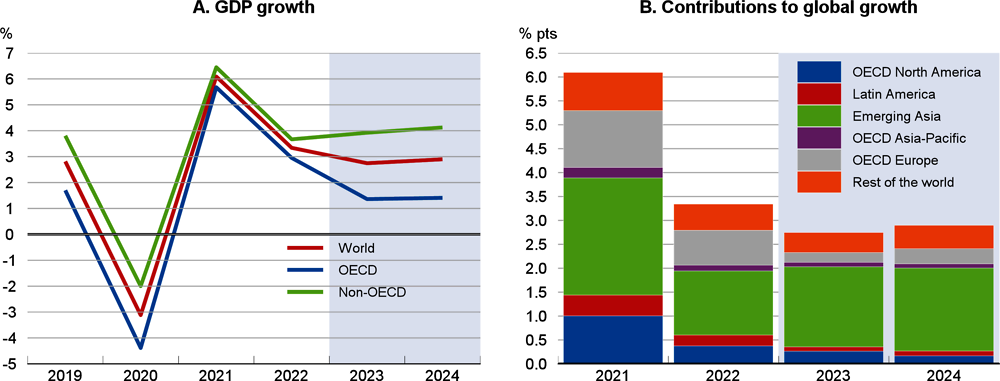
Note: In Panel B, Emerging Asia comprises China, India, Indonesia and the Dynamic Asian Economies (Hong Kong (China), Malaysia, Chinese Taipei, the Philippines, Singapore, Thailand and Viet Nam). Latin America comprises Argentina, Brazil, Chile, Colombia, Costa Rica, Mexico and Peru. Contributions calculated moving PPP shares of global GDP.
Source: OECD Economic Outlook 113 database; and OECD calculations.
Although inflation has increased in the major advanced Asian economies, it remains relatively mild. The reopening of China should also provide a boost to demand in the wider region. In Japan, monetary policy remains accommodative, and fiscal policy is set to be largely neutral this year before becoming less supportive in 2024. Policy support, together with signs of stronger wage growth, is projected to help GDP growth pick up to an above-trend pace of 1.3% in 2023 and 1.1% in 2024 and bring underlying inflation up towards 2% by the latter half of 2024. In contrast, macroeconomic policy is already tightening in Korea, and domestic demand growth is expected to remain relatively subdued amidst high debt service burdens. GDP growth is projected to be 1.5% in 2023 and 2.1% in 2024, with exports set to pick up with China’s recovery and an upturn in the tech cycle.
The major European economies have been strongly affected by the war in Ukraine, via elevated energy prices and heightened uncertainty. Macroeconomic policies are now becoming less supportive, with higher policy interest rates and fiscal consolidation underway. In the euro area, GDP growth is projected to be 0.9% in 2023. Tight labour markets, along with further declines in household saving rates should support private consumption, but higher financing costs and tighter credit standards will weigh on investment, despite the boost from higher spending under the NGEU programme. GDP growth is expected to pick up to 1.5% in 2024, helped by rising real incomes as inflation eases. Headline inflation in the euro area will fall quite quickly as food and energy inflation turns negative on a year-on-year basis, but core inflation is projected to be sticky, remaining close to 3% year-on-year in the last quarter of 2024. The current high dispersion of inflation across euro area countries is projected to moderate only gradually. The pattern of growth and inflation during 2023-24 is broadly similar for the United Kingdom, but the fiscal stance is tighter in both years, and export growth is expected to remain very weak. GDP growth is projected to be 0.3% in 2023 and pick up to 1% in 2024 as real income growth starts to improve. Annual headline and core inflation are projected to recede, but to still remain slightly above target at the end of 2024.
China is expected to see the sharpest positive shift in growth between 2022 and 2023 of any G20 economy, largely on account of the lifting of the government’s zero-COVID policy. GDP growth is projected to rise to 5.4% in 2023, and then ease to 5.1% in 2024 as the rebound associated with reopening fades. The shift in the anti-COVID policy has released pent-up demand for in-person services, lifted consumer confidence and alleviated the downturn in the property sector. China is unusual in having experienced little inflationary pressure during 2022, and consumer price inflation is projected to remain benign.
Over the past year, GDP growth has remained relatively strong, and close to potential, in India and Indonesia, but monetary policy has been tightened to lower inflation and fiscal policy is becoming less supportive. GDP growth in India is projected to ease to 6% in FY 2023-24, as tighter financial conditions hold back domestic demand, before picking up to 7% in FY 2024-25, helped by lower inflation and stronger external demand. Indonesia’s average annual growth is projected to remain close to 5% over 2023-24, underpinned by solid business and consumer confidence, and stronger international tourism from China.
After a strong rebound last year, growth will slow sharply in most Latin American economies in 2023, reflecting generally tight macroeconomic policies to tackle persistently high inflation, soft growth in export markets and lower prices for key export commodities. Output growth is projected to pick up in 2024 as inflation subsides, monetary policy becomes less restrictive and external demand strengthens. After the large boost from agricultural output in the first quarter of 2023, GDP growth in Brazil is projected to moderate, with annual growth of 1.7% in 2023 and 1.2% in 2024, as high real interest rates and weak credit growth hold back domestic demand, despite stronger social transfers.
Global trade growth is projected to slow alongside GDP growth in 2023 to 1.6%, in part due to carryover effects from the weakness in late 2022, before recovering to 3.8% in 2024. Lower commodity prices and the full reopening of China should help to support trade growth over next eighteen months, including in Europe (Figure 1.17, Panel A), although base effects will keep annual growth very low in 2023. The lagged effects of tight monetary policy will continue to be felt into 2024, particularly in the United States. The trade intensity of growth is set to decline in 2023, before recovering in 2024, as rising trade in OECD countries offsets the continued weakness in Chinese trade intensity (Figure 1.17, Panel B). Growth in the trade of services is expected to outperform goods, with the re-opening of the Chinese economy providing a substantial boost to international travel particularly in 2024.
The recovery in trade could be weaker if growth disappoints or possible second-round impacts from trade-related sanctions on Russia limit the pace of the trade rebound. However, if domestic demand picks up faster than expected, trade could recover faster, as supply chain pressures in manufacturing and shipping have mostly abated and estimates of spare capacity are high across most manufacturers. A faster-than-projected normalisation in China’s tourism market could also result in higher trade growth. Services import volumes in China in 2022 were still 26% lower than 2019 levels. International tourism estimates are still 20% below 2019 peaks, suggesting room for a full recovery if growth should surprise to the upside in 2023. If global travel services grew sufficiently to return to their share of global trade in 2019 (5.7%), it would boost the value of total trade by just over 1½ per cent in 2023.
A key question for the outlook is the extent to which the slowdown in output growth will push up unemployment rates. So far, despite many advanced economies having already had at least one quarter of negative GDP growth, unemployment has remained low and even continued to fall in some countries. Instead, two margins of adjustment to a weaker demand environment have been the number of job vacancies, which is now declining in many OECD economies, and hours worked, which have begun to move down in some countries. With the projected slowdown in demand growth expected to be relatively mild, unemployment is projected to rise only marginally during 2023-24, especially in the euro area. The OECD-wide unemployment rate is expected to increase from 4.9% at the end of 2022 to 5.2% in the fourth quarter of 2024, though with relatively large rises of around ¾ percentage point or more in Australia, New Zealand, the United Kingdom and the United States. With labour markets generally expected to remain tight, and with workers having experienced falls in real wages in 2022, nominal wage growth is projected to be just over 4% in the overall OECD area in 2023, before moderating to around 3½ per cent in 2024.
Helped by the decline in energy prices over the past few months, average annual headline inflation in the OECD as a whole is now projected to fall relatively quickly from 9.4% in 2022 to 6.6% in 2023 and 4.3% in 2024, with year-on-year inflation in the last quarter of 2024 down to 3.8% (Figure 1.18).4 In the major advanced economies, annual inflation is projected to be closer to target, at just over 2¼ per cent by the fourth quarter of 2024. The projected fall in OECD core inflation is shallower, reflecting the stickiness of many prices and a slow adjustment of margins and cost pressures. Core inflation is projected to ease from 6.6% in 2022 to 6.5% in 2023 and 4.5% in 2024 on an annual average basis.
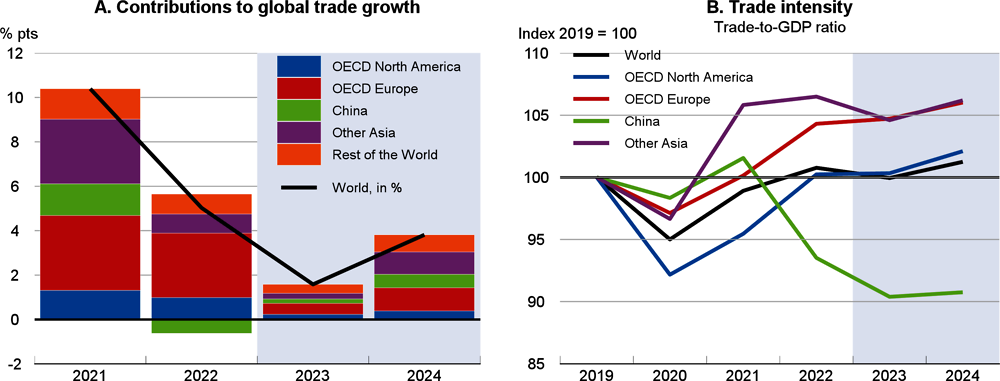
Note: The OECD North America includes Canada and the United States; Other Asia includes Japan, Korea, the Dynamic Asian Economies (Hong Kong (China), Malaysia, Chinese Taipei, the Philippines, Singapore, Thailand and Viet Nam), India and Indonesia.
Source: OECD Economic Outlook 113 database; and OECD calculations.
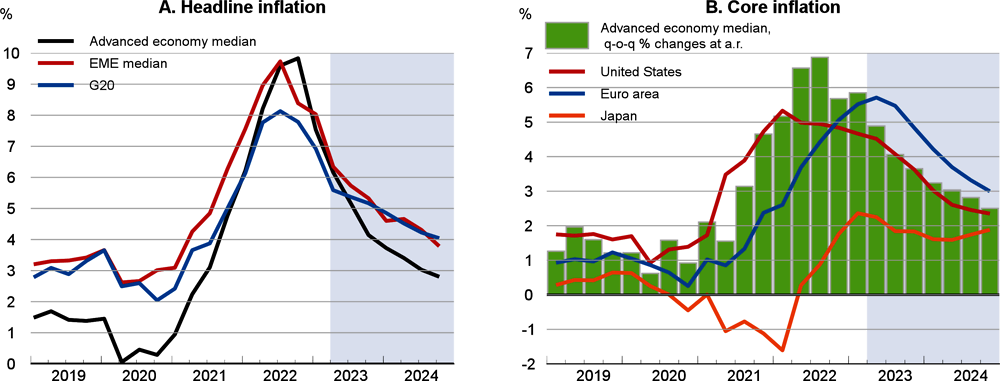
Note: Advanced Economy median and EME median denote the median inflation rate in the advanced economies and the emerging-market economies respectively. Based on projections for 34 advanced economies and 16 emerging-market economies.
Source: OECD Economic Outlook 113 database; and OECD calculations.
Inflation could be more persistent than expected, with interest rates being higher for longer
Over the past eighteen months or so, underlying inflation has consistently proved to be higher than projected. The large shocks that have affected the global economy and the range of factors contributing to higher inflation, both on the demand and the supply side, have made it difficult to assess the speed at which inflation pressures may recede. Relatedly, after an extended period of low interest rates, there is considerable uncertainty concerning the impact of the monetary tightening that has already occurred. If the rise in interest rates has smaller-than-expected and/or delayed effects, or cost pressures moderate less rapidly than expected, or firms try to raise price-cost markups, inflation will be higher than projected. In such circumstances, monetary policy will have to be tightened further and perhaps kept restrictive for longer, with negative implications for growth and employment and greater risks for financial stability.
The extended period of high inflation has already resulted in a rising share of items in consumer price baskets that have had annual price rises of more than 5% for at least 12 months. This share has gone from near zero at the beginning of 2021 to around a quarter on average by April 2023, and to a third or more in Germany and the United Kingdom (Figure 1.19). Delays in getting inflation down would be likely to raise these shares further, intensifying the challenges of lowering inflation, increasing the risks of market and private sector inflation expectations settling at levels well above inflation objectives, and possibly also prompting a drift towards greater indexation of contracts and financial assets. In these cases, inflation would likely prove more persistent than projected.
Note: Inflation based on the personal consumption expenditures deflator in the United States, harmonised consumer price indices in the euro area and the United Kingdom, and national consumer price indices elsewhere.
Source: Bureau of Economic Analysis; Eurostat; Statistics Bureau of Japan; Office for National Statistics; Statistics Canada; and OECD calculations.
Other factors might also contribute to inflation persistence. Notably, an aggravation or spreading of the conflict in Ukraine could yet give new upward impetus to energy and food prices. Likewise, a stronger-than-expected rebound of the global economy this year could push up a range of commodity prices and hinder the downward move in inflation. Again, policy rates would be likely to be kept higher for longer than projected, with a higher probability of a widespread and harmful economic slowdown and enhanced risks of financial stress.
Tighter financial conditions could trigger stress in financial markets
Tighter financial conditions are to be expected as monetary policy becomes more restrictive, and are a standard channel through which policy affects output and inflation. Nonetheless, there are risks that an abrupt tightening of financing conditions could trigger widespread financial stress and undermine stability as investors rapidly reassess exposures to liquidity, duration and credit risks. Key concerns are that renewed fragilities could appear in the banking sector, resulting in a broader loss of confidence and a sharp contraction of credit, and a heightening of risks from liquidity mismatch and leverage in non-bank financial institutions (NBFIs).
Collectively, the banking system appears more resilient than before the global financial crisis, with post-crisis regulatory reforms strengthening capital and liquidity positions, and the largest banks being subject to more stringent stress tests. Large systemically important banks in advanced economies appear to be liquid and adequately capitalised, although market confidence remains fragile, as shown by the speed at which banking sector pressures spread across countries following bank failures in the United States in March. Moreover, capital ratios stand above regulatory minima, non-performing loans (NPLs) remain low, and recent stress tests suggest that large banks are generally well positioned to cope with fast rising interest rates and a flattening of yield curves (IMF, 2022a; ECB, 2022).
Nonetheless, recent episodes in the United States and Europe suggest that in an environment of fast-rising interest rates, banks can be exposed to severe duration and liquidity risks if large deposit outflows occur. Deposit growth has slowed in the large advanced economies since early 2021 and in many has recently become negative (Figure 1.20). With bond yields rising fast, savers can get higher returns by moving deposits away from banks and towards money market funds (MMFs), as seen in past episodes of policy tightening (Paul, 2022).
Duration risks can arise if the value of fixed-income securities falls as a result of higher interest rates. While losses may only be realised over time, they can materialise rapidly if banks have to sell bonds to meet unexpected deposit outflows. In addition, liquidity risks can become manifest for banks with low liquid assets and large short-term liabilities. While liquidity mismatches vary widely across countries, banks in Mexico and the United States tend to have comparatively high ratios of short-term liabilities to liquid assets and therefore might be more vulnerable to liquidity risks triggered by large deposit outflows (Figure 1.21, Panel A). Banks in Mexico, the United States and some European countries could also be potentially vulnerable to duration risks, given their comparatively high, albeit often declining, share of government bonds in total assets (Figure 1.21, Panel B). The prospect of large losses by banks and poor liquidity conditions can lead to a sharp repricing of bank risk and higher bank funding costs, pushing banks to tighten lending conditions to households and companies.
Banks could also face pressures from rising credit losses if firms and households struggle to repay their debts, which in turn would significantly reduce the supply of new credit available for households and companies. In a number of countries, private sector debt-service ratios in 2022 were already above those in the early 2000s, when interest rates last rose sharply (OECD, 2022b). The share of borrowers unable to service debt payments could increase as rising policy rates are passed through to lending conditions, particularly in countries in which private debt levels are elevated and in which a sizeable share of debt is at variable interest rates.
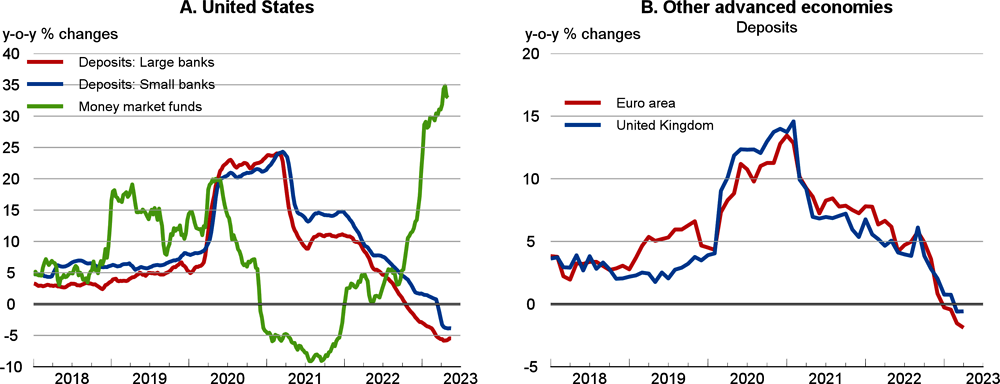
Note: Year-on-year growth rates of outstanding deposits at US banks are 4-week moving averages. Money market funds data are for retail money market funds. Large US banks are chartered banks that have consolidated assets of USD 300 million or more. Small banks are chartered banks with consolidated assets of less than USD 300 million. Last data point for US deposits is 17 May, and for US money market funds is 3 May. Data for the euro area and the United Kingdom are monthly and for US deposits and money market funds weekly.
Source: Board of Governors of the Federal Reserve System; European Central Bank; Bank of England; and OECD calculations.
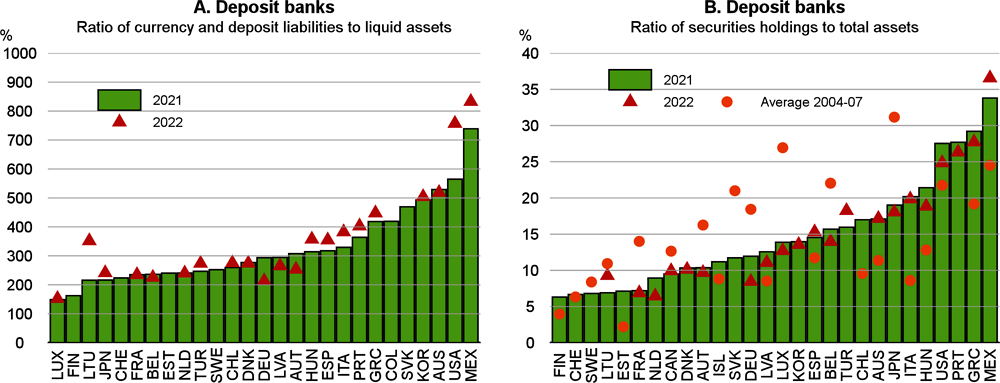
Note: For Panel A, the ratio is computed as currency and deposit liabilities (including interbank liabilities) over the sum of liquid assets: currency and deposits, and short-term debt securities. For Panel B, the data are for end-2021 and 2022 Q4 or the latest available quarter in 2022.
Source: OECD National Accounts database; OECD Financial Accounts database; and OECD calculations.
A sharp correction in house prices or commercial real estate (CRE) prices could also exacerbate household and corporate solvency risks, leading to large potential losses for banks. CRE transaction activity has declined globally (IMF, 2023), and CRE prices have started to decline in the major advanced economies. By the fourth quarter of 2022, CRE prices were 1.8% and 2.9% below their most recent peaks in the United States and the euro area respectively, and monthly indicators based on Real Estate Investment Fund valuations point to further sharp declines in values this year. In the event of severe stress in property markets, banks could be forced to realise losses on loan portfolios if there were fire sales or foreclosures on a large scale, reducing the value of available collateral. A sharp repricing of CRE could weigh heavily on US regional bank balance sheets, as they account for a sizeable share of lending to the sector (FDIC, 2022). In addition, there have already been some signs of asset quality deterioration, amid rising bankruptcies and delinquency rates for mortgage loans in several countries (FOMC, 2023; Eurostat, 2023; Sveriges Riksbank, 2022), which may require higher loss provisions and force banks to take steps to replenish their capital positions.
There are also broader indications that corporate bankruptcies have begun to increase in many countries, including in Europe, after a long period when they were at unusually low levels helped by pandemic-related support from governments. While a higher level of business failures is not surprising given the higher energy costs and debt servicing costs that firms face, a sharp acceleration could also place an additional source of stress on the balance sheets of lenders, including NBFIs.
Non-bank financial institutions now account for around 50% of global financial assets (FSB, 2022a), a significantly larger share than before the global financial crisis. Credit to firms by NBFIs in 2022 accounted for 20% of total outstanding loans to non-financial corporations in the euro area and 50% in the United Kingdom (ESRB, 2022; IMF, 2022a). NBFIs’ provision of credit to households has also risen. For example, in 2021 more than 70% of mortgages were originated by NBFIs in the United States (Federal Reserve, 2022), NBFIs are particularly exposed to risks from liquidity mismatch and the use of derivatives and other forms of leverage to fund investments in illiquid assets (Bank for International Settlements, 2021). These institutions could come under stress in an environment of rising interest rates and declining asset prices if they are forced to realise large mark-to-market losses on their assets to try and meet sizeable margin calls on leveraged trades (due to the decline in collateral values). Such a scenario would be likely to further destabilise asset markets in the absence of prompt policy action. In addition, if NBFIs are forced to sell assets to accommodate outflows, a negative spiral could kick in, amplifying adverse market dynamics and generating a further tightening of financing conditions for non-financial corporations.
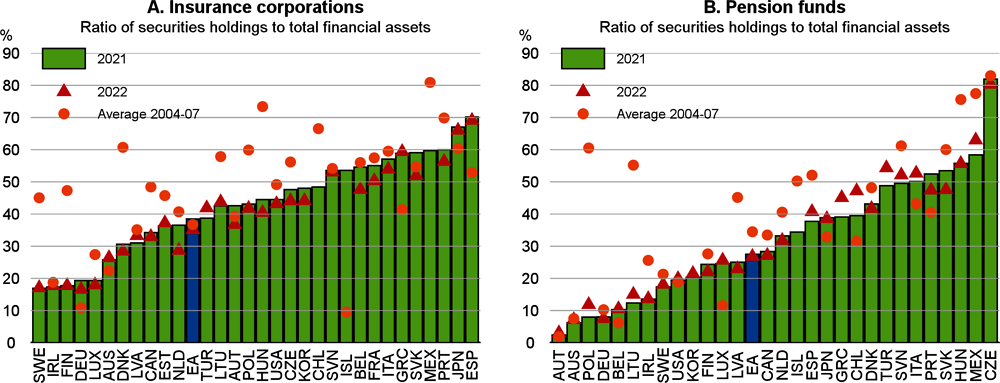
In many OECD countries, holdings of debt securities by MMFs and insurance companies stand at above 50% of total financial assets (Figure 1.22). Pension funds and financial companies engaged in securitisation could also be vulnerable given their use of leverage (ESRB, 2022). Further efforts are also needed to enhance the resilience of MMFs. Such funds could be vulnerable to large redemption calls and may face challenges in selling assets under stressed conditions (FSB, 2022b; Federal Reserve, 2023). Real estate investment funds could also incur severe losses if housing prices undergo sharp corrections (Daly et al., 2023).5
Illustrative scenarios, using the NiGEM global macroeconomic model, highlight the potential implications for growth if financial stress were to result in the cost of finance for households and firms rising by more than expected in the advanced economies. The scenarios consider three particular financial shocks, a rise of 1 percentage point in the wedge between household borrowing and lending rates, a rise of 1 percentage point in the user cost of capital due to higher funding costs, and a rise of 50 basis points in equity risk premia. These shocks are largely between one-quarter and one-half of the corresponding changes seen in past stress episodes, although this varies across countries. In contrast to the global financial crisis, the shocks are not assumed to spread directly into financial conditions in the emerging-market economies, and credit remains available to households and firms but at a higher price than before. The illustrative shocks are assumed to apply in the latter half of 2023 and in 2024 before fading, and are treated as unanticipated shocks for firms, households and financial markets.
In a scenario of this kind, for given policy settings, growth in the OECD economies could be lowered by around 1¼ percentage point in 2024, with global GDP growth reduced by almost 1 percentage point (Figure 1.23). This would push many advanced economies into or close to recession given the baseline projections for 2024. Higher financing costs would hit incomes, asset prices and domestic demand, with private sector investment declining by close to 7% relative to baseline in the advanced economies in 2024, equity prices dropping by close to 10% and unemployment rising by around ½ percentage point in the major economies. Inflationary pressures would also ease, by around 0.4 percentage points in the OECD economies in 2024. The emerging-market economies would be adversely affected due to weaker demand from the advanced economies, with growth in the non-OECD area declining by around 0.7 percentage points in 2024. If tighter financial conditions were to hit confidence, or generate significant stress in particular financial market segments, the adverse effects of the shocks would be stronger.
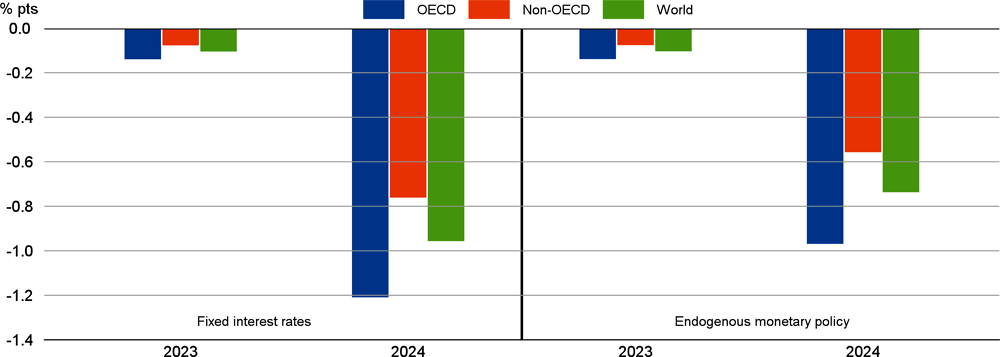
Note: Illustrative scenarios with a rise of 1 percentage point in the wedge between household borrowing and lending rates, a rise of 1 percentage point in the user cost of capital, and a rise of 50 basis points in equity risk premia in all advanced economies from 2023Q3. Policy interest rates are held unchanged in all countries in the first scenario, but allowed to react in the second scenario.
Source: OECD calculations using the NiGEM macroeconomic model.
Macroeconomic policies can help to cushion part of these shocks. In particular, lower policy interest rates would mitigate the shocks, with the adverse impact on global GDP growth in 2024 reduced by around one-quarter. In the typical economy, policy interest rates are lowered by around 50 basis points in 2024, relative to baseline. An additional offset could be provided by fiscal policy if the automatic fiscal stabilisers were also allowed to operate fully in all countries, with budget deficit-to-GDP ratios rising relative to plans. Even in the absence of such a fiscal adjustment, the government debt-to-GDP ratio is around 2 percentage points higher by the end of 2024 in the median advanced economy (due to the lower level of GDP).
Tighter financial conditions could exacerbate vulnerabilities in emerging-market economies
Since November 2022, financial market conditions in emerging-market economies have been broadly stable. The appreciation of the US dollar has come to a halt, the reopening of China has boosted the growth prospects of some commodity exporters, and the spillovers from the recent banking stress in major advanced economies have been limited, with sovereign and corporate bond yields changing only marginally. However, increased financial market volatility, higher external indebtedness and large bank exposures to domestic sovereign debt are aggravating vulnerabilities in emerging-market and developing economies. Several low-income countries have faced increasingly tight financing conditions, with a rising debt service burden due to higher sovereign spreads and greater reliance on USD-denominated debt. In the medium run, climate-related risks could also dampen growth prospects and increase inflationary pressures in emerging-market and developing economies.
Emerging-market and developing economy sovereign debt issuance declined by about 7% (USD 300 billion) in 2022 (OECD, 2023d). Corporate debt issuance has also declined (World Bank, 2023) and portfolio inflows have slowed, with higher yields available in the advanced economies (Figure 1.24, Panel A).6 Foreign-currency sovereign bond spreads and corporate bond yields have risen recently in all regions since early March, although they generally remain below the peaks seen in 2022 (Figure 1.24, Panels B and C). The pressures have been strongest in highly indebted low-income countries, many of whom are now in sovereign debt distress. About one-quarter of 62 emerging-market and developing economies now have a foreign-currency sovereign bond spread of more than 10 percentage points (Figure 1.24, Panel D) and more than 40% of sovereign debt is due within the next three years in low-income emerging-market and developing economies (OECD, 2023d).7
External debt and the exposure of domestic banking sectors to domestic government bonds have increased in emerging-market economies since the global financial crisis, although the nature of risks differs across economies.
Among the countries with high external debt (Figure 1.25, Panel A), Argentina, Chile, Colombia, Malaysia, South Africa and Türkiye had short-term financing needs – defined as the sum of short-term debt due on a residual maturity basis and the cumulative current account deficit 12 months ahead – of more than 15 percentage points of GDP in 2022 (IMF, 2022b). The current account deficit widened by 0.8 percentage points of GDP in 2022 in the median emerging-market economy, and by more in commodity importers, with most of this deterioration driven by a worsening of the trade balance.8
In addition, some countries with relatively high external debt, such as Costa Rica, Colombia, Malaysia and Romania, also experienced a sharp decline in their investment income balance. FDI inflows declined by 35% in the G20 emerging-market economies in 2022 (OECD, 2023c) although they have remained large enough to cover a sizeable portion of current account deficits in several Latin American countries, including Brazil, Colombia and Mexico. In other countries, there are risks of greater reliance on short-term external financing, potentially raising exposure to rollover risk.
In countries where the banking system exposure to the government is large, such as Argentina and Egypt (Figure 1.25, Panel B), a loss of confidence or higher perceived sovereign risk would raise risks of an adverse feedback loop between sovereign and bank balance sheets.9 This would also hinder private sector financing and growth, given that banks have been the main source of credit in emerging-market economies (Ehlers and Víllar, 2015).
In addition to potential financial tensions, emerging-market and developing economies continue to face medium-term climate-related risks, such as droughts, which could hurt growth prospects and reignite inflationary pressures (Kabundi et al., 2022). In particular, the higher share of food in consumption baskets (OECD, 2022a), continued pressures on food security, and lower resilience to extreme climate events in emerging-market and developing economies could lead to protracted inflationary effects (Faccia et al., 2021).
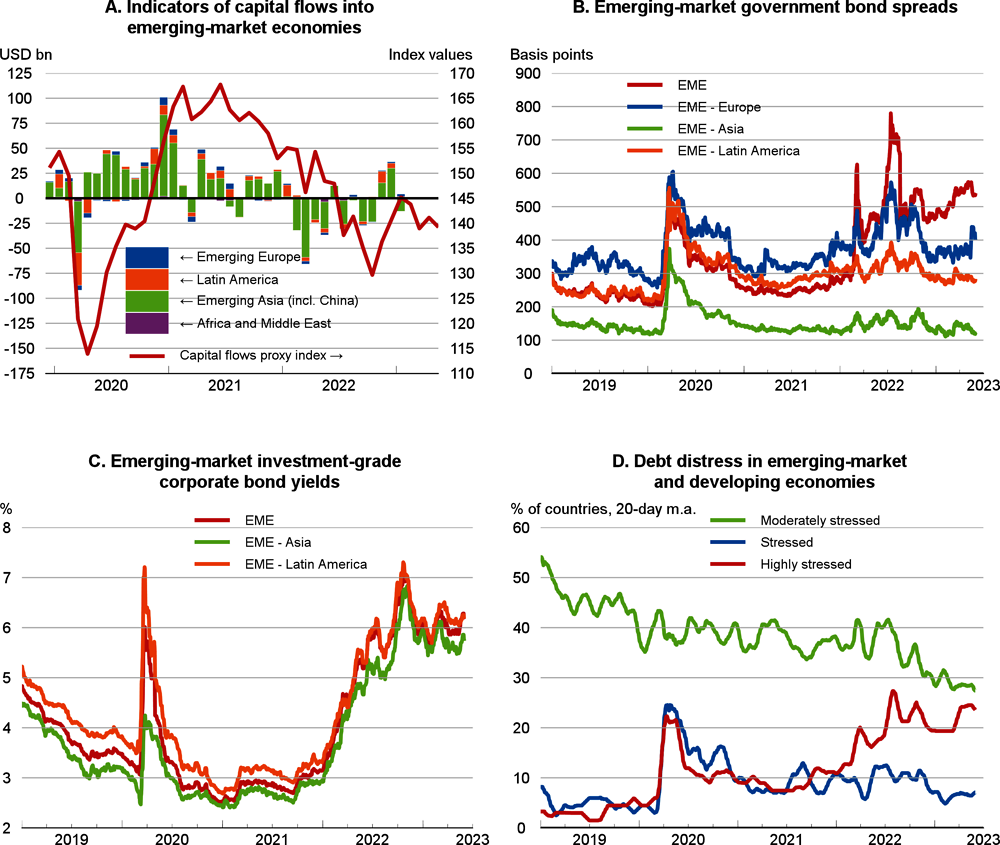
Note: Panel A shows the gross portfolio inflows data from the OECD Monthly Capital Flow dataset for 21 emerging-market economies grouped by four geographical areas and the Bloomberg proxy index of capital flows. The latter is a monthly composite index, reflecting the performance of commodity, equity, foreign-currency-denominated government bond and currency asset classes. Increasing (decreasing) values of the index indicate capital flows into (out of) emerging-market economies. Panel B shows unweighted regional averages for the JP Morgan EMBI global bond spread, a measure of the sovereign risk spread of USD-denominated emerging-market economy government bonds over US government bonds. 'EME - Europe' covers Romania and Türkiye. 'EME - Asia' covers China, Indonesia, India, Malaysia, the Philippines and Viet Nam. 'EME - Latin America' covers Brazil, Chile, Colombia, Costa Rica, Mexico and Peru. The ‘EME’ aggregate covers all mentioned countries plus South Africa and Ukraine. Panel C shows unweighted regional averages for the ICE Bank of America Investment Grade Emerging Markets Corporate Plus Issuers yield. 'EME - Asia' covers China, Indonesia, India, Malaysia and Thailand. 'EME - Latin America' covers Brazil, Chile, Colombia, Mexico and Peru. The 'EME' aggregate also includes South Africa and Türkiye. In Panel D, countries are classified as 'Moderately stressed' if the JP Morgan EMBI global bond spread is between 300 and 700 basis points; 'Stressed' if the resulting spread is between 700 and 1000 basis points; and 'Highly stressed' if the resulting spread is greater than or equal to 1000 basis points. Based on 62 emerging-market and developing economies.
Source: OECD Monthly Capital Flow dataset; Bloomberg; FactSet; and OECD calculations.
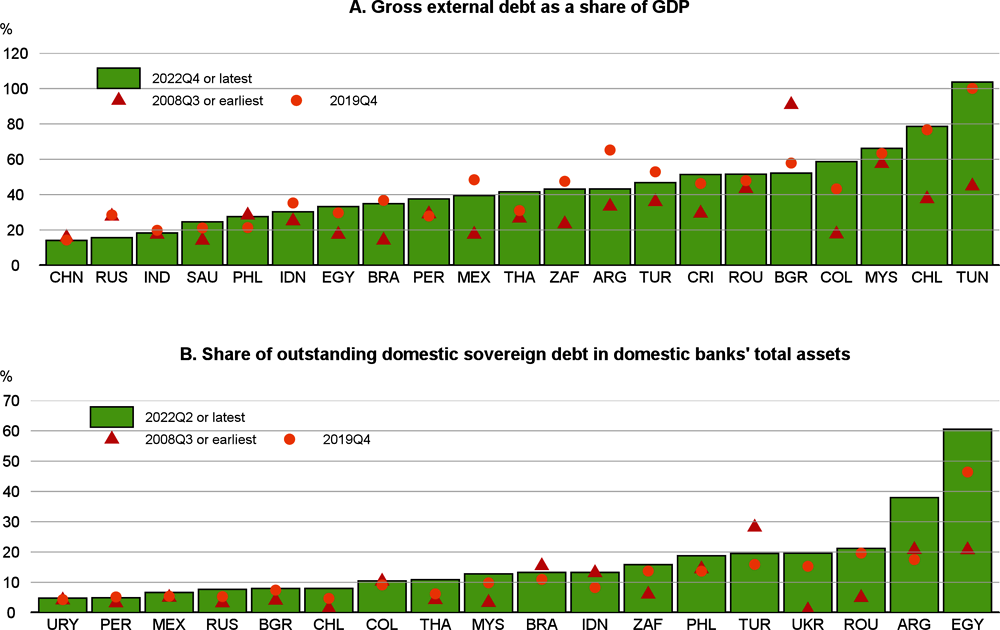
Note: In Panel A, local-currency denominated GDP figures are converted to USD using market exchange rates. Red triangles show 2015Q1 data for China, 2012Q1 data for Malaysia, 2010Q3 data for the Philippines and 2017Q1 data for Saudi Arabia. In Panel B, total bank assets are defined as the sum of claims of domestic depository corporations on domestic borrowers and non-resident borrowers. Bars show 2022Q1 data for Peru and 2021Q4 data for Russia. Triangle shows 2017Q1 data for Argentina.
Source: OECD Economic Outlook 113 database; World Bank Quarterly External Debt Statistics database; IMF Sovereign Debt Investor Base dataset; IMF International Financial Statistics; and OECD calculations.
Risks from energy markets have not disappeared
In Europe, the risk of a critical shortage of energy supplies has diminished but not disappeared. Gas storage levels are near record levels for the time of year, contrary to earlier fears. Consumption has declined sharply in the face of record high prices, down by 17.7% in the EU in the eight months to March 2023, helped by warm weather during the Northern Hemisphere winter, investments in energy efficiency, and lower output from some energy-intensive industries. Liquefied natural gas (LNG) imports also remain at high levels, helped by new offshore storage capacity in some countries. There are also some residual imports by pipeline from Russia. Nonetheless, some challenges remain in securing sufficient storage levels for the 2023-24 winter. Supply from Russia in 2023 is likely to be minimal, in contrast to the early months of 2022, and a potential rebound in demand in China would increase competition for tight global LNG supply. This could push up energy prices once again, resulting in a renewed spike in consumer prices and further economic dislocation. Risks of higher prices also remain in oil markets, given continued uncertainty as to how output cuts by OPEC producers and Western sanctions on crude oil and oil products from Russia will affect global supply through the course of 2023.
Upside risks
While the balance of risks is skewed towards slower global growth and/or more persistent pressure on inflation, there is also a range of factors that could lead to more favourable macroeconomic outcomes.
The dynamics of growth, employment and inflation since 2020 have largely reflected forces associated with the pandemic, including the policy responses to it. The exceptional nature of that episode and the reopening of economies means that there is necessarily a great deal of uncertainty about how those dynamics will evolve. In particular, stronger labour force growth than projected would boost output and facilitate disinflation. After a virtual freezing of international migration during the first phase of the pandemic, migration flows to a number of advanced economies have been very large, in part reflecting a catch-up from the interruption in 2020-21. A continuation of similar net inflows would push labour force growth in these countries above what is projected. There are also a number of countries, including the United States and the United Kingdom, where there is scope for more people to enter the labour force as reductions in domestic labour supply resulting from the pandemic are unwound.
Another feature of pandemic-era labour markets in many economies has been the exceptionally high number of vacancies, often greatly exceeding the number of those looking for work. If labour demand can be cooled by a reduction in the excess of vacancies over jobseekers, with little if any increase in unemployment rates, then a given amount of disinflation can be achieved with more economic growth than otherwise. Relatedly, the ongoing unwinding of the shifts in the composition of demand associated with the pandemic (initially towards goods and subsequently towards services) could proceed more quickly and smoothly than expected, helping to moderate the currently persistent upward pressure on services price inflation.
Among emerging-market economies, one source of possible upside risks is that better financial conditions could support investment, including foreign direct investment (FDI), and private sector balance sheets. This would boost overall investment and growth prospects and help to reduce the vulnerability of countries to sudden stops or reversals of capital inflows.
In addition, there are a number of possible shocks that could be favourable for growth while worsening the inflation outlook or vice versa. For example, a faltering of China’s expected rebound this year, or stronger-than-expected effects from tighter monetary policy would likely help to bring down global inflationary pressures more quickly than projected, but would also weaken global growth. On the other side, if remaining pandemic-era excess savings are greater than estimated or if they are run down faster than projected, that would be positive for growth but would hinder the pace of disinflation.
Persisting inflationary pressures, modest growth prospects and significant downside risks generate difficult challenges for policymakers. High interest rates will be needed for some time to come to ensure that inflationary pressures are durably reduced. In the event of additional financial market stress, central banks will need to make full use of the financial policy tools available to ensure adequate liquidity and minimise contagion risks. Lower energy prices and the upgrading of social benefits for past inflation mean that fiscal policy support to mitigate the impact of higher food and energy costs should be targeted only on vulnerable households inadequately covered by the general social protection system. This would reinforce incentives to reduce energy use and provide support to monetary policy in dealing with inflation. With government debt higher than prior to the pandemic in most countries, and governments facing future spending needs due to ageing and the climate transition, greater attention should be paid to ensuring debt sustainability. Rebuilding fiscal space is essential to conserve scarce resources to meet future policy priorities and respond effectively to future shocks. Stronger efforts are needed in all economies to address key structural challenges, including population ageing, climate change and digitalisation. Given the scale and ubiquity of these challenges, bold and sustained reforms will be needed to simultaneously reinvigorate growth and improve the quality of growth.
In advanced economies, monetary policy needs to remain restrictive for some time
Most central banks in advanced economies have continued to tighten monetary policy in recent months, even in the aftermath of the financial market turbulence in March. Policy rate increases have nonetheless tended to become smaller, and some banks have announced a pause to assess the impact of the cumulative tightening already delivered, as forward-looking real short-term interest rates have generally now become positive. Many central banks are also now reducing securities holdings, either by not (or not fully) reinvesting the proceeds of maturing bonds (passive quantitative tightening, QT) or by selling bonds (active QT). This has helped to reduce the size of central bank balance sheets in most advanced economies, although the need for enhanced liquidity provision in the wake of the banking stress in March temporarily pushed up central bank assets in some jurisdictions (Figure 1.26).
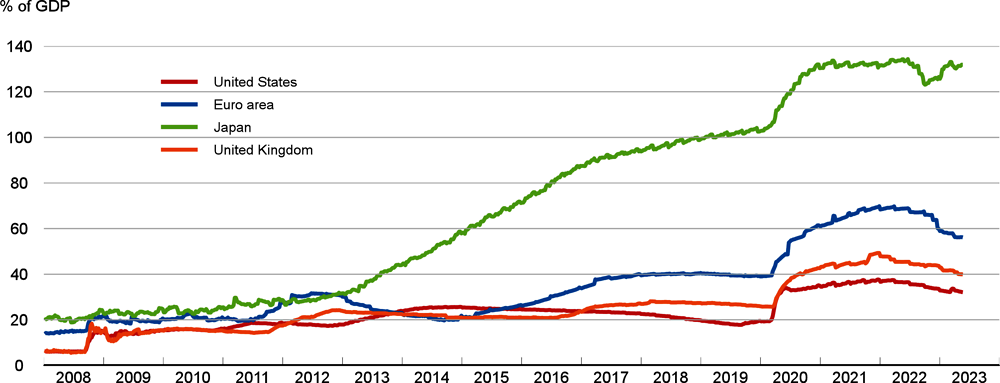
Source: OECD Economic Outlook 113 database; Board of Governors of the Federal Reserve System; European Central Bank; Bank of Japan; Bank of England; and OECD calculations.
Several quarters of positive forward-looking real interest rates and below-trend growth will likely be needed to lower resource pressures durably and achieve sustained disinflation, particularly where demand pressures are an important source of inflation (OECD, 2022b). However, calibrating domestic monetary policy actions is difficult, and policies will need to remain responsive to new data, given the uncertainty about the speed at which higher interest rates take effect, the potential spillovers from restrictive policy in other countries and tightening financial conditions. The impact of monetary policy tightening has started to appear in financial and housing markets, but no clear signs of a persistent decline in core inflation have been observed yet. Simultaneous tightening by many countries makes the transmission mechanism more complex and uncertain, especially for smaller economies, with stronger effects arising from weaker global demand and smaller effects on exchange rates from domestic policy actions. This could potentially increase the period of time needed to return inflation to target. Continuous communication efforts are needed to bridge the gap between central banks’ stated intention of maintaining a restrictive policy stance for an extended period and market expectations of an early reduction in policy rates.
Policy interest rates in most countries are projected to have reached their peaks or are expected to do so in the next few months (Figure 1.27). Once inflation eases and converges towards central bank targets, policy rates may start to decrease in 2024 in some jurisdictions.
In the United States, the federal funds rate is projected to peak at 5¼-5½ per cent from the second quarter of 2023. Two modest rate reductions are projected in the second half of 2024, as core inflation declines towards 2%. Bond holdings have continued to decline following a pre-announced path, and this is expected to persist. In the wake of some bank failures in March, the Federal Reserve introduced a new loan facility, the Bank Term Funding Program, which values eligible collateral at par rather than marked to market. Liquidity provision under this facility has slowed the pace of balance sheet reduction.
In the euro area, where underlying inflation is still elevated, the main refinancing rate is projected to peak from the third quarter of 2023 and remain unchanged at 4¼ per cent until the end of 2024. With reinvestment of Asset Purchase Programme redemptions expected to cease altogether from July, QT should accelerate, but full reinvestment of maturing Pandemic Emergency Purchase Programme securities is expected to continue to make use of all margins of flexibility to limit financial fragmentation in the euro area.
The Bank of Japan modified its conduct of yield curve control in December 2022, widening the range of the 10-year Japanese government bond yield fluctuations around the zero per cent target level from between around plus and minus 0.25 percentage points to between around plus and minus 0.5 percentage points. The Bank is projected to maintain an accommodative policy stance, with no increase in the policy rate until end-2024, reflecting still-subdued underlying price inflation. However, the yield curve is projected to gradually steepen over 2023-24 as gradual adjustments occur in the conduct of yield curve control.
No further policy rate increases are projected in Canada and Korea, while in Australia and the United Kingdom rates are expected to peak from the second quarter of 2023. In all four cases, moderate rate reductions are projected in the second half of 2024. Except for Korea, central bank bond holdings are assumed to decline further.
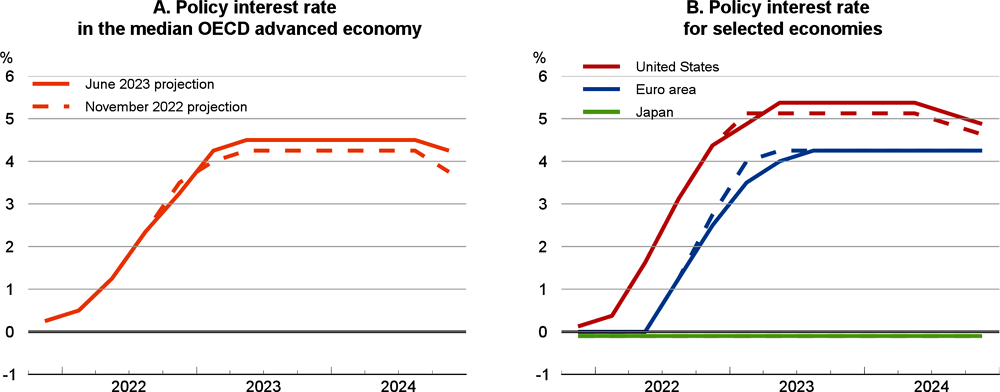
Note: Solid lines refer to the OECD June 2023 projections and dashed lines refer to the OECD November 2022 projections. In Panel A, advanced economies include Australia, Canada, the Czech Republic, Denmark, the euro area, Hungary, Iceland, Israel, Japan, Korea, New Zealand, Norway, Poland, Sweden, Switzerland, the United Kingdom, and the United States.
Source: OECD Economic Outlook 113 database; OECD Economic Outlook 112 database; and OECD calculations.
The monetary and financial authorities should continue to take actions to monitor and mitigate risks of financial instability. Clear communication will be necessary to minimise any uncertainty about apparent conflicts between the steps necessary to pursue the separate price stability and financial stability mandates. Key areas for action by supervisors and regulators include steps to ensure that smaller and medium-sized banks have adequate capital and liquidity ratios and formal plans to address any shortfalls and carrying out rigorous stress testing against credit and liquidity risks, particularly from property markets. Data gaps for non-bank financial institutions (NBFIs) also need to be closed and their regulation and supervision strengthened. If further market strains make additional liquidity support necessary, either to banks or non-banks, support should be priced at a relatively high level, have clear criteria, be time limited, and seek to minimise moral hazard. Solvency issues should not be addressed through central bank liquidity provision but be tackled within national resolution regimes that limit the need to resort to public funding (IMF, 2023).
Clear communication about the sizeable financial losses now being reported by many central banks would help to preserve central bank credibility and ensure the effectiveness of monetary policy. These losses arise from the rapid expansion of central bank balance sheets since the global financial crisis, declining prices of the assets held, especially long-term securities purchased under quantitative easing, and the impact of rapid policy rate increases on payments on commercial bank reserves held at the central bank (Box 1.3). The scale of reported losses could intensify further in the coming years. This is having an impact on the public finances by reducing or ending remittances from the central bank to the government. Reported central bank losses should not be taken as evidence of policy failure, as they follow from the pursuit of price stability, and need not entail weakened central bank independence, as central banks can operate effectively even with negative equity.
After recording sizeable gains from quantitative easing (QE) over most of the past decade, several central banks in advanced economies have recently reported financial losses, often likely to persist in the coming years. Losses largely reflect the large balance sheets built up during an extended period of QE and the effects of the recent rises in policy interest rates. This Box analyses the key drivers of those losses and their potential impact on the public finances and on the credibility and policy effectiveness of the central bank.
Increases in policy rates reduce the net interest income of central banks. QE created a sizeable mismatch in the maturity of central bank assets and liabilities. On the liability side, central bank reserves (mainly commercial bank deposits) rose sharply. The remuneration on these is closely linked to policy interest rates, and has thus risen rapidly, to the benefit of commercial banks, as policy rates are raised. In contrast, on the asset side, most of the assets purchased under QE were long-term fixed-rate bonds that generate a relatively stable stream of income. When policy interest rates were at or close to the zero lower bound, the balance of these two sets of payments generated gains for central banks. Even as policy rates were raised through 2022, their impact on whole-year net interest income was still relatively mild (Figure 1.28), especially where most rate increases took place towards the end of the year, as in the euro area. However, larger impacts are likely in 2023 and 2024 (Anderson et al., 2022; De Nederlandsche Bank, 2022).
Increases in interest rates also reduce the market value of securities, and valuation losses may thus arise. However, the timing and magnitude will depend on the accounting frameworks used by central banks and asset sales decisions. For instance, the Federal Reserve and the Bank of Japan account for securities held for monetary policy purposes using amortised cost. Hence valuation changes do not affect profits until securities are sold, which has not been the case so far. Eurosystem accounting guidelines, also followed by Sweden, allow central banks to value securities held for monetary policy purposes at either amortised cost or the current market price (Kjellberg and Åhl, 2022). While euro area national central banks have generally opted to use amortised cost, the Riksbank has adopted market pricing, making a significant loss apparent in 2022. Mark-to-market accounting brings forward loss recognition. Other central banks which use current market prices for securities held for monetary policy purposes, including Australia, Canada, New Zealand, Switzerland and the United Kingdom, also recorded, or are expected to have recorded, significant losses in 2022 (unless indemnified by their governments, see below). In Switzerland, where the central bank loss was unusually large, at 17 per cent of GDP, losses stemmed largely from changes in the domestic currency value of foreign exchange reserves, including foreign securities.
Central bank losses will weigh on the public finances. While institutional arrangements vary widely across countries, losses will in general mean lower or no central bank payments to the Treasury in the form of income taxes or remittances. In addition, reverse cash flows (i.e., payments from the Treasury) may occur if central banks are entitled to be compensated by the government for certain losses, such as QE-related losses. For instance, in the United Kingdom, the Bank of England Asset Purchase Facility (APF), through which QE asset purchases were conducted, is fully indemnified by the Treasury. Such indemnified losses are a contingent liability for the government. The annual impact on the general government fiscal balance should in general be modest (Figure 1.29), but potentially protracted, as losses may persist for several years. Even after the central bank returns to profits, some time may elapse before remittances to the Treasury resume.1
From a broader public sector perspective, QE has effectively shortened the average maturity of debt. Consolidating the balance sheets of the general government and the central bank, QE has to a large extent replaced long-term fixed-rate bonds by short-term floating-rate bank reserves (OBR, 2022). While this change may ultimately unwind if central banks take their balance sheets back to pre-QE levels, interest rate increases are currently transmitted more rapidly to debt service costs than would otherwise have been the case.
Central bank losses are not an indication of a policy error. The policy mandates of central banks include price stability and financial stability, but not profit maximisation. Their current losses, as well as their earlier gains from QE, are a by-product of policy actions to achieve their mandates and have long been anticipated (in the case of the United Kingdom, at least since November 2012; Bank of England, 2012) Moreover, since central banks are not subject to capital adequacy requirements or bankruptcy procedures, they can operate effectively even with negative equity, as the central banks of Chile, the Czech Republic, Israel and Mexico have done over several years (Bell et al., 2023).
However, losses or negative equity may pose communication challenges. For instance, some policy decisions, such as not pursuing active QT, could be wrongly interpreted as motivated by a desire to contain losses rather than being necessary to pursue specific mandates, reducing central bank credibility. Likewise, financial flows from government, including any decision to strengthen central bank capital positions, could be perceived as endangering central bank independence. This underscores the importance of clear communication about the reasons for losses and of a transparent framework to account for financial flows between the central bank and the government.
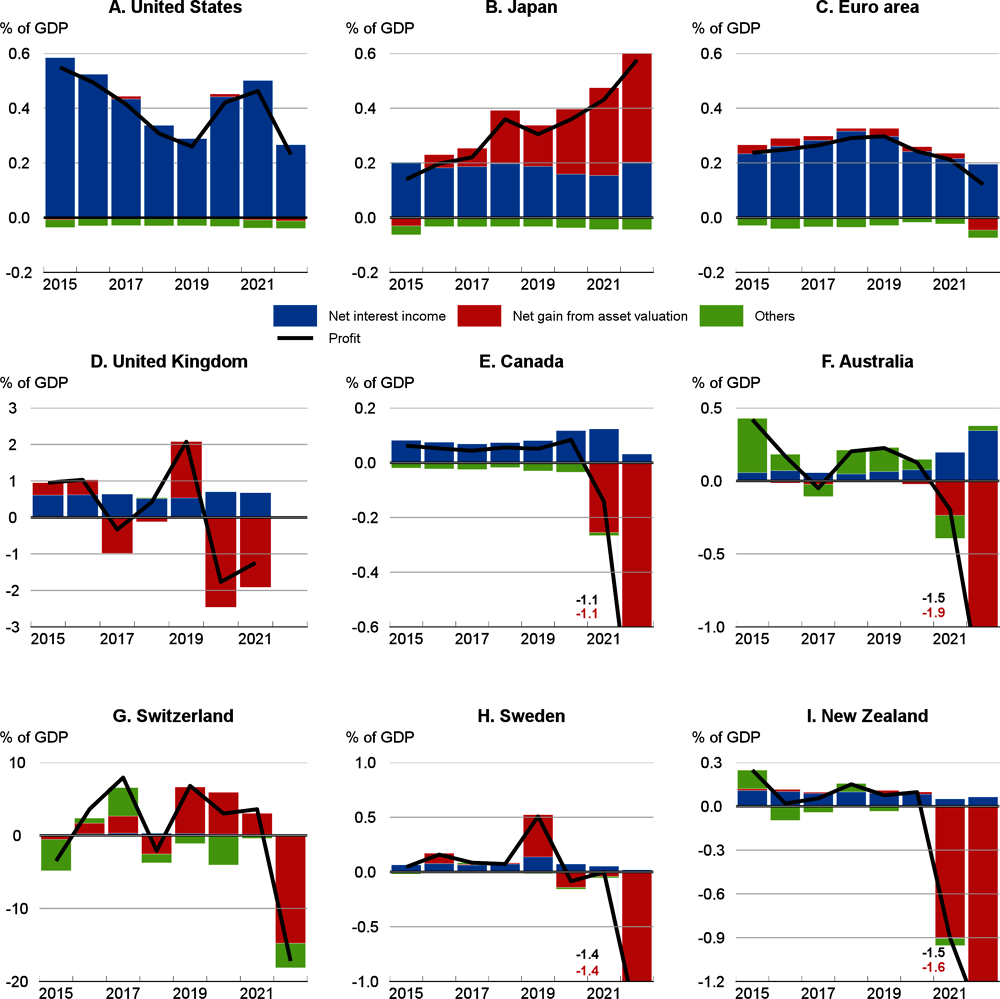
Note: Accounting approaches and financial years differ across countries and data should therefore be compared with caution. ‘Net gain from asset valuation’ includes realised gains/losses from financial transactions and, depending on accounting frameworks, may also comprise unrealised asset valuation gains/losses. Transfers from/to risk provisions are excluded, as these are often discretionary. ‘Profit’ excludes income taxes, transfers from/to risk provisions and net indemnities to/from government, and in some countries thus differs from profit as reported by the central bank. For Japan and the United Kingdom, results for the financial year ending in March or February of calendar year n are depicted under year n-1. For Australia and New Zealand, results for the financial year ending in June of calendar year n are depicted under year n. In these cases, ratios to GDP are defined taking the quarterly GDP observations that come closest to the financial year. For the euro area, the chart shows the consolidated result of national central banks (for 2022, only those central banks having published their results by 31 May 2023 – twelve altogether, including those of the four largest euro area economies). For the United Kingdom, the chart shows the consolidated result of the Bank of England and the Asset Purchase Facility.
Source: Board of Governors of the Federal Reserve System; Bank of Japan; national central banks in the euro area; Bank of England; Bank of Canada; Reserve Bank of Australia; Swiss National Bank; Sveriges Riksbank; Reserve Bank of New Zealand; OECD Quarterly National Accounts database; and OECD calculations.
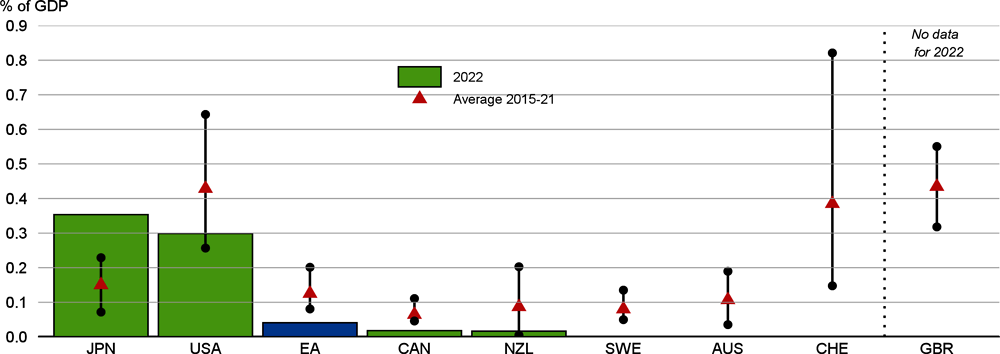
Note: Accounting approaches and financial years differ across countries and data should therefore be compared with caution. The chart shows net transfers from central bank to government in the form of income tax, dividends or remittances paid to the Treasury and (for Canada, New Zealand and the United Kingdom) indemnities. The range line shows the maximum and minimum values between 2015 and 2021. For the euro area, the chart shows consolidated figures for national central banks (for 2022, only those central banks having published their results by 31 May 2023 – twelve altogether, including those of the four largest euro area economies). For the United Kingdom, the chart shows consolidated figures for the Bank of England and the Asset Purchase Facility. For Japan and the United Kingdom, results for the financial year ending in March or February of calendar year n are depicted under year n-1. For Australia and New Zealand, results for the financial year ending in June of calendar year n are depicted under year n.
Source: Board of Governors of the Federal Reserve System; Bank of Japan; national central banks in the euro area; Bank of England; Bank of Canada; Reserve Bank of Australia; Swiss National Bank; Sveriges Riksbank; Reserve Bank of New Zealand; OECD Quarterly National Accounts database; and OECD calculations.
← 1. For instance, the Federal Reserve records losses as a negative liability – a “deferred asset” to be covered by future profits. Remittances to the government will be suspended as long as the “deferred asset” exists.
Fiscal support needs to be refocused
Many governments are continuing to provide sizeable support to energy consumers at present. The estimated budget cost of the measures in force this year is about 0.8% of GDP in the median OECD economy, broadly unchanged from 2022, and 2% of GDP or more in several European countries, including Germany and Poland (OECD, 2023a). The eventual fiscal costs will heavily depend on the evolution of energy market prices and energy consumption, and could therefore be lower than originally budgeted because extensive use has been made of measures such as price caps or lower VAT rates on some or all of the energy consumed. A gradual phasing out of energy support is expected over 2023-24 and will likely result in a substantial reduction in fiscal costs in 2024, though considerable uncertainty still surrounds policy plans in many countries (Figure 1.30). At the same time, declining inflation in 2023-24 is likely to weigh on fiscal balances, as the higher-than-expected tax revenues stemming from inflationary surprises in 2022 give way to higher expenditure associated with public wage increases and the indexation of numerous social benefits (and also minimum wages) to past inflation.
Fiscal projections for 2023-24 are conditional on announced government measures and OECD assessments of current plans (Annex 1.A.). Modest fiscal consolidation is expected in many countries, with the underlying primary balance in the median OECD economy improving by 0.2% of potential GDP in 2023 and 0.5% of potential GDP in 2024 (Figure 1.31).
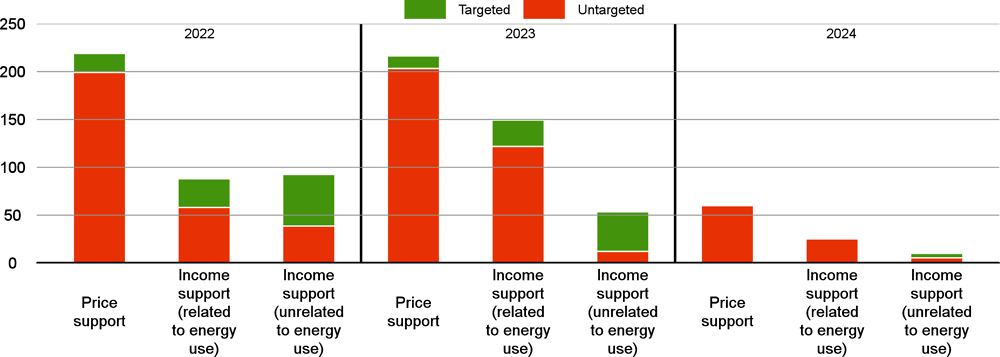
Note: Based on an aggregation of support measures in 41 countries, of which 35 are OECD economies (all members except Hungary, Iceland and Switzerland) and 6 are non-OECD economies (Brazil, Bulgaria, Croatia, India, Romania and South Africa). Support measures are taken in gross terms, i.e., not accounting for the effect of possible accompanying energy-related revenue-increasing measures, such as windfall profit taxes on energy companies. Where government plans have been announced but not legislated, they are incorporated if it is deemed clear that they will be implemented in a shape close to that announced. Measures classified as credit and equity support are not included. When a given measure spans more than one year, its total fiscal costs are assumed to be uniformly spread across months. For measures without an officially announced end-date, an expiry date is assumed and the fraction of the gross fiscal cost that pertains to 2022-24 has been retained. For Japan and Spain, it has been assumed that some existing measures will be extended further into 2023 or 2024, even though that extension has not been decided or announced by the authorities.
Source: OECD Energy Support Measures Tracker.
In the United States, the fiscal stance is projected to be moderately contractionary in 2023-24, largely reflecting the full expiry of pandemic-related spending and the phasing-out of energy-related fiscal support at the state level. The increase in public investment under the Infrastructure Investment and Jobs Act will be modest, given the 10-year horizon of the plan.
In the euro area, moderate fiscal consolidation is also expected, mainly reflecting savings in 2023 from the full withdrawal of pandemic support and the gradual phasing out of energy-related support in 2024. In some countries, stimulus from an expected faster implementation of Next Generation EU plans and increased spending on defence, healthcare or inflation-indexed social benefits will moderate the improvement in underlying primary balances.
In Japan, the fiscal stance is projected to be largely neutral in 2023, as the phasing out of pandemic-related measures broadly cancels out expanded support to vulnerable households against higher energy and food prices and increased defence spending. Measures for moderating energy and food prices are then projected to gradually decline, leading to a more restrictive fiscal stance in 2024, with a sizeable improvement in the underlying primary balance.
Among other large advanced economies, the United Kingdom has a restrictive fiscal stance, with a cumulative increase in the underlying primary balance of almost 2% of potential GDP over 2023-24. More limited tightening is projected in Australia, Canada and Korea. Among smaller economies, Hungary plans a cumulative consolidation effort of 5% over 2023-24, reflecting efforts to reduce inflationary pressures and rebuild fiscal buffers. In contrast, the Slovak Republic envisages a large discretionary expansion in 2023, only partly reversed in 2024, linked in part to the introduction of temporary measures to mitigate the effects of the energy crisis.
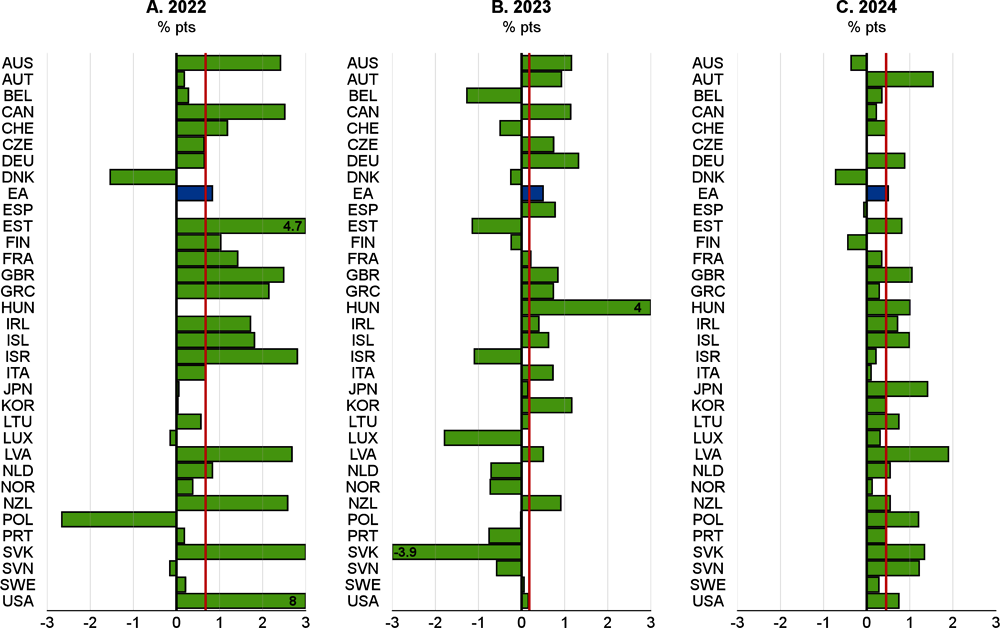
With energy and food commodity prices below their 2022 peaks but generally still above the levels seen only a few years ago, there is a strong case for withdrawing broad policy support but continuing to provide some targeted support for vulnerable households inadequately covered by the general social protection system. In many countries, recent and ongoing increases in minimum wages and welfare benefits, either through discretionary compensation for past inflation or automatic indexation to it, are now an effective mechanism to provide necessary support, with the advantage of not lowering marginal energy prices or weakening incentives to reduce energy use. Preserving untargeted measures to reduce energy prices blurs these incentives, places unwarranted pressure on the public finances, duplicates support to many lower-income households and boosts aggregate demand at a time of high inflation. This adds to the challenges faced by monetary policy in bringing inflation back to target, and raises the risk that high underlying inflation will persist.
However, providing support only to existing welfare recipients may be insufficient, as vulnerability to high energy prices does not depend on income alone. Other sources of vulnerability include the inability to renovate energy-inefficient dwellings and high energy needs due to age, illness or geographical factors. This points to a need to maintain or develop improved targeted measures that go beyond standard welfare benefits by combining indicators from different databases, and also making broader use of digital tools for data collection (such as smart meters) and faster payment delivery (OECD, 2023a). In countries with weaker welfare systems, broader policy support to energy users may be needed for longer, but even in these cases it should become more targeted, incentivise energy efficiency and facilitate adjustment to higher energy costs. These latter considerations should also govern any remaining support to firms.
Reducing vulnerability to future energy crises and the need to accelerate the transition towards carbon neutrality also requires a substantial increase in government investment in many countries, including in the energy efficiency of public buildings, charging infrastructure for electric vehicles, energy grids and interconnections, and public R&D. Encouragingly, public investment as a share of GDP is often projected to increase in 2023-24, rising above pre-pandemic levels, especially in countries where it has been low (Figure 1.32). Still, the contribution of public investment to GDP growth is expected to be modest, at only an average 0.1 percentage points of GDP per year in 2023-24 in the median OECD advanced economy. In Europe, the rise in public investment largely reflects an expected acceleration in the implementation of Next Generation EU investment plans (European Commission, 2022), after delays that have previously held back spending. Those delays, which have long characterised cohesion policy (OECD, 2018), have been exacerbated by high inflation, which has made budgeted amounts for specific projects insufficient or unattractive for tendering.
Ensuring the sustainability of the public finances over the longer term has become more pressing and should become a more prominent policy objective. In the median OECD advanced economy, gross public debt as a per cent of GDP is projected to stay broadly unchanged over 2023-24, and remain 7 percentage points higher in 2024 than in 2019. Despite some consolidation in the next two years, primary budget balances in 2024 are often projected to remain well below pre-pandemic levels (by 1.3% of GDP in the median OECD advanced economy; Figure 1.33) and will be subject in the coming decades to large pressures from factors such as ageing and the climate transition. Government spending on pensions, health and long-term care in the median OECD advanced economy is estimated to rise by around 5% of GDP by 2060 in the absence of policy reforms (Guillemette and Château, 2023). Debt service costs are also rising, with a significant jump in interest payments projected by 2024 (0.5% of GDP higher than in 2022 in the median OECD advanced economy) and subsequent further rises all but certain as low-yielding debt matures. In 2024, the cost of new sovereign borrowing is projected to exceed the average cost of the existing stock of public debt in most countries, often by a large margin. Credible fiscal frameworks with strong national ownership would help to provide clear guidance to citizens and markets about the medium-term trajectory of the public finances needed to ensure a gradual reduction of debt-to-GDP ratios.
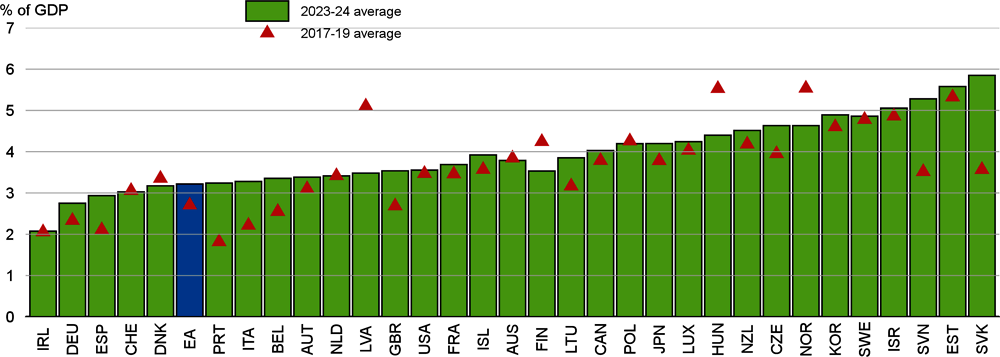
Source: OECD Economic Outlook 113 database; and OECD calculations.
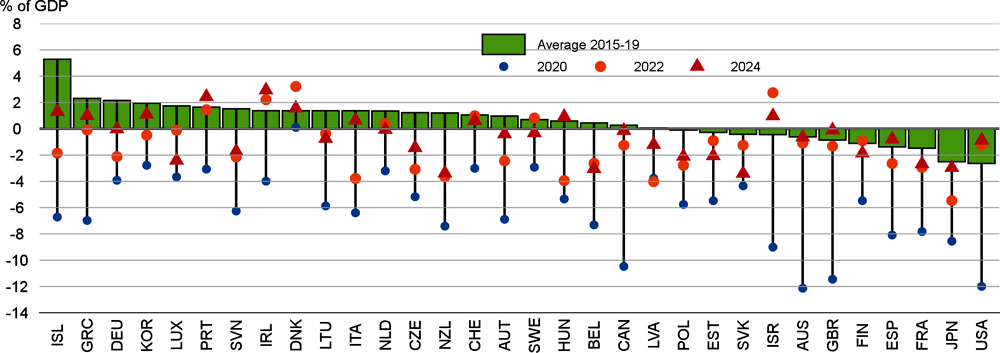
Source: OECD Economic Outlook 113 database; and OECD calculations.
In emerging-market economies, monetary policy should remain focused on inflation and fiscal buffers should be rebuilt
Monetary policy has become restrictive in many emerging-market economies, reflecting persisting inflation pressures and policy tightening in advanced economies. Real policy interest rates are now positive in most economies, particularly ones in which policy rates were raised relatively early, and this has begun to slow investment growth (Figure 1.34) and real GDP growth.
Policy space remains limited by the need to keep inflation expectations anchored and tight global financial conditions. Policy interest rates are generally projected to remain above both headline and core inflation in the remainder of this year (Figure 1.35, Panel A), with headline inflation falling sharply thanks to the easing in food and energy prices, but underlying inflation proving more persistent. In 2024, both headline and underlying inflation are often projected to return to central bank target ranges, providing some scope for policy rate cuts if inflation expectations remain anchored. However, policy rates may need to remain high for longer in economies where large minimum wage increases to cushion the impact of the cost-of-living crisis are adding to underlying inflationary pressures.
Given the recent increase in global risk aversion, and the risks of a renewed appreciation of the US dollar, monetary easing may require careful consideration in countries with sizeable foreign currency denominated debts. In the event of renewed exchange rate pressures, countries should let their currencies adjust as much as possible to reflect underlying economic fundamentals. However, temporary use of foreign exchange interventions, or restrictions on capital flows, could be considered if there are severe risks to domestic financial stability.
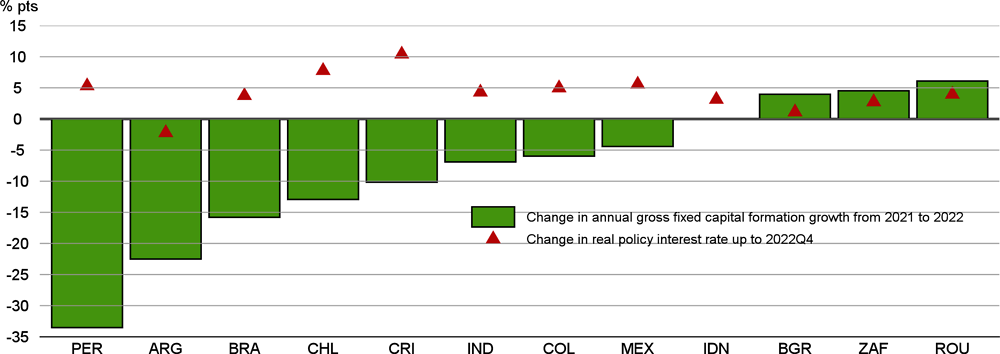
Note: Real policy interest rates in quarter t are obtained from (end-of-quarter) nominal policy rates and annual consumer price inflation from quarter t-2 to quarter t+2. The change in the real policy interest rate is relative to the quarter preceding the first policy rate increase in each country in the current tightening cycle.
Source: OECD Economic Outlook 113 database; and OECD calculations.
In Latin America, policy rate reductions are not expected in Chile, Colombia and Mexico before 2024 due to persistent underlying inflation dynamics and minimum wage increases (Figure 1.35, Panel B). In contrast, policy rates in Brazil are projected to start declining in 2023, with tighter credit conditions expected to steadily reduce core inflation. Continuing food price pressures in India, the need to firmly anchor inflation expectations in Indonesia and the broad-based inflationary impact of the projected slow pace of fiscal tightening in South Africa may prevent policy rates in these countries from declining until well into 2024.
Public debt remains well above pre-pandemic levels in most emerging-market economies. However, fiscal deficits declined in 2022 in many countries, helped by elevated inflation and higher commodity-related fiscal revenues in commodity-exporting countries (Figure 1.36, Panel A). The evolution of government fiscal balances over 2023-24 is expected to vary across the major emerging-market economies (Figure 1.36, Panels B and C). Some commodity exporters have used windfall revenues to finance energy-related fiscal support, and there are risks of higher deficits once commodity prices subside. For instance, the exclusion of social spending from the expenditure ceiling in Brazil and meagre growth in South Africa are projected to lead to an increase in the budget deficit in 2023. In such cases, establishing or reinstating credible fiscal rules and decoupling public finances from the commodity-cycle are needed to ensure better macroeconomic stabilisation and a further decline in public debt towards pre-pandemic levels. In India, the fiscal position is projected to improve, helped by greater tax compliance, fewer subsidies and ongoing privatisation of state-owned enterprises. This should be coupled with steps to strengthen revenue mobilisation, further improve public financial management and enhance expenditure efficiency. In Indonesia, fiscal rules are projected to be reinstated, ensuring a significant improvement in fiscal balances.
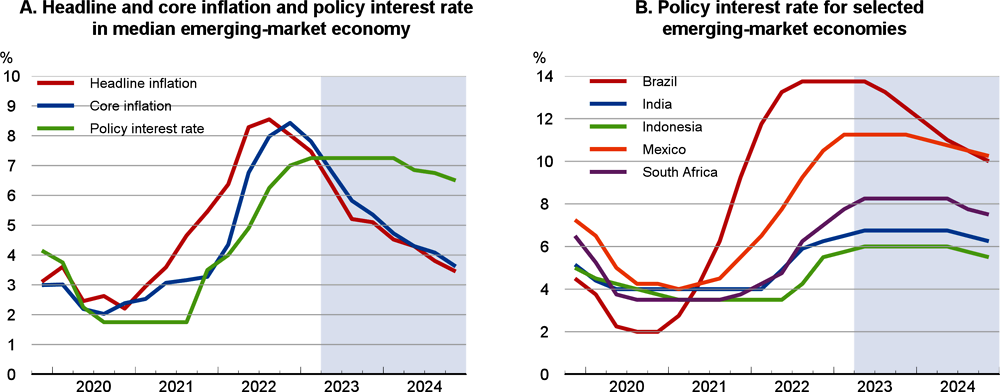
Note: In Panel A, the emerging-market economies considered are Brazil, Bulgaria, Chile, China, Colombia, Costa Rica, India, Indonesia, Mexico, Peru, Romania, Saudi Arabia and South Africa for year-on-year headline inflation and the policy interest rate, and Brazil, Bulgaria, Chile, Colombia, Costa Rica, Mexico, Peru, Romania and South Africa for year-on-year core inflation.
Source: OECD Economic Outlook 113 database; and OECD calculations.
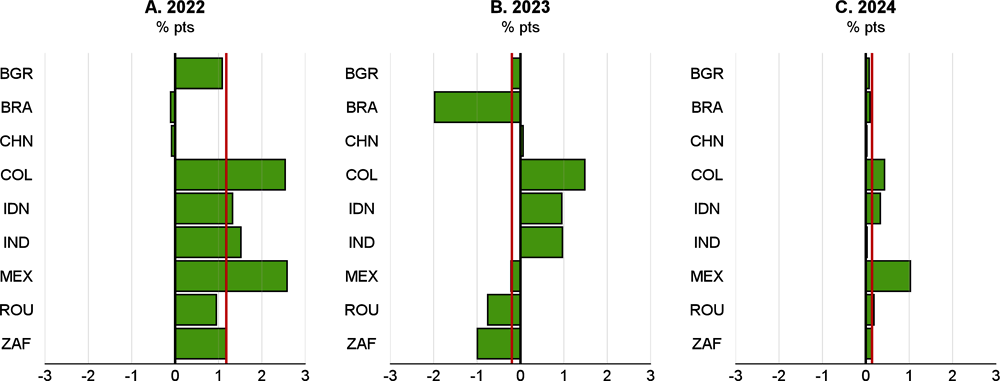
Note: For India, data refer to fiscal years starting in April. Vertical red lines indicate the medians for the nine emerging-market economies considered.
Source: OECD Economic Outlook 113 database; and OECD calculations.
Stronger structural reform efforts are needed to reinvigorate growth, bolster resilience and improve equity
Many economies face a dual imperative of reinvigorating underlying trend growth and improving the quality of that growth. The unwinding of the pandemic and energy-price shocks presents an opportunity to refocus attention on these critical longer-term challenges, thus laying the basis for stronger, more inclusive and more sustainable growth. The slow growth being experienced in many countries this year continues a longer period of worsening dynamism. Trend growth since the global financial crisis has been much weaker than previously (Figure 1.37, Panel A), both in advanced and emerging-market economies. The main factor in that deterioration has generally been lower rates of underlying labour productivity growth, augmented by slower growth of the working-age population as population ageing has progressed. The slowdown in labour productivity growth in turn reflects both smaller increases in capital per worker and slower growth of total factor productivity (productive efficiency). Productive capital investment in OECD economies has been much weaker since 2010 than it had been in past decades (Figure 1.37, Panel B), and total factor productivity has also grown more slowly in recent years. This prolonged slowdown highlights the need for supply-boosting structural reforms, especially given that recent experience suggests that interacting adverse supply shocks, such as the pandemic, the war in Ukraine, geoeconomic fragmentation and more frequent extreme weather events, are becoming more common.
There are many things that policymakers can do to lift investment rates from their currently low levels, with priorities depending on country-specific circumstances (OECD 2023b). A key cross-cutting element is the need to enhance competition to ensure that firms have incentives to undertake investment and improve efficiency. A large body of evidence points to weaker competition in recent years: industry concentration and mark-ups have been rising (De Loecker et al., 2020; Box 2); firm entry and exit rates have been falling (Calvino et al., 2020); and the gap between the best firms (the productivity “frontier”) and others has been growing (Andrews et al., 2016).
In most OECD economies, policy priorities to enhance competitive pressures and investment incentives include reforms to sector-specific and economy-wide regulations, including the streamlining of licensing and permits. Other priorities include tax reforms, to shift from direct to indirect taxation and broaden the tax base, and greater efforts to upgrade physical infrastructure. Insolvency regimes that do not excessively penalise debtors can also have beneficial effects, by facilitating the exit of less productive firms and freeing-up resources for more productive ones. For emerging-market economies, it is often most important to boost business dynamism and knowledge diffusion via measures that reduce the cost of entry, including by lowering barriers to trade and investment, expanding regulatory impact assessments, and strengthening the rule of law.
Making the most of new investments and technologies requires complementary investments in technical and managerial skills. Public policies have a crucial role to play in raising the quality and quantity of human capital by promoting training and by facilitating productive matches of workers to jobs. Labour market regulations should avoid putting a burden on workers who wish to move jobs. Limiting unnecessary differences in the licensing requirements of certain occupations would also ease barriers for workers with relevant skills in finding suitable jobs.
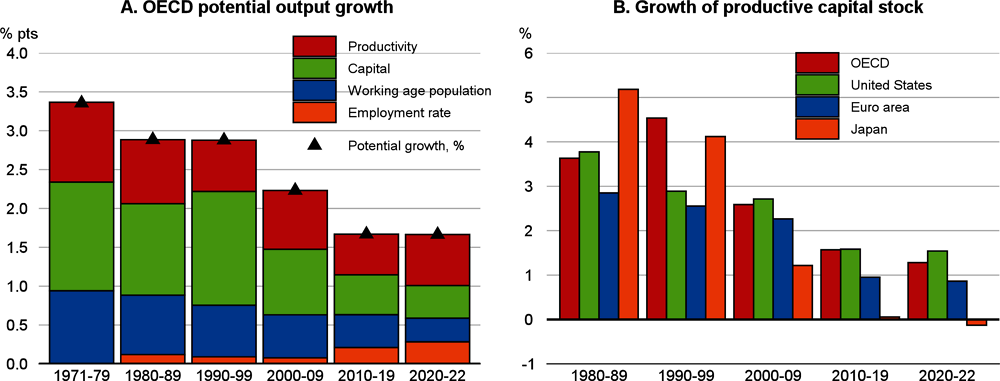
Source: OECD Economic Outlook 113 database; and OECD calculations.
The current prolonged period of labour market tightness in some OECD economies, especially for certain sectors (manufacturing and lower-pay sectors), suggests that measures to boost labour market participation are needed to enhance growth and make it more inclusive. Weak aggregate employment rates are often driven by low employment of specific groups, such as younger workers, older workers, women, minorities and the low-skilled.
As discussed in Chapter 2, investments in gender equality are an important means of boosting labour force participation, employment, and output. These require actions across a wide range of policy areas. There have been considerable improvements in women’s labour market participation, but gender employment and wage gaps are declining at a slow pace across OECD countries, warranting further policy measures (Figure 1.38, Panel A and B). Improving access to childcare is a priority in many OECD countries. A major obstacle to mothers’ employment, especially full-time work, is the lack of affordable high-quality childcare, with the financial disincentive when entering employment sometimes prohibitive when childcare costs are accounted for (Figure 1.38, Panel C). Other key policies to strengthen women’s employment and career opportunities include incentivising parents to better share parental leave, schemes to improve skills on return from parental leave, encouraging gender equality within firms, integration programmes for foreign-born women, promotion of entrepreneurship and financial inclusion for women, and levelling taxation for second earners.
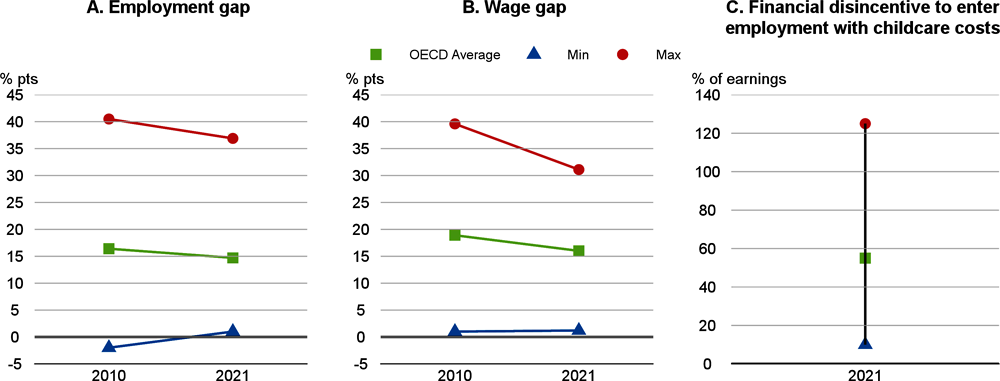
Note: The employment gap is the difference in the employment rate between men and women aged 15-64; The wage gap is the difference between the median wage of men and women; the financial disincentive to enter employment with childcare costs measures the percentage of earnings lost to either higher taxes or lower benefits when a parent of two children takes up full-time employment and uses centre-based childcare. Calculations refer to a couple with two children aged 2 and 3 where the other parent works full-time at 67% of the average wage.
Source: OECD Employment database; OECD Gender Data Portal; OECD (2023a), Financial disincentive to enter employment with childcare costs (indicator, accessed on 13 April 2023).
Climate policies
Ambitious targets have been set in the wake of the 2015 Paris Agreement, with many countries committing to net-zero emission targets by 2050 to limit global temperature rise to “well below 2°C and as close as possible to 1.5°C relative to pre-industrial levels”. At the global level, however, the policies in place are likely to be insufficient to put greenhouse gas emissions on a downward path before 2030 (IEA, 2022), compromising the goal of achieving net-zero emissions by mid-century.
Attaining that goal requires structural changes in the economy and substantial reallocation of workers and capital from emission-intensive activities towards greener activities. The transition will also require a large increase in green investment (reinforcing the need to boost investment to reinvigorate trend growth), greater use of carbon pricing,10 and strengthening regulations, institutions and standards to enable emission reductions. Well-targeted regulations can improve energy efficiency, particularly for housing and offices, and encourage the development and adoption of greener technologies. It is also critical that policies are clearly communicated, and sufficiently stable. The necessary increase in long-term clean energy investment will not happen if firms are faced with high uncertainty about future policies (Berestycki et al., 2022).11
Another key challenge for the transition is to manage the associated distributional impacts. Major transition costs will emerge or rise in specific sectors that are most vulnerable to the climate transition, such as mining and fossil fuel and energy-intensive industries. This will also have repercussions for firms that are heavily reliant on these industries. Workers lacking the skills needed in the growing green activities will be at the greatest risk of job losses. Cushioning vulnerable social groups from the adverse effects of transition would help to improve public acceptability of climate change mitigation policies. A key step is to include an element of revenue recycling in any reform package (Dechezleprêtre et al., 2022), such as using revenues from new taxes to reduce existing taxes or make transfer payments to vulnerable households.
Improving the coordination of countries’ carbon mitigation efforts is one reason why enhanced international cooperation is needed, together with other pressing global aims such as overcoming food and energy insecurity and ensuring that low-income countries’ debt burdens are sustainable. In this context, the new OECD forum, the Inclusive Forum on Carbon Mitigation Approaches (IFCMA), is intended to help its members achieve the common global net zero objective. The first actions of the IFCMA, which aims to improve international collaboration through data sharing, mutual learning and dialogue, are to take stock of the policy instruments in use across members of the Forum and measure their emission-reducing effects. The IFCMA will complement other international efforts on climate policy data, including in the context of the Enhanced Transparency Framework of the United Nations Framework Convention on Climate Change.
Open markets and resilient supply chains help to raise living standards
Open and well-functioning international markets with resilient and efficient supply chains are an important source of long-term prosperity and productivity growth for both advanced and emerging-market economies. The pandemic and the initial stages of the recovery as economies reopened highlighted the benefits of international trade, but also the vulnerabilities from increasingly complex supply chains with distant suppliers and the challenges faced by attempts to improve economic security. Rising geopolitical tensions and the war in Ukraine have further exposed growing tensions over trade and the security of supply, and intensified the risk of value chain fragmentation.
The integration into world markets of large and fast-growing emerging-market economies, particularly in Asia, has expanded global supply, enhanced economic efficiency and helped to keep inflation low in advanced economies. These gains could be foregone if fragmentation were to occur and economic policies became more inward looking, with lower-income households hit hardest (Arriola et al., 2020; Aiyar et al, 2023). The cumulative total of global import restrictions in force has already grown steadily since the global financial crisis, both in value terms and as a percentage of world imports. By 2022, over 9% of world merchandise imports were being affected by these import restrictions, up from around 4% in 2017. So far, this appears to have primarily affected trade patterns in the major economies rather than the overall intensity of trade, though there have been marked changes in bilateral trade at the sector level in both the United States and Europe (Box 1.4). However, trade policy uncertainty has also increased recently and, if sustained, would inhibit the growth of trade (Handley and Limao, 2022; Caldara et al, 2020; Novy and Taylor, 2020). A further move away from multilateral-based rules could also add to uncertainty about future trade policy. The increased emphasis on regional or bilateral trade agreements could potentially exclude smaller and medium-sized economies, limiting the gains from trade.
A key policy challenge is to enhance the resilience of global value chains without eroding their benefits for efficiency. Most actions to improve resilience lie with private firms, who have strong incentives to reduce risks of costly disruptions to production. Governments can nonetheless help to create a favourable trading environment and minimise bottlenecks along supply chains by removing trade and investment barriers, enhancing trade facilitation, modernising digital and physical infrastructures, and reducing heterogeneity in technical standards. Such steps can help to cushion shocks and facilitate easier substitution between suppliers (Arriola et al., 2020).
Global trade and investment relations have entered a period of significant change. The COVID-19 pandemic, supply bottlenecks, the war in Ukraine and the re-setting of US and China bilateral trade relations have heightened scrutiny of the potential vulnerabilities in global supply chains. There are also signs that enthusiasm for the further deepening of trade linkages and the multilateral trading system may have started to wane. Average tariff levels have remained broadly unchanged in the world over the last 5 years, excluding US and China bilateral tariffs, but trade costs are increasingly affected by non-tariff measures. The share of global merchandise imports subject to restrictions has risen steadily since the global financial crisis, and export restrictions on critical raw materials and foodstuffs have increased. Such restrictions can prompt importers to switch to less efficient suppliers that are subject to fewer trade barriers, potentially raising costs and lowering trade volumes. More broadly, there is a risk that countries become less open to trade over time, with attendant risks to productivity (Égert and Gal, 2017).
This box looks at selected aspects of trade developments in the major economies in recent years and the extent to which they suggest that trade is being affected by increasing trade frictions for different products and different trade partners. While there are differences across countries, two broad points emerge. First, the global trade system has so far generally absorbed recent trade frictions. Merchandise trade, and within that manufacturing trade, is rising steadily in value terms, and global trade intensity in volume terms (trade openness) has risen in most OECD countries and remained broadly stable for the world as a whole. The resilience of trade is not guaranteed: the strong policy support during the pandemic and the energy crisis and continued trade deepening in Europe have been important offsets for trade fragmentation. Secondly, there are also marked shifts in bilateral trade patterns in the major advanced economies, particularly with China, some of which are attributable in part to higher trade frictions.
Trade intensity
There is little evidence of a global decline in the intensity of merchandise trade over the past decade. Global merchandise trade was about 22% of world GDP in volume terms in 2022, 0.6 percentage points higher than the average for the last 10 years excluding the COVID-19 pandemic. This stability masks significant changes at the country level. In volume terms, merchandise trade intensity (the average of goods imported and exported as a share of GDP) increased by 2.6 percentage points for the OECD, and by much more in many smaller European countries. Amongst the major economies, trade intensity in the EU, Japan and the United States rose by 6.9, 2.5 and 1 percentage points respectively. In contrast, China’s merchandise trade intensity fell 3.5 percentage points over the period, driven primarily by a decline in import penetration as reliance on domestic production increased.
Merchandise trade can be further separated into trade in commodities and trade in manufactures. Understanding manufacturing trade trends is of particular interest, given their centrality in US-China trade, concerns about global supply chain vulnerability and the implications for industrial policy. National trade data at the country and manufactured product level, available in value terms, provide insights into how bilateral trade patterns have shifted in the three largest OECD markets in recent years.
The United States
In the United States, China’s share of manufactured imports fell from 25% in 2018, when new bilateral tariffs on Chinese exports were introduced by the United States, to 19% in 2022. Particularly large declines occurred in China’s share of imports of furniture, textiles and computers and other electronic products (Figure 1.39). These include many products subject to the highest bilateral tariff levels after 2018 (Bown, 2023). For the most part, the declines in the share of China have been offset by gains in the share of imports from other Asian economies.
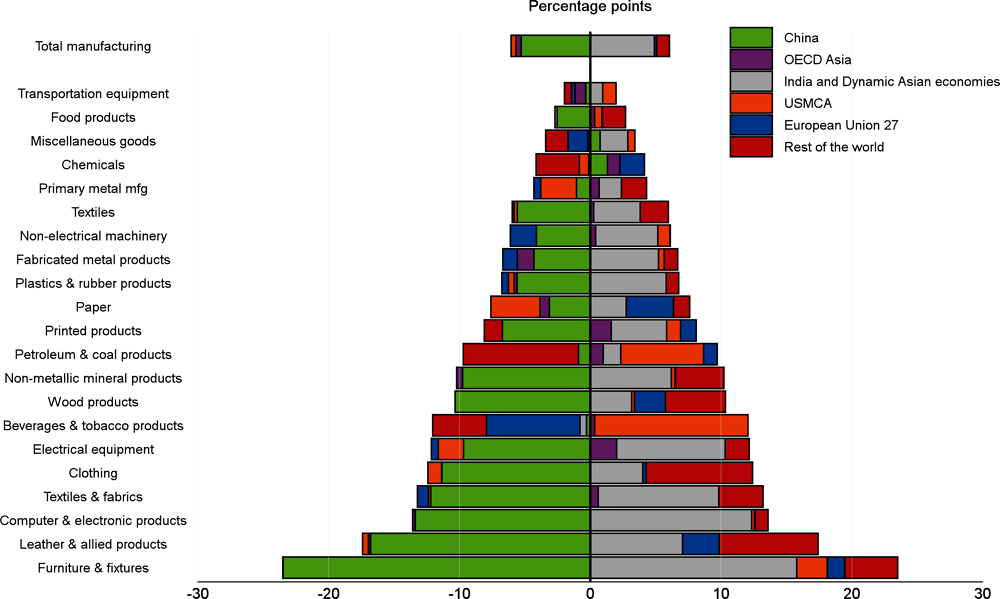
Note: Manufacturing import statistics based on the North American Industry Classification System (NAICS). OECD Asia includes Japan and Korea; Dynamic Asian economies include Chinese Taipei, Hong Kong (China), Malaysia, the Philippines, Singapore, Thailand and Viet Nam; USMCA includes the United States, Mexico and Canada; Rest of the world includes all other countries not mentioned elsewhere in the chart. The US manufacturing classification includes food, beverages and fuels.
Source: United States Census Bureau; and OECD calculations.
There is limited evidence of a move towards the nearshoring of production in the US data. The overall share of Mexico in US imports of manufactures rose by only 0.2 percentage points between 2018 and 2022, despite a rise in the value of trade. At the product level, Mexico and Canada’s share of trade rose the most in food, drink and tobacco products, and petroleum products – with China’s shares unaffected. By contrast, in the fast-growing electrical equipment category, total US imports grew by 50% between 2018 and 2022, but Mexico’s share of trade fell by 1.7 percentage points between 2018 and 2022, alongside the decline in China’s market share.
European Union
In contrast to the United States, China’s share of extra-EU manufactured goods imports has risen steadily, with the overall share of manufacturing imports rising from 26% in 2018 to 33% in 2022. China accounts for a rising share of EU imports across most product categories, with the largest increases being for electrical machinery, road vehicles and chemical products (Figure 1.40). The share of imports originating from the emerging Asian economies has also generally risen, with the exception of chemicals, suggesting that there has been relatively little switching between imports within Asia for the European market.
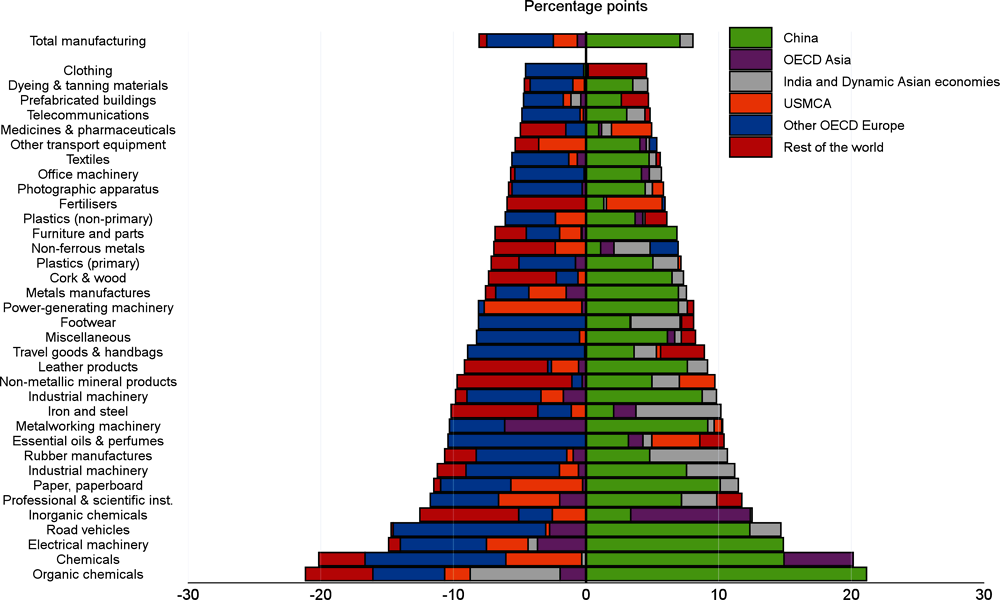
Note: Manufacturing import statistics based on the Eurostat Standard Industry Trade Classification (SITC). OECD Asia includes Japan and Korea; Dynamic Asian economies include Chinese Taipei, Hong Kong (China), Malaysia, the Philippines, Singapore, Thailand and Viet Nam; USMCA includes the United States, Mexico and Canada; Other OECD Europe includes Iceland, Norway, Switzerland, Türkiye and the United Kingdom; Rest of the world includes all other countries not mentioned elsewhere in the chart. The EU manufacturing classification does not include food, beverages and fuels.
Source: Eurostat; and OECD calculations.
The share of EU imports from locations outside Asia have collectively declined, with the largest drops occurring for imports from other OECD Europe countries and from North America. More broadly, the share of the advanced economies in EU imports has declined across most product categories, particularly for chemicals, road vehicles and electrical machinery. The share of imports from the United Kingdom has also declined significantly over the past five years. Nonetheless, thanks to strong aggregate trade growth, EU manufactured imports in 2022 from other OECD Europe were 13% higher than in 2018 in value terms, and imports from the United States were 26% higher.
Japan
In Japan, the pattern of trade is much more mixed. The share of China in total manufactured imports has hardly changed between 2018 and 2022 (Figure 1.41). Whilst there have been changes in China’s share of a few specific manufactured products, these are proportionately much smaller than the corresponding changes in Europe and the United States. Imports from dynamic Asia are not clearly substituting or complementing Chinese imports: they have risen alongside China for transport equipment, iron and steel products and furniture, but have also risen for footwear and electrical machinery, where China’s share has fallen. On aggregate, the share of imports from the EU and from the United States, Mexico and Canada (USMCA) have fallen, although manufactured imports from the EU rose 12% in value terms since 2018, and USMCA imports rose marginally.
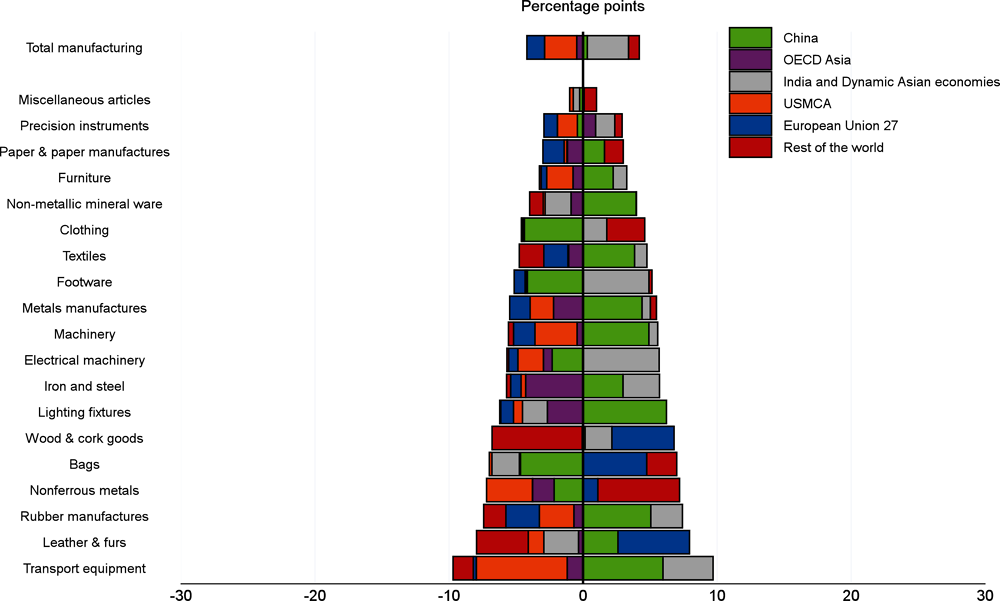
Note: Manufacturing import statistics based on the HS classification applied by custom authorities. OECD Asia includes Korea; Dynamic Asian economies include Chinese Taipei, Hong Kong (China), Malaysia, the Philippines, Singapore, Thailand and Viet Nam; USMCA includes the United States, Mexico and Canada; Rest of the world includes all other countries not mentioned elsewhere in the chart. The Japanese manufacturing classification does not include food, beverages and fuels.
Source: National Statistics Centre of Japan; and OECD calculations.
Bibliography
Aiyar, S. et al. (2023), “Geoeconomic Fragmentation and the Future of Multilateralism”, IMF Staff Discussion Note, No. SDN (2023)/001.
Anderson, A., P. Marks, D. Na, B. Schlusche, and Z. Senyuz (2022), "An Analysis of the Interest Rate Risk of the Federal Reserve's Balance Sheet, Part 2: Projections under Alternative Interest Rate Paths," FEDS Notes, Washington; Board of Governors of the Federal Reserve System, 15 July.
Andrews, D. C. Criscuolo and P. Gal (2016), “The Best versus the Rest: The Global Productivity Slowdown, Divergence across Firms and the Role of Public Policy”, OECD Productivity Working Papers, No. 5.
Arce, Ó, E. Hahn and G. Koester (2023), “How tit-for-tat inflation can make everyone poorer”, The ECB Blog.
Arriola, C., S. Guilloux-Nefussi, S. Koh, P. Kowalski, E. Rusticelli and F. Van Tongeren (2020), “Efficiency and Risks in Global Value Chains in the context of COVID-19”, OECD Economics Department Working Papers, No. 1637, OECD Publishing, Paris.
Bank for International Settlements (2021), Quarterly Review, December 2021.
Bank of England (2012), "Exchange of letters regarding the transfer of excess cash from the Asset Purchase Facility to HM Treasury – Exchange of letters between the Governor and the Chancellor", November.
Bell, S., M. Chui, T. Gomes, P. Moser-Boehm, and A. P. Tejada (2023), "Why are Central Banks Reporting Losses? Does it Matter?,” BIS Bulletin No 68, February.
Bernanke, B., and M. Gertler (1995). "Inside the Black Box: The Credit Channel of Monetary Policy Transmission." Journal of Economic Perspectives, Vol. 9.
Berestycki, C., et al. (2022), "Measuring and Assessing the Effects of Climate Policy Uncertainty", OECD Economics Department Working Papers, No. 1724, OECD Publishing, Paris.
Bown, C. (2023), “US Imports from China are both Decoupling and Reaching New Highs. Here's How”, Peterson Institute of International Economics, March 2023.
Calvino, F., C. Criscuolo and R. Verlhac (2020), "Declining Business Dynamism: Structural and Policy Determinants", OECD Science, Technology and Industry Policy Papers, No. 94, OECD Publishing, Paris.
Caldara, D., Iacoviello, M., Molligo, P., Prestipino, A., Raffo, A. (2020) “The Economic Effects of Trade Policy Uncertainty”, Journal of Monetary Economics, Vol. 109.
Cavalleri, M., B. Cournède and V. Ziemann (2019), “Housing Markets and Macroeconomic Risks”, OECD Economics Department Working Papers, No. 1555, OECD Publishing, Paris.
Colonna, F., R. Torrini and E. Viviano (2023), “The Profit Share and Firm Mark-up: How to Interpret Them?”, Occasional Papers, Banca d’Italia, No. 770.
Daly, P., L. Dekker, S. O’Sullivan, E. Ryan and M. Wedow (2023), “The Growing Role of Investment Funds in Euro Area Real Estate Markets: Risks and Policy Considerations”, ECB Macroprudential Bulletin, April.
Diev, P., Y. Kalantzis and A. Lalliard (2019), “Why Have Strong Wage Dynamics Not Pushed Up Inflation in the Euro Area?”, Bulletin de la Banque de France, 225/6, September-October.
De Loecker J., J. Eeckhout and G. Unger (2020), “The Rise of Market Power and the Macroeconomic Implications”, The Quarterly Journal of Economics, Vol. 135 Issue 2.
De Nederlandsche Bank (2022), "Letter regarding DNB’s capital position – September 2022,” 9 September.
Dechezleprêtre, A., et al. (2022), "Fighting Climate Change: International Attitudes Toward Climate Policies", OECD Economics Department Working Papers, No. 1714, OECD Publishing, Paris.
Égert, B. and P. Gal (2017), "The Quantification of Structural Reforms in OECD Countries: A New Framework", OECD Journal: Economic Studies, Vol. 2016/1.
Ehlers, T. and A. Víllar (2015), “The Role of Banks”, BIS Papers 83.
European Central Bank (2022), Financial Stability Review, November 2022.
European Commission (2022), European Economic Forecast Autumn 2022, November.
European Commission (2023), European Economic Forecast: Spring 2023, May.
European Systemic Risk Board (2022), EU Non-bank Financial Intermediation Risk Monitor 2022, July.
Eurostat (2023), “’Q4 2022: Business bankruptcies highest since 2015’’, February.
Faccia, D., M. Parker and L. Stracca (2021), “Feeling the Heat: Extreme Temperatures and Price Stability,” Working Paper Series 2626, European Central Bank.
FDIC (2022), Risks Review, Federal Deposit Insurance Corporation, June 2022.
Federal Reserve (2023), Financial Stability Report, May.
FSB (2022a), Global Monitoring Report on Non-Bank Financial Institutions 2022, Financial Stability Board.
FSB (2022b), Enhancing the Resilience of Non-Bank Financial Intermediation, Progress Report, November 2022.
Guillemette, Y. and J. Château (2023), “Long-term Scenarios Update: Incorporating the Energy Transition”, OECD Economic Policy Paper, forthcoming.
Glover, A., J. Mustre-del-Rìo and A. von Ende-Becker (2023), “How Much Have Record Corporate Profits Contributed to Recent Inflation?”, Economic Review, Federal Reserve Bank of Kansas City.
Handley, K. and N. Limão (2022), “Trade Policy Uncertainty”, Annual Review of Economics, Vol. 14.
Haskel J. (2023), “What’s Driving Inflation: Wages, Profits, or Energy Prices?”, Bank of England, Speech given at Peterson Institute for International Economics, Washington DC, 25 May.
Hermansen, M. and O. Röhn (2017), “Economic Resilience: The Usefulness of Early Warning Indicators in OECD Countries, OECD Economic Studies, Vol. 2016/1.
IEA (2021), Net Zero by 2050, International Energy Agency, Paris.
IEA (2022), World Energy Outlook 2022, International Energy Agency, Paris.
IMF (2022a), Global Financial Stability Report, International Monetary Fund, October.
IMF (2022b), External Sector Report, International Monetary Fund, August.
IMF (2023), Global Financial Stability Report, International Monetary Fund, April.
Kabundi, A., J. Yao and M. Mlachila, (2022), “How Persistent are Climate-Related Price Shocks? Implications for Monetary Policy,” IMF Working Papers 2022/207.
Kjellberg, D. and M. Åhl, (2022), "The Riksbank’s Financial Result and Capital are Affected by Higher Interest Rates,” Economic Commentary No 8, Sveriges Riksbank, 4 July.
Lane, P. R. (2023), “The Euro Area Hiking Cycle: An Interim Assessment”, speech at the National Institute of Economic and Social Research, 16 February.
Maravalle, A. and A. Gonzalez Pandiella (2022), "The Pass-through of the Monetary Policy Rate into Lending Rates in Mexico," OECD Economics Department Working Papers 1734, OECD Publishing.
Mishkin F. (1996), "The Channels of Monetary Transmission: Lessons for Monetary Policy," NBER Working Papers 5464.
Novy, D. and A. Taylor (2020) “Trade and Uncertainty”, The Review of Economics and Statistics, Vol. 102.
OBR (2022), Economic and Fiscal Outlook, November 2022, Office for Budget Responsibility, 17 November.
OECD (2022a), OECD Economic Outlook, Volume 2022 Issue 1, OECD Publishing, Paris.
OECD (2022b), OECD Economic Outlook, Volume 2022 Issue 2, OECD Publishing, Paris.
OECD (2022c), Competition and Inflation, OECD Competition Policy Roundtable Background Note.
OECD (2023a), “Aiming Better: Government Support for Households and Firms During the Energy Crisis”, OECD Economic Policy Papers, No. 32, OECD Publishing, Paris.
OECD (2023b), Economic Policy Reforms 2023: Going for Growth, OECD Publishing, Paris, forthcoming.
OECD (2023c), OECD Foreign Direct Investment in Figures, April 2023 edition.
OECD (2023d), OECD Sovereign Borrowing Outlook 2023, OECD Publishing, Paris.
OECD (2023e), Growth and Economic Well-Being: Fourth Quarter 2022, OECD, OECD Publishing, Paris.
OECD (2018), OECD Economic Surveys: European Union 2018, OECD Publishing, Paris.
Paul, P. (2022), "When the Fed Raises Rates, Are Banks Less Profitable?", FRBSF Economic Letter, December.
Schwellnus, C., M. Pak, P. Pionnier and E. Crivellaro (2018), “Labour Share Developments over the Past Two Decades: The Role of Technological Progress, Globalisation and ‘Winner-takes-most’ Dynamics”, OECD Economics Department Working Papers, No. 1503, OECD Publishing, Paris.
Sveriges Riksbank (2022), Financial Stability Report, November.
Weber, I. and E. Wasner (2023), “Sellers’ Inflation, Profits and Conflict: Why can Large Firms Hike Prices in an Emergency?”, Economics Department Working Paper Series, University of Massachusetts Amherst.
World Bank (2023), Global Economic Prospects, January 2023, Washington, DC.
Fiscal policy settings for 2023-24 are based as closely as possible on legislated tax and spending provisions and are consistent with the growth, inflation and wage projections. Where government plans have been announced but not legislated, they are incorporated if it is deemed clear that they will be implemented in a shape close to that announced. Existing energy-related support measures have been assumed to be extended into part or the whole of 2023-24 when that extension is deemed likely, even if it has not yet been announced. When a given energy-related measure spans more than one year, its total fiscal costs are assumed to be uniformly spread across months.
Projections for the EU countries account for spending financed by the Next Generation EU (NGEU) grants and loans, based on expert judgments about the distribution across years and different expenditure categories and informed by officially announced plans where available. NGEU grants are assumed to be budget neutral, i.e. they increase both capital tax and transfers receipts and government expenditure. In addition, positive net one-offs are added in order to reflect the discretionary stimulus associated with those grants, as measured by changes in underlying primary balances.
For monetary policy, the assumed path of policy interest rates and unconventional measures represents the most likely outcome, conditional upon the OECD projections of activity and inflation. This may differ from the stated path of the monetary authorities. In the euro area, 10-year sovereign spreads relative to Germany are assumed to remain constant over the projection period at levels close to those observed in March and April 2023.
The projections assume unchanged exchange rates from those prevailing on 12 May 2023: one US dollar equals JPY 128.8, EUR 0.96 (or equivalently one euro equals USD 1.04) and 6.79 renminbi.
The price of a barrel of Brent crude oil is assumed to remain constant at USD 75 until the end of 2024. The TTF natural gas price is assumed to remain constant at EUR 45 MW/h until the end of 2024. Other commodity prices are assumed to be constant over the projection period at their average levels from April 2023.
The cut-off date for information used in the projections is 1 June 2023.
OECD quarterly projections are on a seasonal and working-day-adjusted basis for selected key variables. This implies that differences between adjusted and unadjusted annual data may occur, though these in general are quite small. In some countries, official forecasts of annual figures do not include working-day adjustments. Even when official forecasts do adjust for working days, the size of the adjustment may in some cases differ from that used by the OECD.
Notes
← 1. Rail, another option to support the diversification of transport channels and consequently markets, could take more time given costs and coordination problems in overcoming differences in rolling stock requirements.
← 2. In the United States, market rents have fallen in four of the last seven months, and the year-on-year increase in market rents has slowed for the past 14 months, but the year-on-year change in the rents component of the CPI and the PCE deflator continued to rise until April 2023.
← 3. On a per capita basis, household disposable incomes rose in the OECD in both the third and fourth quarter of 2022, though incomes remained much weaker than a year earlier (OECD, 2023e).
← 4. The figures for annual OECD headline consumer price inflation differ slightly to the OECD inflation figures in Table 1.1, which are for the annual inflation rate based on the personal consumption deflator from the national accounts. The latter has a similar definition across countries and may include a broader range of goods and services than the national headline consumer price index.
← 5. Estimates suggest that a 100 basis points upward shift of the whole yield curve could lead to valuation losses of around 4% in the net asset value for bond funds operating in Europe, with more than one-third of funds facing losses higher than 5% of total assets and around 20% of funds facing losses above 7% (ESRB, 2022).
← 6. In larger economies with better-than-expected fiscal outcomes, the slowdown in the pace of sovereign debt issuance partly reflects the intention to reduce the debt legacy of the pandemic. In contrast, in low-income countries, the decline in debt issuance is more related to the tightening of financing conditions in international capital markets.
← 7. Since November 2022, credit rating agencies have downgraded the sovereign debt ratings of Argentina, Bangladesh, Egypt, Ethiopia, Ghana, Kenya, Nigeria, Pakistan, Sri Lanka, Tunisia and Ukraine. Over the same period, the IMF has approved: an Extended Fund Facility for Bangladesh, Côte d’Ivoire, Egypt, Sri Lanka and Ukraine; an Extended Credit Facility for Bangladesh, Côte d’Ivoire and Ghana; a Resilience and Sustainability Facility for Bangladesh; and a Flexible Credit Line for Morocco.
← 8. Countries considered are Argentina, Bulgaria, Brazil, Chile, China, Colombia, Costa Rica, India, Indonesia, Mexico, Malaysia, Peru, the Philippines, Romania, Russia, Saudi Arabia, Thailand, Türkiye, Viet Nam and South Africa.
← 9. For the median emerging-market economy shown in Panel B of Figure 1.25, the domestic banking system exposure to the domestic government in 2022Q2 was about 8 percentage points higher than for the median of 25 OECD advanced economies.
← 10. Strong price signals on greenhouse emissions and a credible future price path are needed to underpin progress towards carbon neutrality but are still lacking in most countries. Currently, 80% of emissions in the OECD and G20 countries are priced below EUR 60/tCO2.
← 11. Enhanced investment in clean energy will be needed to meet emission reduction targets: the IEA estimates that investment in clean energy technologies needs to more than double to USD 5 trillion by 2030 (IEA, 2021). While energy investment has been rising recently, this in part reflects higher costs rather than stronger investment volumes.