Chapter 1. The LGBT challenge: How to better include sexual and gender minorities?
The statistical data for Israel are supplied by and under the responsibility of the relevant Israeli authorities. The use of such data by the OECD is without prejudice to the status of the Golan Heights, East Jerusalem and Israeli settlements in the West Bank under the terms of international law.
Introduction
There is still a long way to go before lesbians, gay men, bisexuals and transgender individuals – commonly referred to as “LGBT people” (Box 1.1) – meet full-fledged legal acceptance. Same-sex sexual acts have become legal in all OECD countries where they were formerly criminalised, as have hormonal therapy or gender-reassignment surgery. Nevertheless, only half of OECD countries have legalised same-sex marriage throughout their national territory, and less than a third allow for a change of gender on official documents to match gender identity without forcing the transgender person to undergo sterilisation, sex-reassignment surgery, hormonal therapy or a psychiatric diagnosis. Steps backward have also been witnessed. Some OECD countries have introduced a constitutional ban on same-sex marriage, and the very possibility of a person being legally recognised as transgender is questioned in some others.1 Overall, LGBT people are still stigmatised and exposed to various forms of discrimination, despite the fact that some LGBT individuals managed to make it to the top.
Discrimination is not only ethically unacceptable, it also entails substantial economic and social costs. Anti-LGBT discrimination hinders economic development through a wide range of channels. It causes lower investment in human capital due to LGBT-phobic bullying at school and poor returns, it reduces economic output by excluding LGBT talents from the labour market, it undermines productivity by impairing LGBT people’s mental health, it erodes public finances through significant spending on social and health services to address the consequences of LGBT people’s marginalisation, etc. Anti-LGBT discrimination is also detrimental to social cohesion through the persistence of restrictive gender norms that impede gender equality more broadly speaking and, hence, the expansion of social and economic roles, especially for women (Valfort, 2017[1]). The inclusion of sexual and gender minorities should therefore become a top policy priority for OECD governments.
This chapter provides a comprehensive overview of data and evidence on the number of LGBT people and their socio-economic situation in OECD countries. It confirms that anti-LGBT discrimination hampers the economic prospects and mental health of millions and highlights best-practices to create more inclusive environments for sexual and gender minorities.
This chapter addresses the following three main questions:
-
How many people are lesbian, gay, bisexual and transgender? The first section of this chapter presents a stocktaking of statistical sources to identify LGBT people in OECD countries. It reveals that the share of individuals who self-identify as LGBT is sizeable, and on the rise.
-
How do LGBT people fare? The second section explores the extent to which LGBT individuals are penalised. After underlining that acceptance of LGBT people in OECD countries remains limited, this section provides a wide range of evidence that anti-LGBT discrimination is a reality. It also demonstrates that LGBT people show worse mental health outcomes across the board, at least partly due to stigma.
-
What policies can improve LGBT inclusion? The final section examines what governments can do to ensure greater inclusion of sexual and gender minorities. It identifies a range of key policies, from making LGBT individuals and the penalties they face visible in national statistics, to enacting and enforcing anti-discrimination and equality laws and policies. Educating people in countering their unconscious biases also constitutes a critical component of any policy package aiming to combat anti-LGBT discrimination.
LGBT is the acronym for “lesbian, gay, bisexual and transgender”. LGBT people are defined with respect to two distinct characteristics: sexual orientation and gender identity. Sexual orientation refers to a person’s capacity for profound emotional and sexual attraction to, and intimate and sexual relations with opposite-sex individuals, same-sex individuals, or both opposite- and same-sex individuals. Sexual orientation allows for differentiating between heterosexuals, lesbians, gay men and bisexuals. Gender identity refers to a person’s internal sense of being masculine, feminine, or androgynous. As such, it permits distinguishing between transgender and cisgender individuals, a transgender (resp. cisgender) person being one whose gender identity differs from (resp. matches) her/his biological sex at birth. Because they differ to the majority in terms of sexual orientation and gender identity, LGBT people are also referred to as “sexual and gender minorities”.
The focus on LGBT individuals allows for addressing some of the issues intersex people face. Intersex people are born with physical, hormonal or genetic features that are neither wholly female nor wholly male. Due to this non-binary pattern, LGBT individuals are overrepresented among intersex people, which explains that the letter “I” is often added to the LGBT acronym to include intersex people. Among a non-representative sample of 272 intersex individuals in Australia, 52% self-identified as lesbians, gay men or bisexuals and 8% self-identified as being transgender (Jones et al., 2016[2]).
Due to the absence of questions on individuals’ intersex status in nationally representative surveys, the situation of intersex people cannot be analysed in this chapter. This lack of evidence does not mean, however, that the inclusion of intersex people is a minor issue. Evidence suggests that intersex people constitute a sizeable minority. To date, two studies have tried to provide a comprehensive estimate of the intersex population, based on a meta-analysis of medical research articles. Their measure varies from 0.5% (van Lisdonk, 2014[3]) to 1.7% (Blackless et al., 2000[4]) of the total population.
1.1. How many people are lesbian, gay, bisexual and transgender?
No census has ever asked questions on sexual orientation and/or gender identity to identify LGB and transgender people, and only a few nationally representative surveys contain such questions. The bulk of population-based surveys identify the LGBT population in an indirect way, namely through the sex of the respondent’s partner. But this approach focuses on individuals who live with a same-sex partner, a group that is not representative of the LGBT population as a whole.
To date, only 15 OECD countries have included a question on sexual self-identification in at least one of their nationally representative surveys conducted by national statistical offices or other public institutions. These countries are: Australia, Canada, Chile, Denmark, France, Germany, Iceland, Ireland, Italy, Mexico, New Zealand, Norway, Sweden, the United Kingdom and the United States. By asking individuals how they think of themselves (with the following options available: “Heterosexual”, “Homosexual”, “Bisexual”, “Other”, “Don’t know” and “Refused”), the question on sexual self-identification allows targeting people who self-identify as lesbian, gay or bisexual. The United States have been the most active in collecting this information, with at least 10 nationally representative surveys collecting information on sexual self-identification.
In the 14 OECD countries where estimates are available,2 LGB people account for 2.7% of the adult population on average (Figure 1.1). In other words, in these 14 OECD countries, at least 17 million adults self-identify as LGBT – 17 million adults is a lower bound since transgender people are not counted due to data gaps (see Section 1.1.2) –, which is as large as the total population of Chile or the Netherlands.
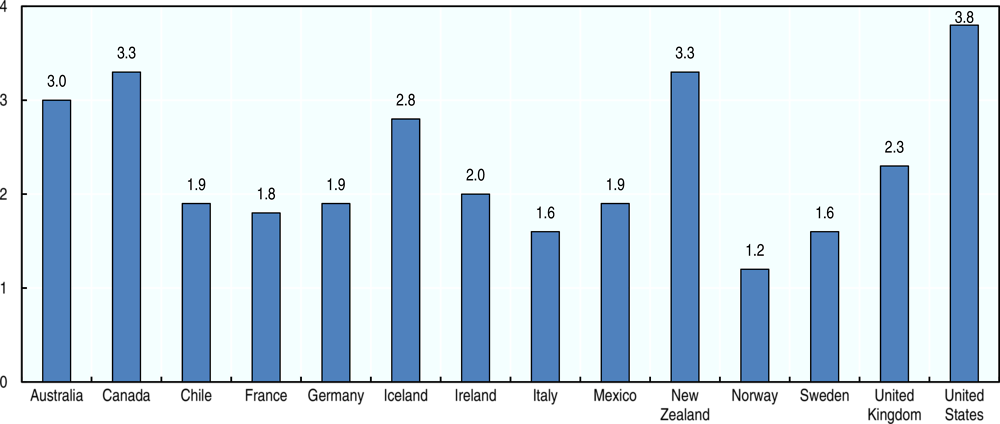
Note: Countries are not ordered given that estimates of the LGB population rely on survey methods that differ across countries.
Source: OECD calculations based on the surveys reported in Annex Table 1.A.1.
1.1.1. Zooming in on LGB people
Further analysis of the estimates of the LGB population reported in Figure 1.1 shows a fairly equal breakdown across homosexuals and bisexuals, with the exception of Chile, Germany and Sweden. The proportion of homosexuals within the LGB population ranges from 44% in France to 58% in Norway (Figure 1.2). Women are as likely to report a LGB identity as their male counterparts. But this pattern masks heterogeneity across LGB subgroups: compared to men, women are less likely to self-identify as homosexual, but more likely to self-identify as bisexual.

Note: The breakdown of the LGB population across homosexuals and bisexuals is not available for Italy.
Source: OECD calculations based on the surveys reported in Annex Table 1.A.1.
Variation in the share of LGB people across countries critically depends on LGB people’s willingness to answer questions dealing with sexual self-identification, in a context where heterosexuality is still widely perceived as the norm or default sexual orientation. Consequently, survey methods that do not provide respondents with a sufficient sense of privacy, i.e. when the survey is based on computer-assisted personal interviewing or computer-assisted telephone interviewing, have proven to generate substantial underreporting of an LGB identity (Valfort, 2017[1]).
Data underlying Figure 1.1 confirm that estimates of the LGB population are significantly higher when they originate from surveys where the question on sexual self‐identification is completed by the respondent, rather than by the interviewer. This pattern holds even within the same country: of the eight US-based representative surveys for which LGB data are publicly available, four ask the question on sexual self‐identification in the framework of a self-administered module. They reveal a share of LGB people equal to 4.6%, as opposed to 2.9% when attention is restricted to the four surveys that exclusively rely on computer-assisted personal interviewing or computer-assisted telephone interviewing.
Although they allow for identifying people who view themselves as lesbian, gay or bisexual, questions on sexual self-identification underestimate the share of people who are LGB from a more objective point of view, i.e. based on their sexual behaviour or sexual attraction (Box 1.2). The size of the LGB population is 70% larger when it is calculated based on individuals’ sexual behaviour (instead of individuals’ sexual self-identification), and more than twice as large when sexual attraction is taken as a criteria (Figure 1.3).
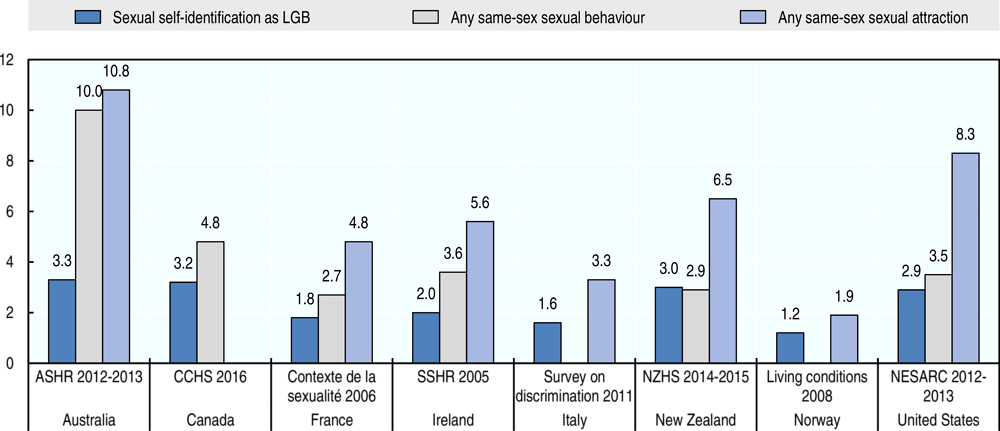
Note: The figure presents only one survey by country but similar results emerge with other surveys.
Source: OECD calculations based the surveys reported in Annex Table 1.A.1.
That the share of LGB people reaches its maximum with measures of sexual attraction and its minimum with measures of sexual self-identification is not surprising. Sexual attraction is indeed a more inclusive concept than sexual behaviour, which is itself more inclusive than sexual self-identification: not all people who feel attracted to same-sex people engage in same-sex sexual behaviour, and not all people who engage in same-sex sexual behaviour view themselves as lesbian, gay or bisexual. But another explanation flows from the observation that LGB people are more likely to refrain from disclosing who they are if they are asked to self-identify as lesbians, gay men or bisexuals, rather than specify the sex of the persons with whom they have sex or to whom they feel sexually attracted (Coffman, Coffman and Ericson, 2017[5]).
Respondents’ sexual orientation can be measured through three different types of questions (Williams Institute, 2009[6]):
-
Questions on sexual self-identification
-
They capture how the respondent identifies his/her sexual orientation
-
They typically read as follows: Which of the following options best describes how you think of yourself?
-
Straight (Heterosexual)
-
Gay or Lesbian (Homosexual)
-
Bisexual
-
Other
-
Don’t know/Refused
-
-
Questions on sexual self-identification are asked in the framework of nationally representative surveys conducted by public institutions in 15 OECD countries (Annex Table 1.A.1).
-
-
Questions on sexual behaviour
-
They capture the sex of the respondent’s sex partner(s)
-
They typically read as follows: In the past [time period e.g. year] who have you had sex with?
-
I have exclusively had female sex partners
-
I have had mostly female sex partners and at least one male sex partner
-
I have had approximately equal numbers of female and male sex partners
-
I have had mostly male sex partners and at least one female sex partner
-
I have exclusively had male sex partners
-
I have had sex with neither women nor men
-
Don’t know/Refused
-
-
Among the 30 nationally representative surveys reported in Annex Table 1.A.1, 10 include a question on sexual behaviour.
-
-
Questions on sexual attraction
-
They capture the sex of people the respondent feels sexually attracted to
-
They typically read as follows: In the past [time period e.g. year] who have you felt sexually attracted to?
-
Only attracted to females
-
Mostly attracted to females
-
Equally attracted to females and males
-
Mostly attracted to males
-
Only attracted to males
-
I have never felt sexually attracted to anyone at all
-
Don’t know/Refused
-
-
Among the 30 nationally representative surveys reported in Annex Table 1.A.1, 10 include a question on sexual attraction.
-
1.1.2. What about transgender individuals?
Estimates of the transgender population remain scarce. To the best of our knowledge, only three OECD countries collect information on gender identity in one of their nationally representative surveys: the United States since 2013, Chile since 2015 and Denmark since 2017 (Annex Table 1.A.2).
Transgender individuals stand for a smaller minority than LGB people. Based on the latest estimates available, their percentage in the adult population ranges from 0.1% in Chile to 0.3% in the United States (estimates of the transgender population in Denmark have not been released yet). Yet, these estimates do not rely on best-practices to collect information on gender identity (Box 1.3).
There are different ways to identify transgender people in nationally representative surveys. It can be done either through a one-step approach or through a multiple-step approach (Williams Institute, 2014[7]):
-
In the one-step approach, the respondent is asked whether she considers herself to be transgender (ideally by providing a clear definition of what “transgender” means), with the following options available: “Yes, male-to-female transgender”; “Yes, female-to-male transgender”; “Yes, gender-nonconforming transgender” (a person who does not conform to either of the binary definitions of male or female); “No”; “Don’t know”, “Refused”. This approach has been implemented by the Population Assessment of Tobacco and Health survey in the United States since 2013.
-
A multiple-step approach should ideally include three stages. In the first stage, the respondent is requested to report her assigned sex at birth: What sex were you assigned at birth, on your original birth certificate? (with the following options available: “Male”, “Female”). The second stage entails asking the respondent about her current gender identity: Which gender do you identify with today? (with the following options available: “Male”, “Female”, “Both male and female”, “Neither male nor female”, “Don’t know”, “Refused”). Finally, in case the respondent provides different answers to the first two questions, the same question as in the one-step approach should be asked: Do you consider yourself to be transgender? This latter question is necessary to the extent that not all people who provide a different answer to the “sex at birth” and “gender identity” questions would define themselves as “transgender”. This third question also avoids counting as transgender individuals who provide different answers simply due to misreporting. This approach has been implemented by the “Project SEXUS” survey in Denmark since 2017.
1.1.3. The share of LGBT people is on the rise
The percentage of individuals who self-identify as homosexuals or bisexuals has been increasing over time, which may reflect the general public becoming more open to LGBT people. Figure 1.4 presents the evolution of the share of individuals who self-identify as LGB, for a subset of surveys for which estimates of the LGB population in different survey rounds are available. Over a period of seven years, which is the average period of time between two survey rounds, this share rose by about 50%.
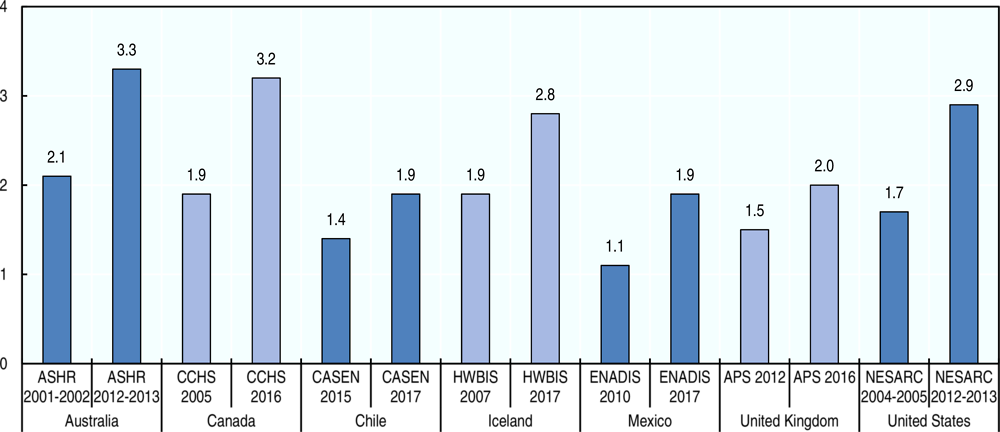
Note: The figure presents only one survey by country but similar results emerge with other surveys.
Source: OECD calculations based on the surveys reported in Annex Table 1.A.1.
The Gallup Daily tracking survey offers another striking illustration that the share of LGBT people is on the rise. Since 2012, this nationally representative survey has asked nearly two million US adults whether they personally identify as lesbian, gay, bisexual or transgender. The results reveal a clear increasing trend: the share of people who self-identify as LGBT rises from 3.5% in 2012 to 4.5% in 2017 (Figure 1.5). This trend is likely to continue in the future, since it is driven by younger cohorts. In 2017, only 1.4% of people born before 1945 consider themselves as LGBT, against 2.4% among baby boomers (born between 1946 and 1964), 3.5% among Generation X (born between 1965 and 1979), and 8.2% among millennials (born between 1980 and 1999).
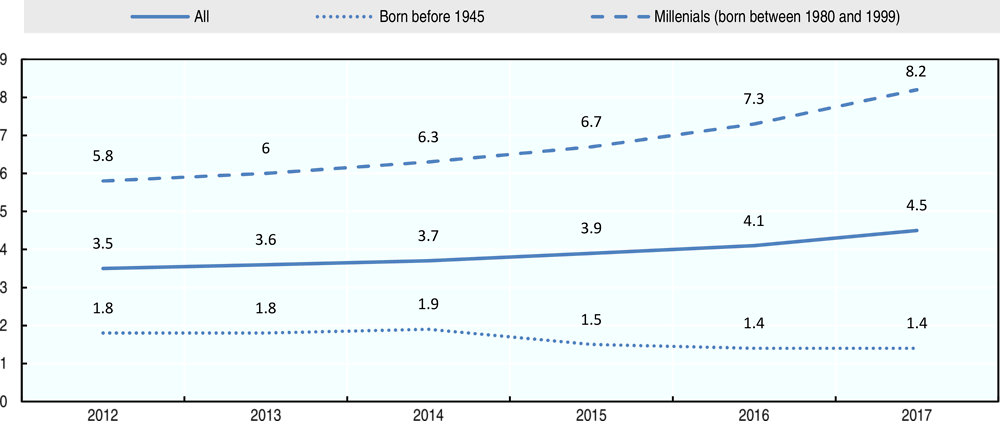
Source: https://news.gallup.com/poll/234863/estimate-lgbt-population-rises.asp.
1.2. How do LGBT people fare?
Previous studies have documented a shift toward greater acceptance of sexual and gender minorities, but evidence suggests that there is still a long way to go before LGBT people can benefit from full-fledged recognition (Valfort, 2017[1]). This section first analyses attitudes toward LGBT people in OECD countries. It then investigates the extent of anti-LGBT discrimination and explores how it affects LGBT people’s well-being.
1.2.1. Attitudes toward LGBT people
Cross-continent surveys on attitudes toward homosexuals have been conducted since 1981, while surveys on attitudes toward transgender people are more recent, with data first collected in 2012. No nationwide or cross-country survey captures attitudes toward bisexual people.
Acceptance of homosexuality and its evolution over time
There has been a shift toward greater acceptance of homosexuality, but homophobia remains widespread. Even across OECD countries, which rank among the most tolerant countries worldwide, the average respondent is only halfway to full social acceptance of homosexuality, scoring five on a 1-to-10 acceptance scale (Figure 1.6; Box 1.4). This average masks important disparities across countries, with the score of Iceland (8.3) more than five times as high as that of Turkey (1.6). Yet, with the exception of a few countries, attitudes toward homosexuality improved considerably over the past three decades.3

Note: Acceptance of homosexuality is measured on a scale from 1 to 10, where 1 means that homosexuality is never justifiable and 10 means that it is always justifiable.
Source: OECD compilation based on AsiaBarometer, European Values Survey, Latinobarometro and World Values Survey (see Box 1.4 for more details).
Prominent cross-continent or regional surveys have included two different questions on acceptance of homosexuality. The first captures the degree to which homosexuality is considered as “justifiable”, on any ground, by the respondent: Please tell me whether you think homosexuality can always be justified, never be justified, or something in between using this card (the card being a scale from 1 to 10, where 1 means that homosexuality is never justifiable and 10 means that it is always justifiable). This question is part of a battery of several questions about controversial behaviours and issues (e.g. abortion, divorce, euthanasia, prostitution, etc.) that have been asked in the following cross-country surveys: the AsiaBarometer, the European Values Survey, the Latinobarometro and the World Values Survey. The second question reflects whether the respondent would be comfortable with homosexuals as neighbours and has been asked in the AmericasBarometer, the European Values Survey, the Latinobarometro and the World Values Survey. In principle, the question asked by Gallup in their yearly cross-continent survey could be a third option: Is the city or area where you live a good place or not a good place to live for gay or lesbian people? However, this question provides less a measure of respondents’ own attitude toward homosexuality than of their perception of local social acceptance of gay men and lesbians. Moreover, this question has been asked only starting from the late 2000s, which limits the possibility to study the evolution of attitudes toward homosexuals over time.
In this section, acceptance of homosexuality is computed based on the question on the justifiability of homosexuality. Two reasons motivate this choice:
-
First, the wording of the question on the justifiability of homosexuality is the same across surveys. This consistency is not the case for the question on acceptance of homosexuals as neighbours. In fact, the AmericasBarometer is the only survey where this question explicitly refers to “homosexuals”: Are you comfortable with homosexuals as neighbours? (with the following options available: “Do not have a problem with having them as neighbours”, “Do not want them as neighbours”, “Don’t know” and “Refused”). In the other surveys, respondents have to choose people they would not like to have as neighbours, among a list that includes “homosexuals” or “gays”.
-
Second, answers to the question on the justifiability of homosexuality are easier to interpret than answers to the question on acceptance of homosexuals as neighbours. For the latter, no selection of the “homosexuals” or “gays” items by the respondents is interpreted as equivalent to accepting homosexuals as neighbours. Yet, this omission may reflect that the respondent considers these items as taboos, i.e. words to be proscribed due to the unacceptable reality they depict.
Acceptance of homosexuality is greater among women, younger adults, the better educated and people living in urban areas (Figure 1.7). The finding that women are more open to homosexuality than men is explained by the more negative attitudes of men toward gay men (Kite and Whitley, 1996[8]). In fact, men’s acceptance of lesbians is similar to women’s acceptance of both lesbians and gay men.

Note: Acceptance of homosexuality is measured on a scale from 1 to 10, where 1 means that homosexuality is never justifiable and 10 means that it is always justifiable.
Source: OECD compilation based on AsiaBarometer, European Values Survey, Latinobarometro and World Values Survey.
Young people are also more likely to show positive views on homosexuality. While the score on the “justifiability of homosexuality” scale reaches 6.0 (on a 1-to-10 acceptance scale) for people aged between 15 and 29, this score drops to 4.4 for people above 50 (Figure 1.7). These age differences can have two different causes: 1) an “ageing effect”, whereby individuals become less accepting as they grow older; 2) a “cohort effect”, whereby younger generations are exposed to social forces conducive to greater acceptance of sexual minorities. Evidence to date suggests that the latter effect is at work. A recent study provides a within-cohort analysis that reveals no substantial change in attitudes toward homosexuality over time and across a wide range of countries (Smith, Son and Kim, 2014[9]). That said, older cohorts are not fully impervious to the spread of more liberal views on homosexuality. An analysis of attitudinal changes in Canada and the United States identifies remarkable improvements over time in acceptance of homosexuality within all cohorts, which questions the conventional wisdom according to which opinions on controversial social issues would be formed by early adulthood and change little with age (Andersen and Fetner, 2008[10]).
Education seems to play a major role in explaining differences in attitudes toward homosexuality: the score of individuals with a college education (6.1) is two points higher than that of individuals who have, at most, a lower-secondary education (4.1) (Figure 1.7). This result may be in part due to education’s correlation with complex reasoning that increases individuals’ tolerance to nonconformity (Ohlander, Batalova and Treas, 2005[11]).
Finally, Figure 1.7 also reveals greater acceptance of homosexuality in urban than in rural settings. Consistent with this finding, evidence shows that same-sex couples are significantly more likely to locate in urban areas than do opposite-sex couples – Black, Sanders, & Taylor (2007[12]) in the United States; Rault (2016[13]) in France; Kroh, Kühne, Kipp, & Richter (2017[14]) in Germany.
Acceptance of transgender people
Only two cross-country surveys on attitudes toward transgender people have been conducted thus far: the Special Eurobarometer on Discrimination collected by the European Commission in 2012 and 2015, and the cross-continent survey conducted by the International Lesbian, Gay, Bisexual, Trans and Intersex Association (ILGA) in 2016 (Box 1.5).
The Special Eurobarometer on Discrimination includes three questions on attitudes toward transgender people:
-
Using a scale from 1 to 10, please tell me how you would feel about having a transgender or transsexual person in the highest elected political position in [your country] – where “1” means that the respondent would feel “not at all comfortable” and “10” that she would feel “totally comfortable” (this question was asked both in 2012 and 2015)
-
Regardless of whether you are actually working or not, please tell me, using a scale from 1 to 10, how comfortable you would feel if one of your colleagues at work was a transgender or transsexual person (this question was asked only in 2015)
-
Regardless of whether you have children or not, please tell me, using a scale from 1 to 10, how comfortable you would feel if one of your children was in a love relationship with a transgender or transsexual person (this question was asked only in 2015)
The 2016 ILGA survey includes the following two questions:
-
If a male child always dressed and expressed himself as a girl, would you find that acceptable?
-
If a female child always dressed and expressed herself as a boy, would you find that acceptable?
Respondents could answer “Yes”, “No, or “Don’t know”.
The Special Eurobarometer on Discrimination covers 23 European OECD countries, whereas the 2016 ILGA survey covers only 17 OECD countries. In both surveys, national samples include an average of 1 000 respondents.
These surveys reveal widespread discomfort toward transgender people. Among European OECD countries, an average of only 40% respondents would feel comfortable having a transgender or transsexual person in the highest elected political position, as a work colleague, or as a daughter- or son-in-law (Figure 1.8, Panel A). Moreover, less than half (44%) of respondents in the 17 OECD countries covered by the 2016 ILGA survey would accept a transgender child, noting a clear gender divide: a transgender child is at greater risk of being rejected if she is male-to-female rather than female-to-male (Figure 1.8, Panel B). That said, acceptance of transgender people remains higher in OECD countries than elsewhere. Among the 37 non-OECD countries covered by the 2016 ILGA survey, only 25% of respondents would accept a transgender child.
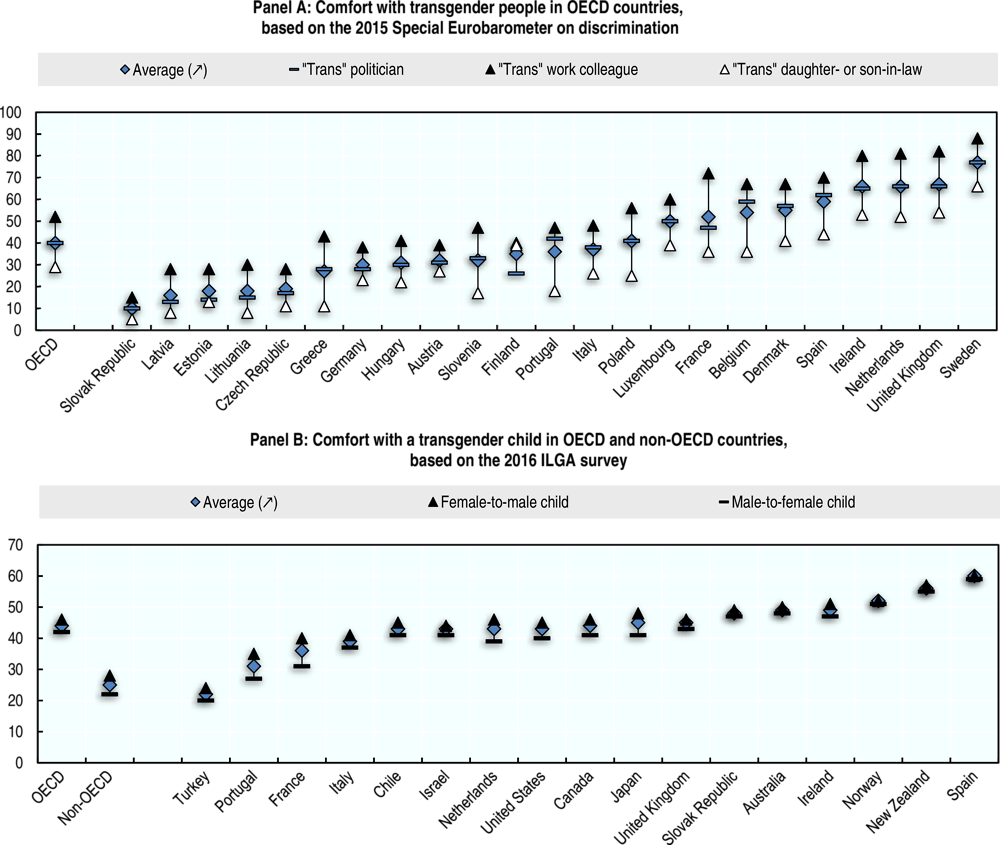
Note: The figure in Panel A reports the percentage of respondents who answered “7”, “8”, “9” or “10” to the following questions: i) using a scale from 1 to 10, please tell me how you would feel about having a transgender or transsexual person in the highest elected political position in [your country] (comfort with a “trans” politician); ii) regardless of whether you are actually working or not, please tell me, using a scale from 1 to 10, how comfortable you would feel if one of your colleagues at work was a transgender or transsexual person (comfort with a “trans” work colleague); iii) regardless of whether you have children or not, please tell me, using a scale from 1 to 10, how comfortable you would feel if one of your children was in a love relationship with a transgender or transsexual person (comfort with a “trans” daughter- or son-in law). The figure in Panel B reports the percentage of respondents who answered “yes” to the following questions: i) if a female child always dressed and expressed herself as a boy, would you find that acceptable? (acceptance of a female-to-male child); ii) if a male child always dressed and expressed himself as a girl, would you find that acceptable? (acceptance of a male-to-female child).
Source: 2015 Special Eurobarometer on Discrimination for Panel A and 2016 ILGA survey for Panel B.
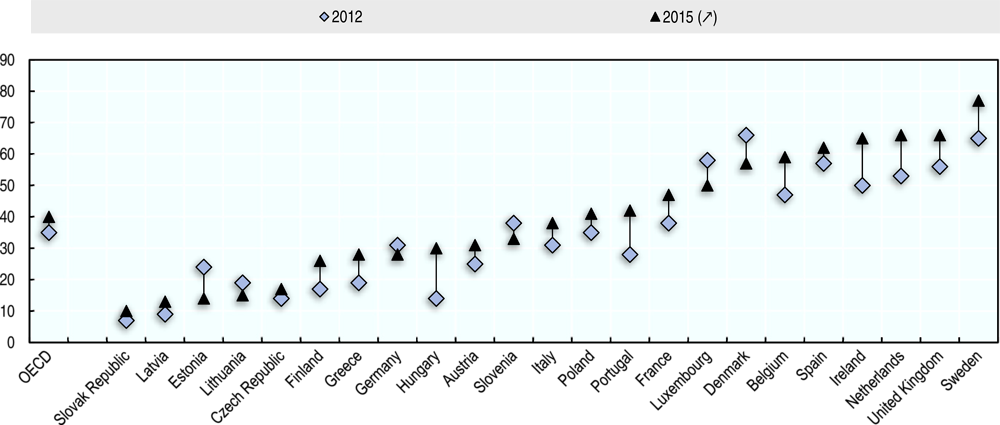
The Special Eurobarometer on Discrimination indicates a modest shift toward greater acceptance of transgender people (Figure 1.9). The share of respondents who report comfort rises from 35% in 2012 to 40% in 2015. This average masks strong disparities, though. Notably, six of the 23 European OECD countries experience a decrease in the share of respondents who display positive attitudes toward a transgender or transsexual person in the highest political office: Estonia (-10 percentage points), Denmark (-9 percentage points), Germany (-3 percentage points), Lithuania (-4 percentage points), Luxembourg (-8 percentage points) and Slovenia (-5 percentage points).
Note: This figure reports the percentage of respondents who answered “7”, “8”, “9” or “10” to the following question, in both 2012 and 2015: “using a scale from 1 to 10, please tell me how you would feel about having a transgender or transsexual person in the highest elected political position in [your country]”.
Source: 2012 and 2015 Special Eurobarometer on Discrimination.
Socio-economic characteristics negatively correlated with homophobia also appear to be negatively linked to attitudes towards transgender people: women, younger and more educated people are more supportive of transgender people. Based on the 2015 Special Eurobarometer, 56% of women report to be comfortable or indifferent with having a transgender or transsexual person in the highest elected political office, compared with 48% of men. Additionally, 62% of 15-24 year olds display comfort or indifference, as opposed to 45% of those aged 55 or over. Comfort levels are also stronger among the better educated: 59% of those who finished education at the age of 20 or older would be comfortable or indifferent, compared with 44% of those who ended education at the age of 15 or younger. The same pattern is observed for questions that address working with a transgender or transsexual person, or having sons or daughters in a relationship with such a person – see Norton & Herek (2013[15]) and Flores (2015[16]) for similar findings in the United States.
Comparing acceptance of homosexuality with acceptance of transgender people
Acceptance of homosexuality and acceptance of transgender people are strongly correlated. Both attitudes toward homosexuals and attitudes toward transgender people are shaped by how strongly one endorses the essentialist view that people fall into two distinct gender identities (male and female) that match biological sex at birth and feel sexual attraction to one another. Moreover, it is likely that the frontier between homosexuality and a transgender identity is particularly fuzzy from the general public’s perspective. Transgender people are indeed significantly more likely to self-identify as LGB (Downing and Przedworski, 2018[17]).
Despite this correlation, comfort with transgender people appears lower than comfort with LGB people. On average, 49% of respondents report comfort with LGB people, as opposed to 40% who report comfort with transgender individuals (Figure 1.10).
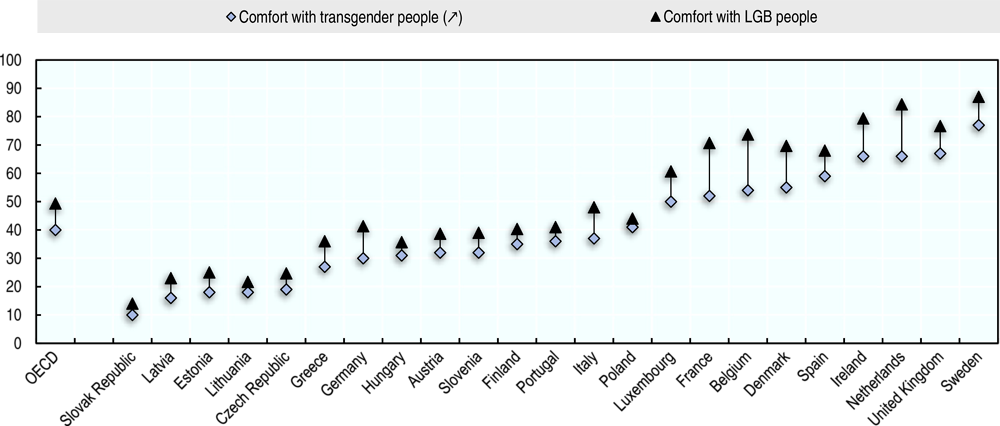
Note: “Comfort with transgender people” refers to the average percentage of respondents who answered “7”, “8”, “9” or “10” to the following questions: i) using a scale from 1 to 10, please tell me how you would feel about having a transgender or transsexual person in the highest elected political position in [your country]; ii) regardless of whether you are actually working or not, please tell me, using a scale from 1 to 10, how comfortable you would feel if one of your colleagues at work was a transgender or transsexual person; iii) regardless of whether you have children or not, please tell me, using a scale from 1 to 10, how comfortable you would feel if one of your children was in a love relationship with a transgender or transsexual person. “Comfort with LGB people” refers to the average percentage of respondents who answered “7”, “8”, “9” or “10” to the following questions: i) using a scale from 1 to 10, please tell me how you would feel about having a gay, lesbian or bisexual person in the highest elected political position in [your country]; ii) regardless of whether you are actually working or not, please tell me, using a scale from 1 to 10, how comfortable you would feel if one of your colleagues at work was a gay, lesbian or bisexual person; iii) regardless of whether you have children or not, please tell me, using a scale from 1 to 10, how comfortable you would feel if one of your children was in a love relationship with a gay, lesbian or bisexual person. This measure of comfort with LGB people differs from the measure of acceptance of homosexuality provided in Figure 1.6.
Source: 2015 Special Eurobarometer on Discrimination.
1.2.2. Are LGBT people discriminated against?
Acceptance of homosexuals and transgender people by the general public remains low, which puts LGBT people at risk of discrimination. This section explores three types of evidence to shed light on whether sexual and gender minorities are indeed unfairly treated compared to heterosexual and cisgender – antonym of transgender – individuals: the perception of discrimination by LGBT people, the comparison of labour market outcomes across LGBT and non-LGBT individuals based on survey data, and lessons from randomised experiments.
Perception of discrimination by LGBT people
To date, only one cross-country survey has been conducted among LGBT people to measure their perception of discrimination. This survey was performed in 2012 by the European Union Agency for Fundamental Rights. Data were collected through an anonymous online questionnaire, among 93 079 people who self-identify as lesbian, gay, bisexual and/or transgender across the EU.
On average, more than one out of three LGBT respondents in European OECD countries report having personally felt discriminated against because of their sexual orientation and/or gender identity. This share ranges from 50% in Lithuania to 31% in Denmark (Figure 1.11). Consistent with attitudes toward LGB people being more positive than attitudes toward transgender people, the perception of discrimination is higher on average among transgender than among LGB individuals. Homosexuals report the highest level of discrimination in eight countries: Austria, Estonia, Greece, Hungary, Italy, Poland, Portugal and Slovenia.

Note: This figure reports the percentage of LGBT individuals who respond “yes” to the following question: “During the last 12 months, have you personally felt discriminated against because of being L, G, B or T in any of the following situations? i) when looking for a job; ii) at work; iii) when looking for a house or apartment to rent or buy (by people working in a public or private housing agency, by a landlord); iv) by healthcare personnel (e.g. a receptionist, nurse or doctor); v) by social service personnel; vi) by school/university personnel – this could have happened to you as a student or as a parent; vii) at a cafe, restaurant, bar or nightclub; viii) at a shop; ix) in a bank or insurance company (by bank or company personnel); x) at a sport or fitness club; (xi) when showing your ID or any official document that identifies your sex.”
Source: European Union Agency for Fundamental Rights (2014[18]).
Comparing labour market outcomes of LGBT and non-LGBT people based on representative survey data
Representative survey data reveal that LGBT people experience gaps in employment status and/or labour earnings compared with non-LGBT people. LGBT people are 7% less likely to be employed than non-LGBT people and their labour earnings are 4% lower (Figure 1.12). They also seem to be exposed to a glass ceiling: they are 11% less likely to hold a high managerial position. Overall, the penalty that LGBT individuals endure at school (Box 1.6) extends into the labour market.
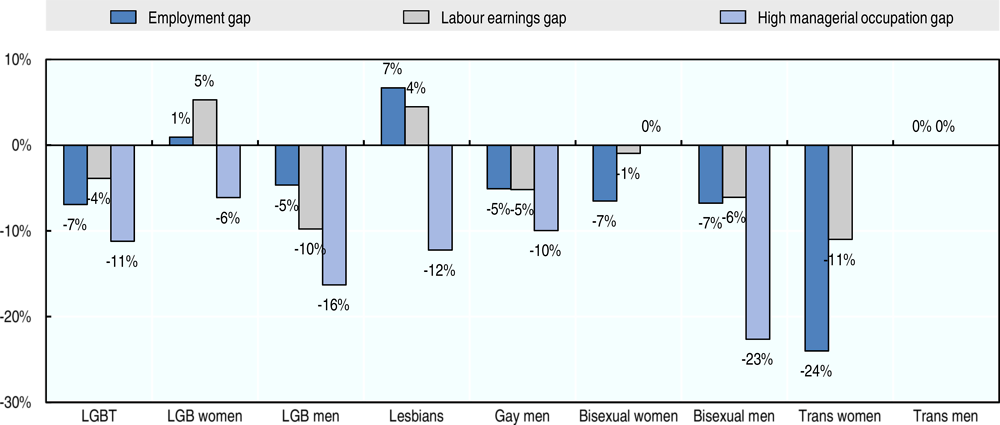
Note: A gap equal to zero indicates no difference in labour market outcomes between LGBT and non-LGBT individuals. The gaps are adjusted, meaning that the effect of a wide range of individual characteristics is neutralised: age, education, race/ethnicity, the presence of kids in the household, the number of hours worked, occupation and/or industry as well as location.
Source: These estimates are computed based on 46 research papers published in academic journals or prominent discussion paper series that cover 11 OECD countries: Australia, Canada, France, Germany, Greece, Ireland, the Netherlands, Poland, Sweden, the United Kingdom and the United States. LGB women, lesbians and bisexual women are compared to heterosexual women. LGB men, gay men and bisexual men are compared to heterosexual men. For the employment gap, transgender women (i.e. male-to-female transgender people) are compared to cisgender women, while transgender men (i.e. female-to-male transgender people) are compared to cisgender men. For the labour earnings gap, transsexual women and transsexual men are compared to themselves before they transition to the other gender. The category “LGBT” provides an average of the gaps computed for each subcategory of sexual and gender minorities.
OECD calculations based on 46 research papers (see the StatLink for a list).
Homophobic and transphobic bullying at school is a worldwide problem (UNESCO, 2016[22]). The victimisation of LGBT students ranges from the interference of homophobic and transphobic discourse in everyday interactions (e.g. the use of “dyke”, “faggot” or “tranny” as generalised derogatory comments among teenagers) to verbal harassment, physical violence or cyberbullying. In the United States, 70.1% of LGBT students experienced verbal harassment (e.g. called names or threatened) at school in the year preceding the 2017 National School Climate survey conducted among students between the ages of 13 and 21, 28.9% were physically harassed (e.g. pushed or shoved), 12.4% were physically assaulted (e.g. punched, kicked, injured with a weapon), and 48.7% experienced electronic harassment, via text messages or postings on social media (GLSEN, 2018[23]).
But discriminatory practices reported by LGBT students do not only stem from their peers. They also involve teachers and, more generally, the school administration. For instance, 31.3% of LGBT students declared being disciplined for public displays of affection that were not sanctioned among non-LGBT students. School policies and practices also target transgender students: 42.1% had been prevented from using their preferred name or pronoun and 46.5% had been required to use a bathroom of their legal sex (GLSEN, 2018[23]).
Experimental data confirm this survey-based evidence: schools discriminate against LGBT individuals, both as students and parents. In Serbia, an experiment was recently conducted to evaluate discrimination in access to basic education against “feminine boys”. It reveals that “feminine boys”, widely perceived as being gay, were at least three times more likely to be refused enrolment in primary schools (15%) compared to boys not perceived to be feminine (5%). Even when feminine boys were accepted, they met with twice as much hesitation and delay in accepting their enrolment. In the case of non-feminine boys, this hesitation was often linked to the boys’ school achievement and discipline, for feminine boys, on the other hand, it was exclusively linked to their femininity (Koehler, Harley and Menzies, 2018[24]). In Spain, another experiment examined whether schools are more reluctant to give information to homosexual parents during children’s pre-registration period (Diaz-Serrano and Meix-Llop, 2016[25]). The authors created three types of fictitious couples (one heterosexual, one same-sex male, and one same-sex female) and sent emails to schools in which these fictitious couples made a request for an interview and a visit. The results point to substantial discrimination against same-sex couples, a finding driven by the unfair treatment of partnered gay men: while the callback rate of partnered lesbians is indistinguishable from that of their heterosexual counterparts, the callback rate of heterosexual male couples is 50% higher than the callback rate of same-sex male couples (67% vs 45%).
Few studies have examined how sexual minority youth fare in academic terms. Recently, a study has taken full advantage of the US National Longitudinal Study of Adolescent to Adult Health. The results reveal that same-sex attraction or sexuality in adolescence is associated with a lower probability of high school graduation, for both male and female (Pearson and Wilkinson, 2017[26]).
However, these estimates must be taken with caution, since they likely constitute a lower bound of the penalty faced by sexual and gender minorities. Evidence suggests that LGBT people who disclose their sexual orientation and gender identity to the survey enumerator are not representative of the LGBT population as a whole: only the better off reveal who they are. For instance, among men who report having sex with men in the United States, those of advantaged background are more likely to self-identify as homosexual or bisexual (Barrett & Pollack (2005[19]); Pathela, et al. (2006[20])). Consistent with this finding, analysis of nationally representative surveys shows that the share of individuals who answer “Other”, “Don’t know” or “Refused” to the question on sexual self‐identification is disproportionately high among low-educated individuals.
The average penalty reported in Figure 1.12 masks important disparities across LGBT subgroups. Homosexuals are the group for which the comparison of labour market outcomes between LGBT and non-LGBT individuals yields the most contrasted results: lesbians benefit from an employment and wage premium compared to heterosexual women, while gay men suffer from an employment and wage penalty compared to heterosexual men. This result presumably flows from differences in the way partners specialize in paid and unpaid work across same-sex and opposite-sex couples: household specialisation is significantly lower among same-sex partnerships (Valfort, 2017[1]).4 Consequently, a partnered homosexual man is less involved in the labour market than a partnered heterosexual man, while a partnered homosexual woman is more involved in the labour market than a partnered heterosexual woman. By contrast, the labour market penalty exists for both bisexual women and men. It is also pervasive among transgender and transsexual individuals, but only if they are male-to-female.
Despite the difficulty to identify an employment and wage penalty for lesbians and gay men, a body of complementary survey-based evidence suggests that both lesbians and gay men face barriers in the labour market. Several studies have shown that female like male homosexuals are less satisfied with their jobs than their heterosexual counterparts. They report lower satisfaction with total pay, promotion prospects and respect received from their supervisor, controlling for important characteristics such as education, occupation or mental health (Valfort, 2017[1]). In Sweden, both gay men and lesbians display lower employment rates in regions with more hostile attitudes toward homosexuals (Hammarstedt, Ahmed and Andersson, 2015[21]).
Experimental evidence
The fact that survey-based evidence points to a penalty for LGBT people is not sufficient to conclude that sexual and gender minorities are discriminated against. This penalty can indeed flow from mechanisms that have nothing to do with anti-LGBT discrimination. For instance, the fact that lesbians and gay men in Sweden display lower employment rates in regions with more hostile attitudes toward homosexuals may simply reflect that more productive lesbians and gay men are more likely to move out of regions showing low acceptance of homosexuality.
To better measure anti-LGBT discrimination, experiments are key. In the labour market, these experiments mainly take the form of “correspondence studies”. These studies consist in sending out, in response to real job ads, the CVs and letters of application of fictitious candidates who are identical save their sexual orientation or gender identity. Any difference in the rate at which these fictitious candidates are invited to a job interview by employer is interpreted as evidence of discrimination based on sexual orientation or gender identity.
To date, 14 correspondence studies published in academic journals or discussion paper series have been conducted in order to measure hiring discrimination against LGBT applicants in OECD countries. These studies cover ten countries (Austria, Belgium, Canada, France, Germany, Greece, Italy, Sweden, the United Kingdom and the United States) and have mainly been conducted within the last decade. Of these 14 studies, 13 test for hiring discrimination against homosexual applicants. Only one correspondence study measures hiring discrimination against (male-to-female) transgender applicants. None investigates discrimination against bisexual applicants.
The 13 correspondence studies that test for hiring discrimination against homosexual applicants rely on three different approaches to signal sexual orientation. The first approach, used in nine of these 13 studies, consists in emphasizing the volunteer engagement or work experience of the homosexual applicant in a gay and/or lesbian organisation, e.g. local Gay People’s Alliance or gay and lesbian campus association – a volunteer engagement or work experience in a control philanthropic organisation is typically mentioned in the CV of the heterosexual applicant, that does not give any evidence of being gay or lesbian, e.g. Swedish Red Cross or an environmental organisation. The second approach, implemented in two of the 13 studies, entails stressing the sex of the candidate’s partner. This strategy is adopted in countries where it is common to specify the partner’s first and last name on CV (e.g. the Flanders region in Belgium or Germany). The third approach, performed in three of the 13 studies, relies on a weaker set of signals, such as mentioning the sex of the candidate’s partner in the letter of application, manipulating candidates’ sexual orientation on their Facebook profile, or signalling the candidate’s participation in LGBT events not restricted to LGBT participants, like the Gay Games.
Homosexual female and male applicants are 1.5 times less likely to be invited to a job interview when sexual orientation is conveyed through their volunteer engagement or work experience in a gay and/or lesbian organisation (Figure 1.13). By contrast, insisting on the family prospects of female fictitious candidates by signalling homosexuality through the sex of the candidate’s partner leads to the virtual disappearance of hiring discrimination against lesbians. This pattern could reflect that employers attach a lower risk of maternity to lesbians relative to heterosexual women and are therefore less inclined to discriminate against them – see Petit (2007[27]) in France and Baert, De Pauw, & Deschacht (2016[28]) in Belgium for evidence that women are discriminated against when they apply for a job at a childbearing age.
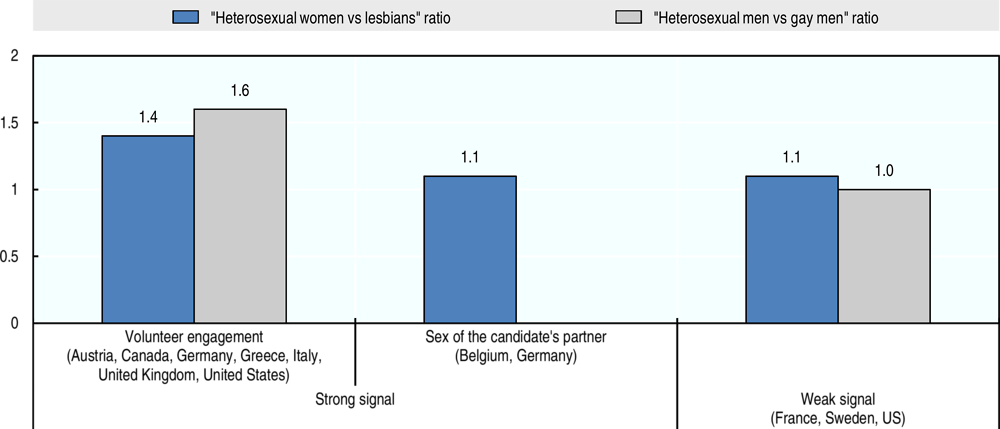
Note: A ratio equal to one indicates no difference in the rate at which heterosexual and homosexual applicants are invited to a job interview.
Source: OECD calculations based on 13 correspondence studies (see the StatLink for a list).
The difference in callback rate between fictitious heterosexual and homosexual applicants is negatively correlated with acceptance of homosexuality by the general public. In the United States, employers strongly discriminate against sexual minorities in the southern and midwestern states (Texas, Florida, Ohio), whereas they tend to treat heterosexual and homosexual candidates on an equal footing in the West and in the Northeast (California, New York, Pennsylvania) known to be more open to LGBT people (Tilcsik, 2011[29]). A correspondence study performed in two German cities characterised by opposite value orientations, Munich and Berlin, provides similar findings. While the population in Munich displays conservative attitudes, that of Berlin is known to support liberal views. The results reflect this divide: homosexual applicants are discriminated against in Munich but not in Berlin (Weichselbaumer, 2014[30]). Labour market discrimination against lesbians and gay men also depends on the gender composition within the occupation tested. In Sweden, gay men are discriminated against when they apply to male-dominated occupations (e.g. construction or mechanic worker), while these occupations are not particularly hostile to lesbians. Similarly, lesbians are discriminated against when they apply to female-dominated occupations (e.g. preschool teacher or nurse), but this is not the case for gay men (Ahmed, Andersson and Hammarstedt, 2013[31]). In the United Kingdom, gay men receive fewer callbacks for vacancies in which personality traits perceived as masculine are stressed in the job ad (i.e. the ideal job applicant is described as “ambitious,” “assertive,” or “actingas a leader”). Conversely, lesbians receive fewer invitations to job interviews for vacancies in which personality traits perceived as feminine are emphasised, i.e. the ideal job applicant is described as “affectionate,” “cheerful,” or “sensitive to the needs of others” (Drydakis, 2015[32]).
Some correspondence studies have detected wage discrimination, on top of hiring discrimination. In Athens, this wage discrimination mainly penalizes lesbians: they are offered a monthly wage that is 6% lower than that proposed to heterosexual women – (Drydakis, 2009[33]) and (Drydakis, 2011[34]).5
Only one correspondence study investigated hiring discrimination on the ground of gender identity (Bardales, 2013[35]). It compares the callback rate of fictitious male-to-female transgender candidates with the callback rate of fictitious female cisgender candidates who apply to high-skilled jobs in Texas. The results reveal strong discrimination against the trans woman: the callback rate of the cisgender woman is 50% higher than hers. This result is consistent with the findings of a small-scale experiment that was conducted in 2008 in the Manhattan’s retail sector. Out of 24 employers tested, male-to-female, female-to-male and gender-nonconforming transgender applicants were six times less likely than their cisgender counterparts to receive a job offer: the job offer rate for the cisgender applicants was 50%, as opposed to 8.3% for the transgender applicants (Make the Road New York, 2010[36]).
Overall, correspondence studies reveal substantial discrimination against LGBT people, as does complementary experimental evidence outside the labour market (Box 1.7). One could object that the experimental results reported here apply to only a subset of LGBT individuals, those who are “out of the closet” in the labour market. But these results are also valid for LGBT individuals who, although they do not disclose their sexual orientation or gender identity, are perceived by their work environment as non-heterosexual or non‐cisgender. These cases may not be exceptions. Evidence suggests that individuals who self-identify as homosexual are significantly more likely to be viewed as homosexual by external observers not informed of their sexual orientation (Rule and Ambady, 2008[37]). Similarly, a transgender identity may be detectable, even if it is not verbally disclosed. In the EU, nearly two thirds of transgender do not avoid expressing their preferred gender through their physical appearance and clothing (European Union Agency for Fundamental Rights, 2014[18]). Moreover, the legal and preferred first names of transgender people often conflict with each other, unless transgender people have gone through a legal process to change their gender marker. This conflict is typically unveiled during the first job interview, when recruiters ask for applicants’ identity documents and/or diplomas.
A range of field experiments have revealed substantial discrimination against lesbians and gay men outside the labour market. In the rental housing market, correspondence studies show that homosexual couples get fewer responses and invitations to showings from the landlords than heterosexual couples, a result mainly driven by male same-sex partners – see Ahmed, Andersson, & Hammarstedt (2008[38]) and Ahmed & Hammarstedt (2009[39]) in Sweden; Lauster & Easterbrook (2011[40]) in Canada; U.S. Department of Housing and Urban Development (2013[41]) in the United States and Koehler, Harley, & Menzies (2018[24]) in Serbia. In Serbia, for instance, almost one in five (18%) of same-sex couples were refused rental of an apartment by the landlord, while none of the opposite-sex couples were. This average result masks strong disparities by gender: 29% of male same-sex couples were rejected, as opposed to only 8% of female same-sex couples. The absence (or lower magnitude) of discrimination against female same-sex couples could flow from landlords’ well documented preference for female rather than male tenants (Ahmed, Andersson and Hammarstedt, 2008[38]). In this setting, the benefit of having two women as tenants could counterbalance the perceived cost of renting to a lesbian couple.
Gay men and lesbians are discriminated against in broader dimensions of their everyday life. In the United States, David Jones sent letters from either a same-sex or opposite-sex couple, requesting weekend reservations for a one-bed room in hotels and bed-and-breakfast establishments (Jones, 1996[42]). His results show that opposite-sex couples are granted 20% more reservations than both male and female same-sex couples. Similarly, Walters and Curran (1996[43]) performed an audit study where same-sex and opposite-sex couples entered retail stores in the United States while an observer measures the time it takes for the staff to welcome them. They find this time to be significantly less for heterosexual than for both female and male homosexual couples who often were not assisted and who were more likely to be repudiated. In the United Kingdom, various experiments have also involved actors wearing a T-shirt with either a pro-gay slogan or without any slogan. These actors approach passers-by asking them to provide change. The findings point to less help provided to the ostensibly pro-gay person (Valfort, 2017[1]).
Sexual minorities appear unfairly treated even when they urgently need help. This finding derives from experiments that apply the so-called “wrong number technique”. In this approach, households receive apparently wrong-number telephone calls whereby the caller explains his/her need for his/her interlocutor to deliver an urgent message to the actual addressee of the call. More precisely, these experiments typically involve a male (resp. female) caller who seeks to reach his girlfriend (resp. her boyfriend) in case of a heterosexual relationship, or his boyfriend (resp. her girlfriend) in case of a homosexual relationship. Indicating that his (resp. her) car has broken down and that he (resp. she) is out of change at a pay phone, the caller requests help by asking the subject to call his (resp. her) partner for him (resp. her). Results consistently show that perceived heterosexuals are more likely to receive help than perceived homosexuals (Valfort, 2017[1]).
Other experiments use the so-called “lost-letter technique”. This approach consists of dispersing in city streets a large number of unmailed letters. The letters are enclosed in envelopes that have addresses and stamps on them but that have not yet been posted. When a person comes across one of these letters on the street, it appears to have been lost. Thus she has a choice of mailing, disregarding, or actively destroying the letter. By varying the name of the organisation to which the letter is addressed and distributing such “lost letters” in sufficient quantity, it is possible to obtain a return rate specific to the organisation. The focus of the technique is not on the individual reaction to the lost letters but, rather, on the rate of response for a particular organisation relative to other organisations that serve as controls. Lost-letter experiments typically reveal a lower return rate for LGBT-related organisations (Valfort, 2017[1]).
1.2.3. LGBT people’s well-being
The strong discrimination that LGBT people face put them at risk of low well-being. This section first clarifies how stigma can impair mental health. It then explores differences in health outcomes across LGBT and non-LGBT individuals. Finally, it shows that lower psychological well-being among sexual and gender minorities does at least partly flow from stigma.
Stigma and mental health
Sexual and gender minorities are widely exposed to stigma. LGBT people live in a social environment that largely views heterosexuality and cisgender identity, i.e. congruence between sex at birth and gender identity, as the only way of being normal. LGBT people therefore experience stress not undergone by heterosexual and cisgender individuals, the so-called minority stress (Meyer, 2003[44]).
This stress is suspected to seriously hamper sexual and gender minorities’ mental health, by generating anxiety, depression, suicide ideation and attempt, substance use and abuse: in short, low life satisfaction. But there is no need to undergo physical or verbal violence for psychological distress to emerge. The fact that LGBT people feel forced to conceal their own identity in order to avoid stigmatisation, and thus maintain separate public and private personalities, is viewed as enough to generate mental health disorders. This ill-being in turn has the potential to impair LGBT people’s physical health by providing a fertile ground to other pathologies, such as cardiovascular diseases.
Stigma can negatively affect LGBT people’s health outcomes in a number of additional ways. Such is discrimination from medical practitioners, low health insurance coverage, or the obligation for some LGBT individuals to engage in hazardous occupations (Box 1.8).
First, medical practitioners are not exempt of negative feelings toward LGBT people – see Sabin, Riskind, & Nosek (2015[45]) for the United States. Consistent with this finding, LGBT individuals perceive significant discrimination from medical practitioners: 10% of LGBT living in the EU who accessed healthcare in the year prior to the survey felt personally discriminated against by healthcare personnel (European Union Agency for Fundamental Rights, 2014[18]).
Second, LGBT people experience a health insurance gap. Health insurance coverage is indeed less likely to include an employee’s same-sex than opposite-sex partner. In the United States, for instance, the legalisation of same-sex marriage in 2015 did not require private employers to treat same-sex and opposite-sex spouses on an equal footing. In 2018, more than one third of employers offering health insurance to opposite-sex spouses were not offering this benefit to same-sex spouses, according to the Kaiser Family Foundation.1
Third, stigma both within and outside the family compels some LGBT individuals to engage in hazardous occupations. A recent study in Italy finds that past experiences of discrimination are strongly correlated with transgender people’s decision to become sex workers (D’Ippoliti and Botti, 2017[46]). Consistent with this finding, transgender people are overrepresented among prostitutes (Valfort, 2017[1]).
← 1. See “Access to employer-sponsored health coverage for same-sex spouses: 2018 update” on www.kff.org.
The mental health of LGBT people
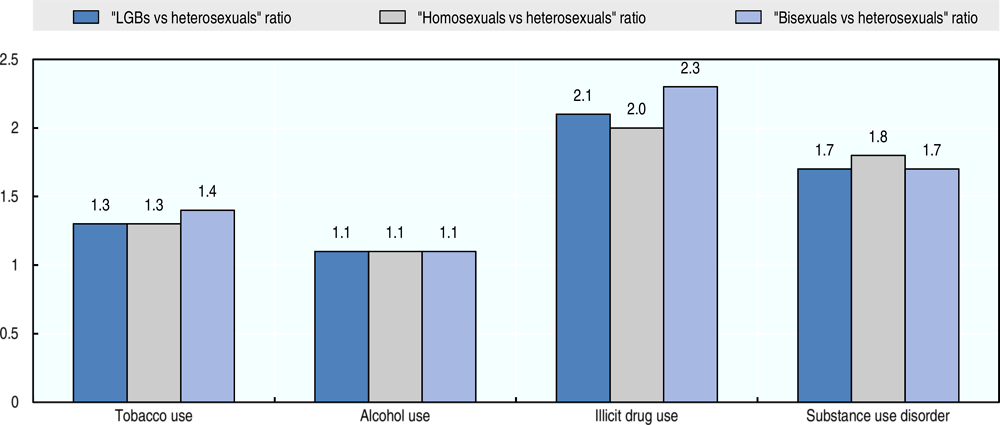
Mental health disorders are more frequent among LGB than heterosexual individuals (Figure 1.14). For instance, LGB respondents are more than twice as likely to have ever been diagnosed with a depressive disorder (Germany), nearly three times as likely to have experienced a major depressive episode in the year preceding the survey (United States), and nearly ten times as likely to have attempted suicide in that past year (Sweden). These gaps remain significant even when one controls for a wide range of individual characteristics. Results from wave 2015 of the NSDUH in the United States also confirm LGB people’s greater likelihood of substance use and abuse (Figure 1.15). Not surprisingly, LGB individuals are also significantly less likely to have optimal cardiovascular health compared to heterosexuals – Saxena, et al. (2018[47]) in the United States. Overall, homosexuals and bisexuals present lower scores on a life satisfaction scale than do their heterosexual counterparts (Figure 1.16). Bisexuals show worse mental health outcomes and life satisfaction than homosexuals, perhaps because they are more prone to “stay in the closet”, i.e. conceal who they are from others – Pew Research Center (2013[48]) in the United States; European Union Agency for Fundamental Rights (2014[18]) in the EU.

Note: A ratio equal to one indicates no difference in the probability of various mental health disorders between LGB and non-LGB individuals. These ratios are unadjusted, meaning that they do not neutralize the effect of other individual characteristics. However, the mental health penalty of LGB individuals persists in studies that control for those characteristics.
Source: The MHI-5 index in the Australian survey HILDA is comprised of five items that assess frequency – using a 6-point scale – of symptoms of anxiety and mood disturbance over the 4-week period preceding the administration of the survey.
OECD calculations based on SOEP 2016 (Germany), Survey of Living Conditions 2008 (Norway), HILDA 2012 (Australia), NSDUH 2015 (United States) and HET 2010-2012 (Sweden).
Note: A ratio equal to one indicates no difference in the probability of substance use and abuse between LGB and non-LGB individuals. These ratios are unadjusted, meaning that they do not neutralize the effect of other individual characteristics.
Source: Tobacco use refers to tobacco product use in the month prior to the interview. Alcohol use refers to alcohol use in the month prior to the interview. Illicit drug use refers to the use of any of the following illicit drug in the year prior to the interview: marijuana; cocaine in any form, including crack; heroin; hallucinogens; inhalants; methamphetamine; and the misuse of prescription pain relievers, tranquilizers, stimulants, and sedatives. Substance use disorder refers to clinically significant impairment caused by the recurrent use of alcohol or other drugs (or both), including health problems, disability, and failure to meet major responsibilities at work, school, or home.
OECD calculations based on NSDUH 2015 (United States).
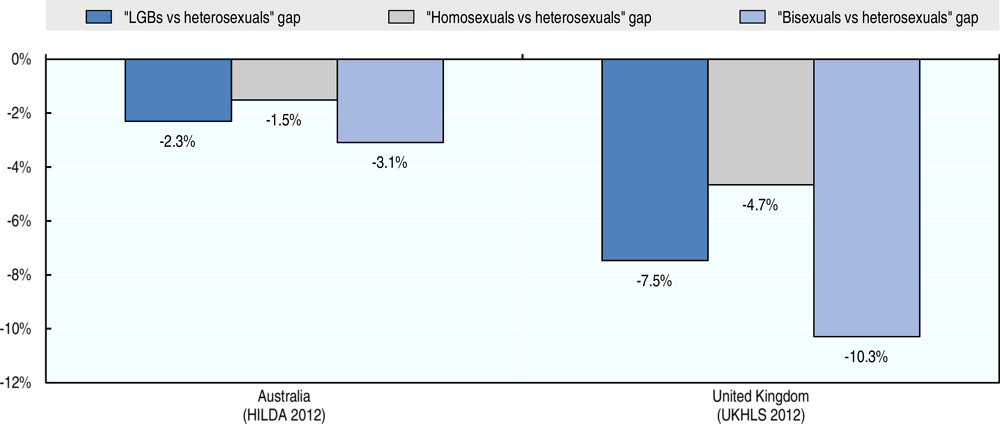
Note: A gap equal to zero indicates no difference in life satisfaction between LGB and non-LGB individuals. The gaps are adjusted, meaning that the effect of the following individual characteristics is neutralised: age, gender, ethnicity, marital status, highest educational qualification, employment status, and religion.
Source: In HILDA 2012 (Australia), respondents are asked to self-report satisfaction with life overall, on a scale from 0 (completely dissatisfied) to 10 (completely satisfied). As similar approach is used in the UKHLS 2012 (United Kingdom).
OECD calculations, based on Perales (2016[50]) for HILDA 2012 (Australia) and on Booker, Rieger, & Unger (2017[51]) for UKHLS 2012 (United Kingdom).
Representative samples show that transgender individuals are also at a much higher risk of mental health disorders than their cisgender counterparts (Downing and Przedworski, 2018[17]). The higher risk is prevalent for all categories of transgender individuals – female to male, male to female and gender non-conforming. On average, transgender individuals are around twice as likely as their cisgender counterparts to: i) have ever been diagnosed with a depressive disorder; ii) have had more than 14 days of poor mental health including stress, depression, and problems with emotions in the past 30 days; iii) have had serious difficulty concentrating, remembering, and making decisions because of physical, mental, or emotional conditions. They are also nearly twice as likely as their cisgender counterparts to have been diagnosed with a coronary heart disease or myocardial infarction.
Transsexuals, i.e. transgender who have undergone hormone-replacement therapy and sex-reassignment surgery, are no exception. Based on administrative Swedish data, transsexuals are nearly 3 times more exposed to psychiatric inpatient care than their non‐transsexual counterparts (Dhejne et al., 2011[49]). Additionally, they show a three-fold higher mortality risk, particularly due to death by suicide – they are nearly eight times as likely to attempt suicide – and by cardiovascular disease.
Is stigma at play?
A rapidly growing literature is trying to identify a causal impact of stigma on LGBT people’s mental health. In the United States, for instance, various studies have taken advantage of the sequential adoption or ban of same-sex marriage across US states (Valfort, 2017[1]). One study shows that LGB people living in states that passed constitutional amendments banning same-sex marriage in 2004 experienced significant increases in mood, anxiety, and substance disorders, which was not the case of LGB individuals living in states without these amendments. A complementary analysis that focuses on health care use reveals that, in the twelve months after the enactment of laws permitting same-sex marriage in Massachusetts in 2003, sexual minority men (women are absent from the sample) had a statistically significant decrease in medical care and mental health care visits and costs. Similar findings emerge outside the United States. A recent study exploits the implementation in late 2017 of a national plebiscite on same-sex marriage legislation in Australia and interpret the share of “No” voters at the electorate level as a measure of stigma. They show that LGB people report comparatively worse life satisfaction, mental health and overall health in constituencies with higher shares of “No” voters (Perales and Todd, 2018[52]).
One could argue, however, that these results are driven by confounding factors, e.g. state characteristics that change concomitantly to the adoption of LGBTI-inclusive laws. To address these issues, a control group composed of heterosexuals in order to run a comparative analysis of LGB health outcomes over time is needed. Such a “difference-in-difference” approach confirms that stigma undermines the mental health of sexual minorities: in the United States, the reduction in the number of suicide attempts between LGB and heterosexual youth is substantially higher in states that adopted same-sex marriage than in others – a trend that was not apparent before the implementation of LGB-inclusive policies. Same-sex marriage policies cause a reduction by nearly 15% of suicide attempts among adolescents who self-identify as gay, lesbian or bisexual (Raifman et al., 2017[53]).
1.3. What policies can improve LGBT inclusion?
Ensuring that LGBT individuals can openly express their sexual orientation and gender identity without being stigmatised, discriminated against, or attacked should be a policy priority, for at least three reasons. The first and most important reason is obviously ethical. Sexual orientation and gender identity are integral aspects of our selves. Guaranteeing that LGBT people are not condemned to forced concealment or retaliation when their identity is revealed should constitute an inalienable human right. The second reason is economic. Exclusion of LGBT people impedes economic development through a wide range of channels, such as lower investment in human capital, reduced output and productivity, public spending on social and health services that might be better spent elsewhere. The third reason why LGBT inclusion should constitute a priority is social. LGBT inclusion is viewed as conducive to the emergence of less restrictive gender norms that improve gender equality broadly speaking and, hence, expand social and economic roles, especially for women. Consistent with this intuition, acceptance of homosexuality is strongly correlated with support for gender equality worldwide (Figure 1.17).

Note: Acceptance of homosexuality is measured based on the following question: “Please tell me whether you think homosexuality can always be justified, never be justified, or something in between, using this card” (the card being a scale from 1 to 10, where 1 means that homosexuality is never justifiable and 10 means that it is always justifiable). Support for gender equality is an average of responses to the following three EVS/WVS questions: “When jobs are scarce, men should have more right to a job than women.” (=1 if agree, =2 if neither agree nor disagree, =3 if disagree); “On the whole, men make better political leaders than women do.” (=1 if strongly agree, =2 agree, =3 if disagree, =4 if strongly disagree), “A university education is more important for a boy than for a girl” (=1 if strongly agree, =2 agree, =3 if disagree, =4 if strongly disagree).
Source: The group “OECD” includes all OECD Member countries, with the exception of Israel and Slovak Republic where information on support for gender equality is missing.
OECD compilation based on AsiaBarometer, European Values Survey, Latinobarometro and World Values Survey.
1.3.1. Making LGBT individuals and the penalties they face visible in national statistics
Improving awareness that LGBT individuals constitute a sizeable minority that is discriminated against is an important prerequisite in order to improve their inclusion. Greater publicity of discriminatory behaviour can indeed bring meaningful change, in particular through greater self-control of discriminating individuals. For example, two US economists, Joseph Price and Justin Wolfers, published a study in 2002 demonstrating the existence of racial discrimination during National Basketball Association (NBA) games (Price and Wolfers, 2010[54]). In 2007, these results received considerable media attention (front-page coverage in the New York Times, radio and TV shows including comments from star basketball players, etc.). This media coverage allowed for putting an end to the racial discrimination it pinpointed: referees went on discriminating against opposite-race players until this bias became public, but they stopped discriminating afterwards. Complementary evidence suggests that this shift did not flow from dramatic institutional changes (firing of certain referees, changes in how referees are assigned to games, etc.). Rather, it is consistent with referees engaging in voluntary behavioural change after becoming aware of their own bias (Pope, Price and Wolfers, 2018[55]) – see Alesina, Carlana, Ferrara, & Pinotti (2018[56]) for similar findings among Italian schoolteachers.
Collecting information on sexual orientation and gender identity in censuses as well as national labour force, health and victimisation surveys is critical to create awareness. As it has already been stressed, only a minority of OECD countries (15) have included such questions in at least one of their nationally representative surveys, and even fewer (11 countries) do so on a regular basis. Yet, these countries constitute helpful precedents that contribute to disseminate good practices on how to best collect such sensitive information. The United Kingdom is, for instance, planning to include a question on sexual self-identification in its 2021 census. To that end, the Office for National Statistics has run a census test in 2017 whose lessons are enlightening for the United Kingdom and beyond (Box 1.9).
The United Kingdom is planning changes for the 2021 census. In particular, the upcoming census will be, for the first time, a self-completed online questionnaire that aims to include the following question on sexual self-identification: “Which of the following options best describes how you think of yourself? (this question is voluntary)”, with the following options: “Heterosexual or Straight”; “Gay or Lesbian”; “Bisexual”; “Other (please specify)”.
As part of the preparation, the United Kingdom conducted a field test in England and Wales in 2017: the census test. The census test involved a total of 208 000 households that were subject to a questionnaire with the sexual self-identification question in the treatment group, and without this question in the control group. The census test was followed by a census test evaluation survey, in particular to provide further understanding of how people feel about the inclusion of a question on sexual orientation. Complete and valid interviews were carried out with 1 839 people who also responded to the census test, and with 991 people who did not respond to the census test.
The purpose of both tests was to examine potential concerns around public acceptability and data quality. The Office for National Statistics aimed to explore whether including the question had an effect on response rates for other questions. They also investigated i) whether the question on sexual self-identification itself had a high non‐response rate, ii) whether it produced estimates that were comparable to the Annual Population Survey.
Public acceptability
The overall response rate for those who received the sexual orientation question was 38.6%. It was 39.0% for people whose questionnaire did not include this question. This is a difference of 0.4 percentage points, less than the maximum tolerance of 2 percentage points that coincides with thresholds set by the Office for National Statistics when testing new sensitive questions in previous censuses. Furthermore, the drop-off rate (people who stop completing the survey) at this question was very low: it was less than one in 1 500 responses. This suggests that this question does not stand out compared with the other questions. In fact, the sexual orientation question had similar online drop-off rates to the ethnic group question. Both of these have lower drop-off rates than the religion and national identity questions.
Data quality
Data quality critically depends on the level of item non-response (those who responded to the census test but did not complete the sexual self-identification question) and comparability with other sources (namely the Annual Population Survey). The level of item non-response for the sexual self-identification question was 8.4%, which is less than the 10% threshold set by the Office for National Statistics for a voluntary question. This is more, however, than the item non-response for a similar question asked in the 2016 Annual Population Survey, probably because respondents were also offered the option “Don’t know” in this survey, which is not the case of the question tested in the census test. For that reason, the Office for National Statistics is planning to add the option “Prefer not to say” to that question. Despite this higher item non‐response rate, the population identifying as gay, lesbian or bisexual in the census test (2.4%) was similar to the estimate in the 2016 Annual Population Survey (2.0%).
Overall, results from the census test suggest that including a question on sexual self-identification in the 2021 census would not significantly impact overall response and that responses to this question are of acceptable quality. That said, results from the census test evaluation survey point to further work to improve quality and notably reduce the item non‐response. For example, some members of the public did not answer the question because they did not understand why the information was needed. Others stated that the information is personal and private. To address these issues, the Office for National Statistics plans to review the question guidance explaining the reasons for asking this question, and to reiterate messages about the confidentiality of interviewees’ responses.
Source: Office for National Statistics (2018[58]).
An alternative strategy is to run a victimisation survey among a sufficiently large nationally representative sample of respondents in order to include a significant share of LGBT individuals and, hence, analyse their exposure to stigmatisation, discrimination and attacks, as compared to non-LGBT individuals. In France, the inter-ministerial body in charge of combating racism, anti-semitism and anti-LGBT hatred mandated the opinion poll company IFOP to run a self-administered online questionnaire among a representative sample of 12 137 respondents in 2018: 994 respondents (8.2%) self-identified as LGBT with the majority (53%) reporting exposure to verbal and physical violence at least once in their lifetime due to their sexual orientation or gender identity. Such a sample is also conducive to analyse employment and/or health disparities across LGBT and non-LGBT respondents. To learn more about experiences of sexual and gender minorities, it is also possible to run a survey that specifically targets LGBT individuals. In 2017, the UK government asked LGBT people to answer an online survey about different parts of their lives. More than 108 000 completed the survey, making it the largest national survey of its kind anywhere in the world. Results show that, although the United Kingdom has a proud record in advancing LGBT rights, many LGBT respondents report facing discrimination. Overall, just over half of the respondents said they were comfortable being LGBT in the United Kingdom, with transgender respondents expressing the lowest comfort (Government Equalities Office, 2018[57]).
1.3.2. Enforcing anti-discrimination and equality laws
Legally prohibiting anti-LGBT discrimination and ensuring equal rights to LGBT individuals is essential for their inclusion. One cannot expect to improve the situation of sexual and gender minorities if, to begin with, the law does not protect them against discrimination and abuses. As an illustration, LGBT employees report lower perceived discrimination and are more comfortable being open about their sexual orientation in firms that ban discrimination against them. LGBT employees also declare greater job commitment, improved workplace relationships, increased job satisfaction and better health outcomes in these settings. Consistent with these findings, the labour earnings penalty of sexual minorities is lower in localities or firms that protect them from discrimination (Valfort, 2017[1]).
However, there is still a long way before sexual and gender minorities meet full-fledged legal recognition. For instance, only a minority of countries worldwide (37%) prohibit discrimination in employment based on sexual orientation (ILGA, 2017[59]), as compared to more than two thirds that prohibit discrimination in employment based on gender, race, religion or disability.6 The share of countries worldwide that have legalised same-sex marriage is even lower (14%). OECD countries perform better than the worldwide average, but they still are not the champions of LGBT-inclusive laws. For instance, only a small majority (56%) have legalised same-sex marriage in at least parts of their national territory (Figure 1.18). Moreover, enacting anti-discrimination and equality laws is not sufficient per se to protect sexual and gender minorities. These laws must also be fully enforced, meaning that reporting, recording and sanctioning of anti-LGBT offences at home, at work, on the street, online, etc. should become more systematic.

Note: The 32 OECD countries that prohibit discrimination in employment based on sexual orientation as of 2017 are: Australia, Austria, Belgium, Canada, Chile, Czech Republic, Denmark, Estonia, Finland, France, Germany, Greece, Hungary, Iceland, Ireland, Italy, Latvia, Lithuania, Luxembourg, Mexico, Netherlands, New Zealand, Norway, Poland, Portugal, Slovak Republic, Slovenia, South Korea, Spain, Sweden, Switzerland, United Kingdom. The 20 OECD countries that have legalised same-sex marriage (at least in some part of their national territory) as of 1 January 2019 are: Australia, Austria, Belgium, Canada, Denmark, Finland, France, Germany, Iceland, Ireland, Luxembourg, Mexico, Netherlands, New Zealand, Norway, Portugal, Spain, Sweden, United Kingdom, United States.
Source: ILGA (2017[59]) and OECD research on national laws.
Enactment and enforcement of anti-discrimination and equality laws improve LGBT inclusion not only by discouraging potential offenders, but also by shaping the social norm. Individuals perceive legal changes as reflecting evolutions in what is socially acceptable and are willing to conform to these shifts (Tankard and Paluck, 2017[60]). Same-sex marriage or same-sex couples adoption legislation is strongly correlated with acceptance of homosexuality – see Hooghe & Meeusen (2013[61]) and Takács, Szalma, & Bartus (2016[62]) in Europe. While countries with greater acceptance of homosexuality are more likely to legalise same-sex marriage, evidence shows that legal changes do cause changes in attitudes. In Europe, for instance, acceptance of homosexuality increased much faster in countries where same-sex marriage is legal after those countries adopted same-sex relationship recognition policies (Aksoy et al., 2018[63]) – see Kreitzer, Hamilton, & Tolbert (2014[64]) and Flores & Barclay (2016[65]) for similar findings in the United States.
1.3.3. Educating people in countering their unconscious biases
Discrimination largely flows from unconscious biases (Kahneman, 2013[66]). Unconscious biases lead us to judge positively, even before we get to know them, people who are similar to us, and to “prejudge” negatively the others. Unconscious biases also largely account for stereotypes’ inaccuracy. Individuals tend to overestimate the weaknesses of dissimilar others and to underestimate their strengths, while they are prone to the opposite in face of similar others. Overall, unconscious biases contribute to minority groups, LGBT people included, being discriminated against by the majority.
Unconscious bias training should constitute a key component of any policy package aiming to improve LGBT inclusion. This training consists in making individuals aware of their unconscious prejudices and stereotypes and teaching them how to overcome them. Increasing attention is being devoted to training recruiters, managers and employees at large. In the Netherlands, the not-for-profit foundation Workplace Pride has developed LGBT inclusion training material directed at companies all over the world. In France, the 2017 Law “Equality and Citizenship” has made this training compulsory for people in charge of recruitment and human resources management in firms with 300 employees and above. In the United Kingdom, the Government Equalities Office is developing a training package to help employers and employees deal with LGBT discrimination in the workplace. Prejudice-reducing interventions at school are also critical, in order to counter unconscious biases at an early stage and combat homophobic and transphobic bullying at school that has proven to be a worldwide problem. As of today, half of European OECD countries are engaged in reducing negative representations of LGBT people among pupils, and/or in training teachers on how to create an LGBT-inclusive environment in the class (Box 1.10). That said, these actions are rarely compulsory and often restricted to specific cities or regions.
Evidence on the impact of de-biasing interventions in everyday life is scarce but shows that these interventions can be highly effective, even when they are short (Broockman and Kalla, 2016[67]). This result stems from the unique randomised field experiment on the topic. It was carried out in the context of a door-to-door operation in Florida in 2014, after the Miami-Dade County Commission passed an ordinance protecting transgender people from discrimination in housing, employment, and public accommodations. Fearing that this decision be submitted to citizens’ vote and repealed, LGBT associations went door to door to have conversations with Miami-Dade voters. The results show that this brief door-to-door intervention has made voters much more open and benevolent to transgender people, and more prone to endorse the ordinance prohibiting discrimination against transgender people if asked to. These effects were still visible three months after the door-to-door operation.
As of 2018, 14 of the 27 European OECD countries are engaged in reducing negative representations of LGBT people among pupils and/or in training teacher on how to create an LGBT-inclusive environment in the class: Belgium, Denmark, France, Germany, Iceland, Ireland, Italy, Luxembourg, Netherlands, Norway, Portugal, Sweden, Switzerland and the United Kingdom.
Belgium
Çavaria, an umbrella organisation of 120 LGBT associations, gives lectures in teacher training colleges and schools of education, but this not a mandatory subject.
Denmark
The municipalities of Copenhagen and Aarhus provide financial support to the project “Normstormerne” which offers norm-critical LGBT courses to schools and higher institutions of learning.
France
The Ministry of Education has signed partnership agreements with national civil society organisations (e.g. SOS homophobie) that are accredited by the government as “complementary associations of public education” to design school-based interventions for reducing anti-LGBT prejudice among pupils and train school staff. These interventions and training are optional.
Germany
Some federal states are active. In Saarland, the LSVD-Saar (“Lesbian and Gay Federation in Germany”) delivers school-based classes by gay and lesbian young people to talk about LGBT inclusion with the pupils. In Brandenburg, the project “Schule unterm Regenbogen” offers trainings for teachers on LGBT awareness. The state government of Berlin financially supports LGBT civil society organisations to provide training and educational materials for teachers, and school workshops for students.
Iceland
Samtökin ’78, the national queer organisation, has a contract with the Municipality of Reykjavík which includes financial support in exchange for extensive LGBT education in schools. There is also a new contract with the municipality of Hafnarfjörður which includes financial support in exchange for extensive teacher training as well as peer education for students. These are only two municipalities out of 75, but they are two of the largest ones.
Ireland
BeLonG To Youth Services, the national organisation supporting LGBT young people, provides non-mandatory training to professional educational services such as the professional development service for teachers in the national educational psychological service, and the education welfare service.
Italy
The activities of several civil society organisations a (Arcigay, Famiglie Arcobaleno, Arcilesbica, Agedo, Rete degli Studenti Medi, Progetto Alice, Scosse, Uaar, Unar) are supported by the government, in particular for the creation of campaigns or workshops in schools. In some cities and regions, associations are supported to create curricular or extracurricular activities for students and teachers.
Luxembourg
Civil society organisations and the Institut de Formation de l’Education Nationale (IFEN) offer various optional teacher and socio-educational staff trainings on creating LGBT‐inclusive environment at school.
Netherlands
Civil society organisations (e.g. COC Netherlands or EduDivers) are active in training teachers on LGBT awareness, although this training is only optional.
Norway
The current action plan Safety, diversity, openness (2016) focuses on the topic of an inclusive and safe psychosocial environment in schools for LGBT children and youth.
Portugal
The government provides periodic support to local civil society organisations. The LGBT youth NGO Rede Ex Aequo received funding to produce materials for teachers and students, as well as a specific one-year project including teacher training and an awareness raising campaign with posters and postcards. In 2017, with the support of public funding, ILGA Portugal started a two-year project aimed at the creation of alliances in school context, with several partnerships, including municipalities, other NGOs, and victim support services.
Sweden
All teachers must achieve 60 credits of basic education science. As part of this compulsory training, they receive information on how to prevent and tackle discrimination in schools. In particular, the National Agency for Education provides training that specifically addresses the inclusion of LGBT people in the class. Civil society organisations, like RFSL, offer specific workshops and deliver a certificate of competency to teachers who participate.
Switzerland
The Department of Education of Geneva provides support to civil society organisations and partnership agreements to set-up specific programmes to prevent homophobia, biphobia and transphobia in schools in Geneva.
United Kingdom
Some universities or schools provide teacher training, often in collaboration with civil society organisations. In England, Stonewall, offers training to universities. Moreover, LGBT Youth Scotland works with six of the eight teacher training universities in Scotland. Through lectures, workshops and seminars, trainee teachers are signposted to LGBT inclusion resources. For the majority of these institutions this work is not mandatory, but each year, roughly 1 500 trainee teachers access these sessions. This work is currently funded by the Scottish Government.
Source: IGLYO (2018[68]).
References
Ahmed, A., L. Andersson and M. Hammarstedt (2013), “Are Gay Men and Lesbians Discriminated against in the Hiring Process?”, Southern Economic Journal, Vol. 79/3, pp. 565-585, https://doi.org/10.4284/0038-4038-2011.317.
Ahmed, A., L. Andersson and M. Hammarstedt (2008), “Are lesbians discriminated against in the rental housing market? Evidence from a correspondence testing experiment”, Journal of Housing Economics, Vol. 17/3, pp. 234-238, https://doi.org/10.1016/j.jhe.2008.06.003.
Ahmed, A. and M. Hammarstedt (2009), “Detecting Discrimination against Homosexuals: Evidence from a Field Experiment on the Internet”, Economica, Vol. 76/303, pp. 588-597, https://doi.org/10.1111/j.1468-0335.2008.00692.x.
Aksoy, C. et al. (2018), Do Laws Shape Attitudes? Evidence from Same-Sex Relationship Recognition Policies in Europe, www.iza.org (accessed on 6 February 2019).
Alesina, A. et al. (2018), “Revealing Stereotypes: Evidence from Immigrants in Schools”, https://doi.org/10.3386/w25333.
Andersen, R. and T. Fetner (2008), “Cohort Differences in Tolerance of Homosexuality: Attitudinal Change in Canada and the United States, 1981-2000”, Public Opinion Quarterly, Vol. 72/2, pp. 311-330, https://doi.org/10.1093/poq/nfn017.
Baert, S., A. De Pauw and N. Deschacht (2016), “Do Employer Preferences Contribute to Sticky Floors?”, ILR Review, Vol. 69/3, pp. 714-736, https://doi.org/10.1177/0019793915625213.
Bajos, N., M. Bozon and N. Beltzer (2008), Enquête sur la sexualité en France : Pratiques, genre et santé, La Découverte, www.cairn.info/enquete-sur-la-sexualite-en-france--9782707154293.htm%22%22 (accessed on 6 February 2019).
Bardales, N. (2013), Finding a Job in a Beard and a Dress: Evaluating the Effectiveness of Transgender Anti-Discrimination Laws, www.semanticscholar.org/paper/Finding-a-Job-in-%E2%80%9C-a-Beard-and-a-Dress-%E2%80%9D-%3A-the-of-%E2%88%97-Bardales/b260619b3c78c224663689a6aae11785ed4aedde (accessed on 5 February 2019).
Barrett, D. and L. Pollack (2005), “Whose Gay Community? Social Class, Sexual Self-Expression, and Gay Community Involvement”, The Sociological Quarterly, Vol. 46/3, pp. 437-456, https://doi.org/10.1111/j.1533-8525.2005.00021.x.
Black, D., S. Sanders and L. Taylor (2007), “The Economics of Lesbian and Gay Families”, Journal of Economic Perspectives, Vol. 21/2, pp. 53-70, https://doi.org/10.1257/jep.21.2.53.
Blackless, M. et al. (2000), “How sexually dimorphic are we? Review and synthesis”, American Journal of Human Biology, Vol. 12/2, pp. 151-166, https://doi.org/10.1002/(SICI)1520-6300(200003/04)12:2%3C151::AID-AJHB1%3E3.0.CO;2-F.
Booker, C., G. Rieger and J. Unger (2017), “Sexual orientation health inequality: Evidence from Understanding Society , the UK Longitudinal Household Study”, Preventive Medicine, Vol. 101, pp. 126-132, https://doi.org/10.1016/j.ypmed.2017.06.010.
Broockman, D. and J. Kalla (2016), “Durably reducing transphobia: A field experiment on door-to-door canvassing”, Science, Vol. 352/6282, pp. 220-224, https://doi.org/10.1126/science.aad9713.
Coffman, K., L. Coffman and K. Ericson (2017), “The Size of the LGBT Population and the Magnitude of Antigay Sentiment Are Substantially Underestimated”, Management Science, Vol. 63/10, pp. 3168-3186, https://doi.org/10.1287/mnsc.2016.2503.
D’Ippoliti, C. and F. Botti (2017), “Sex Work among Trans People: Evidence from Southern Italy”, Feminist Economics, Vol. 23/3, pp. 77-109, https://doi.org/10.1080/13545701.2016.1177656.
Diaz-Serrano, L. and E. Meix-Llop (2016), “Do schools discriminate against homosexual parents? Evidence from a randomized correspondence experiment”, Economics of Education Review, Vol. 53, pp. 133-142, https://doi.org/10.1016/j.econedurev.2016.06.001.
Downing, J. and J. Przedworski (2018), “Health of Transgender Adults in the U.S., 2014-2016”, American Journal of Preventive Medicine, Vol. 55/3, pp. 336-344, https://doi.org/10.1016/j.amepre.2018.04.045.
Drydakis, N. (2015), “Sexual orientation discrimination in the United Kingdom’s labour market: A field experiment”, Human Relations, Vol. 68/11, pp. 1769-1796, https://doi.org/10.1177/0018726715569855.
Drydakis, N. (2011), “Women’s Sexual Orientation and Labor Market Outcomes in Greece”, Feminist Economics, Vol. 17/1, pp. 89-117, https://doi.org/10.1080/13545701.2010.541858.
Drydakis, N. (2009), “Sexual orientation discrimination in the labour market”, Labour Economics, Vol. 16/4, pp. 364-372, https://doi.org/10.1016/j.labeco.2008.12.003.
European Union Agency for Fundamental Rights (2014), EU LGBT survey – European Union lesbian, gay, bisexual and transgender survey – Main results | European Union Agency for Fundamental Rights, https://fra.europa.eu/en/publication/2014/eu-lgbt-survey-european-union-lesbian-gay-bisexual-and-transgender-survey-main (accessed on 5 February 2019).
Flores, A. (2015), “Attitudes toward transgender rights: Perceived knowledge and secondary interpersonal contact”, Politics, Groups, and Identities, Vol. 3/3, pp. 398-416, https://doi.org/10.1080/21565503.2015.1050414.
Flores, A. and S. Barclay (2016), “Backlash, Consensus, Legitimacy, or Polarization”, Political Research Quarterly, Vol. 69/1, pp. 43-56, https://doi.org/10.1177/1065912915621175.
GLSEN (2018), 2017 National School Climate Survey, www.glsen.org/article/2017-national-school-climate-survey-1 (accessed on 5 February 2019).
Government Equalities Office (2018), National LGBT Survey, www.gov.uk/government/consultations/national-lgbt-survey (accessed on 6 February 2019).
Greaves, L. et al. (2017), “The Diversity and Prevalence of Sexual Orientation Self-Labels in a New Zealand National Sample”, Archives of Sexual Behavior, Vol. 46/5, pp. 1325-1336, https://doi.org/10.1007/s10508-016-0857-5.
Gulløy, E. and T. Normann (2010), Sexual identity and living conditions. Evaluation of the relevance of living conditions and data collection, Statistics Norway, www.ssb.no/a/english/publikasjoner/pdf/rapp_201038_en/rapp_201038_en.pdf (accessed on 6 February 2019).
Hammarstedt, M., A. Ahmed and L. Andersson (2015), “Sexual Prejudice and Labor Market Outcomes for Gays and Lesbians: Evidence from Sweden”, Feminist Economics, Vol. 21/1, pp. 90-109, https://doi.org/10.1080/13545701.2014.937727.
Hooghe, M. and C. Meeusen (2013), “Is Same-Sex Marriage Legislation Related to Attitudes Toward Homosexuality?”, Sexuality Research and Social Policy, Vol. 10/4, pp. 258-268, https://doi.org/10.1007/s13178-013-0125-6.
IGLYO (2018), Inclusive Education Report, www.education-index.org/wp-content/uploads/2018/01/LGBTQI-Inclusive-Education-Report-Preview.pdf (accessed on 6 February 2019).
ILGA (2017), State-Sponsored Homophobia, http://[email protected] (accessed on 6 February 2019).
Jones, D. (1996), “Discrimination Against Same-Sex Couples in Hotel Reservation Policies”, Journal of Homosexuality, Vol. 31/1-2, pp. 153-159, https://doi.org/10.1300/j082v31n01_09.
Jones, T. et al. (2016), Intersex: Stories and Statistics from Australia, Open Book Publishers, https://doi.org/10.11647/obp.0089.
Kahneman, D. (2013), Thinking, Fast and Slow, Farrar, Straus and Giroux.
Kite, M. and B. Whitley (1996), “Sex Differences in Attitudes Toward Homosexual Persons, Behaviors, and Civil Rights A Meta-Analysis”, Personality and Social Psychology Bulletin, Vol. 22/4, pp. 336-353, https://doi.org/10.1177/0146167296224002.
Koehler, D., G. Harley and N. Menzies (2018), Discrimination against Sexual Minorities in Education and Housing: Evidence from Two Field Experiments in Serbia, The World Bank, https://doi.org/10.1596/1813-9450-8504.
Kreitzer, R., A. Hamilton and C. Tolbert (2014), “Does Policy Adoption Change Opinions on Minority Rights? The Effects of Legalizing Same-Sex Marriage”, Political Research Quarterly, Vol. 67/4, pp. 795-808, https://doi.org/10.1177/1065912914540483.
Kroh, M. et al. (2017), Income, Social Support Networks, Life Satisfaction: Lesbians, Gays, and Bisexuals in Germany, www.diw.de/sixcms/detail.php?id=diw_01.c.592846.de (accessed on 5 February 2019).
Lauster, N. and A. Easterbrook (2011), “No Room for New Families? A Field Experiment Measuring Rental Discrimination against Same-Sex Couples and Single Parents”, Social Problems, Vol. 58/3, pp. 389-409, https://doi.org/10.1525/sp.2011.58.3.389.
Layte, R. et al. (2006), The Irish Study of Sexual Health and Relationships, www.ucd.ie/issda/static/documentation/esri/isshr-report.pdf (accessed on 6 February 2019).
Make the Road New York (2010), Transgender Need Not Apply: A Report on Gender Identity Job Discrimination, www.maketheroadny.org/pix_reports/TransNeedNotApplyReport_05.10.pdf (accessed on 5 February 2019).
McCabe, S. et al. (2017), “Sexual Orientation Discrimination and Tobacco Use Disparities in the United States”, Nicotine & Tobacco Research, https://doi.org/10.1093/ntr/ntx283.
Meyer, I. (2003), “Prejudice, social stress, and mental health in lesbian, gay, and bisexual populations: Conceptual issues and research evidence.”, Psychological Bulletin, Vol. 129/5, pp. 674-697, https://doi.org/10.1037/0033-2909.129.5.674.
Norton, A. and G. Herek (2013), “Heterosexuals’ Attitudes Toward Transgender People: Findings from a National Probability Sample of U.S. Adults”, Sex Roles, Vol. 68/11-12, pp. 738-753, https://doi.org/10.1007/s11199-011-0110-6.
Office for National Statistics (2018), 2017 Census Test Report, www.ons.gov.uk/census/censustransformation programme/2017censustest/2017censustestreport (accessed on 6 February 2019).
Ohlander, J., J. Batalova and J. Treas (2005), “Explaining educational influences on attitudes toward homosexual relations”, Social Science Research, Vol. 34/4, pp. 781-799, https://doi.org/10.1016/j.ssresearch.2004.12.004.
Pathela, P. et al. (2006), “Discordance between Sexual Behavior and Self-Reported Sexual Identity: A Population-Based Survey of New York City Men”, Annals of Internal Medicine, Vol. 145/6, pp. 416-425, https://doi.org/10.7326/0003-4819-145-6-200609190-00005.
Patterson, J. and J. Jabson (2018), “Sexual orientation measurement and chronic disease disparities: National Health and Nutrition Examination Survey, 2009-2014”, Annals of Epidemiology, Vol. 28/2, pp. 72-85, https://doi.org/10.1016/j.annepidem.2017.12.001.
Pearson, J. and L. Wilkinson (2017), “Same-Sex Sexuality and Educational Attainment: The Pathway to College”, Journal of Homosexuality, Vol. 64/4, pp. 538-576, https://doi.org/10.1080/00918369.2016.1194114.
Perales, F. (2016), “The Costs of Being “Different”: Sexual Identity and Subjective Wellbeing over the Life Course”, Social Indicators Research, Vol. 127/2, pp. 827-849, https://doi.org/10.1007/s11205-015-0974-x.
Perales, F. and A. Todd (2018), “Structural stigma and the health and wellbeing of Australian LGB populations: Exploiting geographic variation in the results of the 2017 same-sex marriage plebiscite”, Social Science & Medicine, Vol. 208, pp. 190-199, https://doi.org/10.1016/j.socscimed.2018.05.015.
Petit, P. (2007), “The effects of age and family constraints on gender hiring discrimination: A field experiment in the French financial sector”, Labour Economics, Vol. 14/3, pp. 371-391, https://doi.org/10.1016/j.labeco.2006.01.006.
Pew Research Center (2013), A Survey of LGBT Americans, www.pewsocialtrends.org/2013/06/13/a-survey-of-lgbt-americans/ (accessed on 5 February 2019).
Pope, D., J. Price and J. Wolfers (2018), “Awareness Reduces Racial Bias”, Management Science, Vol. 64/11, pp. 4988-4995, https://doi.org/10.1287/mnsc.2017.2901.
Powdthavee, N. and M. Wooden (2015), “Life satisfaction and sexual minorities: Evidence from Australia and the United Kingdom”, Journal of Economic Behavior & Organization, Vol. 116, pp. 107-126, https://doi.org/10.1016/j.jebo.2015.04.012.
Price, J. and J. Wolfers (2010), “Racial Discrimination Among NBA Referees”, The Quarterly Journal of Economics, Vol. 125/4, pp. 1859-1887, https://doi.org/10.1162/qjec.2010.125.4.1859.
Public Health Agency of Sweden (2014), Utvecklingen av hälsan och hälsans bestämningsfaktorer bland homo- och bisexuella personer. Resultat från nationella folkhälsoenkäten Hälsa på lika villkor., www.bufdir.no/bibliotek/Dokumentside/?docId=BUF00002262 (accessed on 6 February 2019).
Raifman, J. et al. (2017), “Difference-in-Differences Analysis of the Association Between State Same-Sex Marriage Policies and Adolescent Suicide Attempts”, JAMA Pediatrics, Vol. 171/4, pp. 350-356, https://doi.org/10.1001/jamapediatrics.2016.4529.
Rault, W. (2016), “Les mobilités sociales et géographiques des gays et des lesbiennes”, Sociologie N° 4, vol. 7, pp. 337-360, https://journals.openedition.org/sociologie/2894#quotation (accessed on 5 February 2019).
Richters, J. et al. (2014), “Sexual identity, sexual attraction and sexual experience: The Second Australian Study of Health and Relationships”, Sexual Health, Vol. 11/5, pp. 451-460, https://doi.org/10.1071/sh14117.
Rule, N. and N. Ambady (2008), “Brief exposures: Male sexual orientation is accurately perceived at 50ms”, Journal of Experimental Social Psychology, Vol. 44/4, pp. 1100-1105, https://doi.org/10.1016/j.jesp.2007.12.001.
Sabin, J., R. Riskind and B. Nosek (2015), “Health Care Providers’ Implicit and Explicit Attitudes Toward Lesbian Women and Gay Men”, American Journal of Public Health, Vol. 105/9, pp. 1831-1841, https://doi.org/10.2105/ajph.2015.302631.
SAMHDA (2016), Sexual Orientation and Estimates of Adult Substance Use and Mental Health: Results from the 2015 National Survey on Drug Use and Health, www.samhsa.gov/data/report/sexual-orientation-and-estimates-adult-substance-use-and-mental-health-results-2015-national (accessed on 6 February 2019).
Saxena, A. et al. (2018), “LGB Health Disparities: Examining the Status of Ideal Cardiovascular Health From the 2011-2012 NHANES Survey | Circulation”, Circulation, Vol. 137/AP001, www.ahajournals.org/doi/abs/10.1161/circ.137.suppl_1.p001 (accessed on 5 February 2019).
Scott, J. (ed.) (2011), “Long-Term Follow-Up of Transsexual Persons Undergoing Sex Reassignment Surgery: Cohort Study in Sweden”, PLoS ONE, Vol. 6/2, p. e16885, https://doi.org/10.1371/journal.pone.0016885.
Smith, T., J. Son and J. Kim (2014), Public Attitudes toward Homosexuality and Gay Rights across Time and Countries – Williams InstituteWilliams Institute, Williams Institute, https://williamsinstitute.law.ucla.edu/research/international/public-attitudes-nov-2014/ (accessed on 5 February 2019).
Takács, J., I. Szalma and T. Bartus (2016), “Social Attitudes Toward Adoption by Same-Sex Couples in Europe”, Archives of Sexual Behavior, Vol. 45/7, pp. 1787-1798, https://doi.org/10.1007/s10508-016-0691-9.
Tankard, M. and E. Paluck (2017), “The Effect of a Supreme Court Decision Regarding Gay Marriage on Social Norms and Personal Attitudes”, Psychological Science, Vol. 28/9, pp. 1334-1344, https://doi.org/10.1177/0956797617709594.
Tilcsik, A. (2011), “Pride and Prejudice: Employment Discrimination against Openly Gay Men in the United States”, American Journal of Sociology, Vol. 117/2, pp. 586-626, https://doi.org/10.1086/661653.
U.S. Department of Housing and Urban Development (2013), An Estimate of Housing Discrimination Against Same-Sex Couples | HUD USER, www.huduser.gov/portal/publications/fairhsg/discrim_samesex.html (accessed on 5 February 2019).
UNESCO (2016), Out in the Open: Education Sector Responses to Violence Based on Sexual Orientation and Gender Identity/expression., https://unesdoc.unesco.org/ark:/48223/pf0000244756 (accessed on 5 February 2019).
Valfort, M. (2017), LGBTI in OECD Countries: A Review, OECD Publishing, Paris, https://dx.doi.org/10.1787/d5d49711-en.
van Lisdonk, J. (2014), Living with intersex / DSD – An exploratory study of the social situation of persons with intersex/DSD, The Netherlands Institute for Social Research, www.scp.nl/english/Publications/Publications_by_year/Publications_2014/Living_with_intersex_DSD (accessed on 5 February 2019).
Walters, A. and M. Curran (1996), “Excuse Me, Sir? May I Help You and Your Boyfriend?”, Journal of Homosexuality, Vol. 31/1-2, pp. 135-152, https://doi.org/10.1300/j082v31n01_08.
Weichselbaumer, D. (2014), “Testing for Discrimination against Lesbians of Different Marital Status: A Field Experiment”, Industrial Relations: A Journal of Economy and Society, Vol. 54/1, pp. 131-161, https://doi.org/10.1111/irel.12079.
Williams Institute (2014), Best Practices for Asking Questions to Identify Transgender and Other Gender Minority Respondents on Population-Based Surveys, https://williamsinstitute.law.ucla.edu/research/census-lgbt-demographics-studies/geniuss-report-sept-2014/ (accessed on 5 February 2019).
Williams Institute (2009), Best Practices for Asking Questions about Sexual Orientation on Surveys, https://williamsinstitute.law.ucla.edu/research/census-lgbt-demographics-studies/best-practices-for-asking-questions-about-sexual-orientation-on-surveys/ (accessed on 5 February 2019).
Notes
← 1. In Hungary, the Constitution prohibits same-sex marriage since 2012. In the Slovak Republic, the Parliament approved a constitutional amendment banning same-sex marriage in June 2014. In the United States, according to a draft memo leaked to The New York Times, the Department of Health and Human Services proposes to establish a legal definition of whether someone is male or female based solely and immutably on the genitals they are born with.
← 2. Estimates from Project SEXUS that was launched in 2017 in Denmark have not been released yet.
← 3. The Czech Republic, Greece and Italy are the only three OECD countries characterised by a decrease in acceptance of homosexuality. However, this pattern is likely a statistical artefact. These three countries have hosted only one survey during the 2001-2014 period, while more than two have been conducted on average in the other OECD countries. Consequently, estimates for the 2001-2014 period are based on a much lower average number of observations (N=1,444 for the Czech Republic, Greece and Italy as opposed to N=3,044 in the other OECD countries).
← 4. This result holds even when the effect of differences in the number of children across same-sex and opposite-sex couples is neutralized.
← 5. These correspondence studies test for wage discrimination by having actors inquire about the monthly wage offer, whenever recruiters call fictitious candidates back to invite them to a job interview. Although this experimental set-up is informative about differences in wages offered by the recruiter before the job interview, it remains silent about a potential wage discrimination againsthomosexual applicants at the hiring stage, as well as during their stay in the firm.