
copy the linklink copied!1. Overview
This chapter presents the main results of the analysis of the taxation of labour income across OECD member countries in 2019. Most emphasis is given to the tax wedge – a measure of the difference between labour costs to the employer and the corresponding net take-home pay of the employee – which is calculated by expressing the sum of personal income tax, employee plus employer social security contributions together with any payroll tax, minus benefits as a percentage of labour costs. The calculations also focus on the net personal average tax rate. This is the term used when the personal income tax and employee social security contributions net of cash benefits are expressed as a percentage of gross wage earnings. The analysis focuses on the single worker, with no children, at average earnings and makes a comparison with the single earner married couple with two children, at the same income level. A complementary analysis focuses on the two earner couple with two children, where one spouse earns the average wage and the other 67% of it.
This Report provides unique information for each of the 36 OECD countries on the income taxes paid by workers, their social security contributions, the transfers they receive in the form of cash benefits, as well as the social security contributions and payroll taxes paid by their employers. Results reported include the marginal and average tax burden for one- and two-earner households1, and the implied total labour costs for employers. These data are widely used in academic research and in the formulation and evaluation of social and economic policies. The taxpayer-specific detail in this Report complements the information provided annually in Revenue Statistics, a publication providing internationally comparative data on tax levels and tax structures in OECD countries. The methodology followed in this Report is described briefly in the introduction section below and in more detail in the Annex.
The tables and charts present estimates of tax burdens and of the tax ‘wedge’ between labour costs and net take-home pay for eight illustrative household types on comparable levels of income. The key results for 2019 are summarised in the second section below. Part I of the Report presents more detailed results for 2019, together with comparable results for 2018 and discusses the changes between the two years. Part I of the Report also reviews historical changes in tax burdens between 2000 and 2019.
The present chapter 1 begins with an introduction to the Taxing Wages methodology that is followed by a review of the results of tax burden indicators for 2019. The review includes the tax wedge and the personal average tax rates results for a single worker, without children, earning the average wage, and also the corresponding indicators for a one-earner couple at the average wage level and a two-earner couple where one spouse earns the average wage and the other 67% of it, and assumes that both couples have two children. Finally, the chapter ends with a section on the change in the average wage levels by country and the industry classification on which they are based.
copy the linklink copied!Introduction
This section briefly introduces the methodology employed for Taxing Wages, which focuses on full-time employees. It is assumed that their annual income from employment is equal to a given percentage of the average full-time adult gross wage earnings for each OECD economy, referred to as the average wage (AW). This covers both manual and non-manual workers for either industry sectors C-K inclusive with reference to the International Standard Industrial Classification of All Economic Activities, Revision 3 (ISIC Rev.3) or industry sectors B-N inclusive with reference to the International Standard Industrial Classification of All Economic Activities, Revision 4 (ISIC Rev.4).2 Further details are provided in Table 1.8 as well as in the Annex of this Report. Additional assumptions are made about the personal circumstances of these wage earners in order to determine their tax/benefit position.
In Taxing Wages, the term tax includes the personal income tax, social security contributions and payroll taxes (which are aggregated with employer social contributions in the calculation of tax rates) payable on gross wage earnings. Consequently, any income tax that might be due on non-wage income and other kinds of taxes – e.g. corporate income tax, net wealth tax and consumption taxes – is not taken into account. The transfers included are those paid by general government as cash benefits, usually in respect of dependent children.
For most OECD countries, the tax year is equivalent to the calendar year, the exceptions being Australia, New Zealand and the United Kingdom. In the case of New Zealand and the United Kingdom, where the tax year starts in April, the calculations apply a ‘forward-looking’ approach. This implies that, for example, the tax rates reported for 2019 are those for the tax year 2019-2020. However, in Australia, where the tax year starts in July, it has been decided to take a ‘backward looking’ approach in order to present more reliable results. So, for example, the year 2019 in respect of Australia has been defined to mean its tax year 2018-2019.
Taxing Wages presents several measures of taxation on labour. Most emphasis is given to the tax wedge – a measure of the difference between labour costs to the employer and the corresponding net take-home pay of the employee – which is calculated by expressing the sum of personal income tax, employee plus employer social security contributions together with any payroll tax, minus benefits as a percentage of labour costs. Employer social security contributions and – in some countries – payroll taxes are added to gross wage earnings of employees in order to determine a measure of total labour costs. The average tax wedge measures identify that part of total labour costs which is taken in tax and social security contributions net of cash benefits. In contrast, the marginal tax wedge measures identify that part of an increase of total labour costs that is paid in taxes and social security contributions less cash benefits. However, it should be notified that this measure only includes payments that are classified as taxes. Employees and employers may also have to make non-tax compulsory payments (NTCPs)3 that may increase the indicators that are presented in the Taxing Wages publication. An accompanying paper to Taxing Wages that is available on the OECD Tax Database presents “compulsory payment indicators” that combine the burden of taxes and NTCPs: http://www.oecd.org/tax/tax-policy/non-tax-compulsory-payments.pdf.
The calculations also focus on the personal average tax rate and the net personal average tax rate. The personal average tax rate is the term used when the personal income tax and employee social security contributions are expressed as a percentage of gross wage earnings. The net personal average tax rate corresponds to the above measure net of cash benefits. The net personal marginal tax rate shows that part of an increase of gross wage earnings that is paid in personal income tax and employee social security contributions net of cash benefits.
copy the linklink copied!Review of results for 2019
Tax Wedge
Table 1.1 shows that the tax wedge between the labour costs to the employer and the corresponding net take-home pay for single workers without children, at average earnings levels, varied widely across OECD countries in 2019 (see column 1). While in Austria, Belgium, France, Germany, Hungary and Italy, the tax wedge was about 45% or more, it was lower than 20% in Chile and New Zealand. The highest tax wedge is observed in Belgium (52.2%) and the lowest in Chile (7.0%). Table 1.1 shows that the average tax wedge in OECD countries was 36.0% in 2019.
The changes in tax wedge between 2018 and 2019 for the average worker without children are described in column 2 of Table 1.1. The OECD average decreased by 0.11 percentage points. Among the OECD member countries, the tax wedge increased in 19 countries and fell in 17. Most of the increases and decreases were comparatively small: a decrease of more than one percentage point was observed only in Lithuania (3.43 percentage points); and only Estonia saw an increase exceeding one percentage point (1.08 percentage points).
In general, the rises in tax wedge rates were driven by higher income taxes (see column 3). This was the major factor for the majority of countries showing an overall increase, the exceptions being Japan and Korea. Among the group of countries with higher tax wedges in 2019, the largest increase in personal income taxes as a percentage of labour costs was in Estonia (1.08 percentage points), as the income related basic tax allowance decreased while gross wage earnings increased between 2018 and 2019. In Japan and Korea, the personal income tax and the total social security contributions as a percentage of labour costs increased evenly.
Decreases in the tax wedge were also derived for the most part from lower income taxes in nine OECD countries (Australia, Belgium, Latvia, the Netherlands, Norway, Poland, Sweden, Turkey and the United Kingdom). In seven other OECD countries with decreasing tax wedges (Canada, Finland, France, Germany, Greece, Hungary and Lithuania), the changes were mostly driven by lower social security contributions. Employer social security contributions as a percentage of labour costs decreased in Canada (0.53 percentage points), Finland (0.62 percentage points), Hungary (0.69 percentage points) and Lithuania (22.02 percentage points). In Lithuania, a reform of labour taxation was introduced in 2019, which involved a major reduction in employer social security contributions, with most of this reduction being replaced with an increase in employee social security contributions and a corresponding increase in gross wages. The total employer’s social security contribution rate, including the payroll tax rate, declined from 31.2% in 2018 to 1.79% in 2019 while the total employee‘s social security contribution rate increased from 9% to 19.5%. In addition, an income ceiling of around 9.5 times the average wage was also introduced for employee and employer social security contributions. To offset the increase in employee social security contributions the reform also required employers to increase gross wages by 28.9%. In France and Germany the employee social security contributions as a percentage of labour costs decreased by 0.45 and 0.52 percentage points respectively. In Greece, the decreases in the employee and the employer social security contributions (by 0.19 percentage points in total) more than offset the increase in the income tax (0.08 percentage points). For Iceland, the decrease in the tax wedge resulted from a decline of almost the same magnitude in the income tax (0.09 percentage points) and in employers’ social security contributions (0.13 percentage points).
Table 1.2 and Figure 1.1 show the constituent components of the tax wedge in 2019, i.e. income tax, employee and employer social security contributions (including payroll taxes where applicable), as a percentage of labour costs for the average worker without children. The labour costs in Table 1.2 are expressed in US dollars with equivalent purchasing power.
The percentage of labour costs paid in income tax varies considerably across OECD countries. The lowest figures are in Chile (0.05%), with Greece, Israel, Japan, Korea, Mexico, Poland and the Slovak Republic also below 10%. The highest values are in Denmark (35.6%), with Australia and Iceland over 20%. The percentage of labour costs paid in employee social security contributions also varies widely, ranging from zero in Australia, Denmark and New Zealand to 19.0% in Slovenia and 19.2% in Lithuania. Employers in France pay 26.6% of labour costs in social security contributions, the highest amongst OECD countries. The corresponding figures are also more than 20% in 8 other countries - Austria, Belgium, the Czech Republic, Estonia, Italy, the Slovak Republic, Spain and Sweden.
As a percentage of labour costs, the total of employee and employer social security contributions exceeds 20% in more than half of the OECD countries. It also represents at least one-third of labour costs in five OECD countries: Austria, the Czech Republic, France, Germany and the Slovak Republic.

Notes: Single individual without children at the income level of the average worker.
Includes payroll taxes where applicable.
Personal average tax rates
The personal average tax rate is defined as income tax plus employee social security contributions as a percentage of gross wage earnings. Table 1.3 and Figure 1.2 show the personal average tax rates in 2019 for a single worker without children at the average earnings level. The average workers’ gross wage earnings figures in Table 1.3 are expressed in terms of US dollars with equivalent purchasing power. Figure 1.2 provides a graphical representation of the personal average tax rate decomposed between income tax and employee social security contributions.
Table 1.3 and Figure 1.2 show that on average, the personal average tax rate for a single worker at average earnings in OECD countries was 25.9% in 2019. Belgium and Germany both had the highest rate at 39.3% of gross earnings; with Denmark and Lithuania being the only other countries with rates of more than 35%. Chile and Mexico had the lowest personal average tax rates at 7.0% and 10.8% of gross average earnings respectively.
The impact of taxes and benefits on a worker’s take-home pay varies greatly among OECD countries. Such wide variations in the size and make-up of tax wedges, in part, reflect differences in:
-
The overall ratio of aggregate tax revenues to Gross Domestic Product; and,
-
The share of personal income tax and social security contributions in national tax mixes.
The mix of income tax and social security contributions paid out of gross wage earnings also varies greatly between countries as illustrated in Figure 1.2.
In 2019, the share of income tax within the personal average tax rate was higher than the share of the employee social security contributions for 24 of the 36 OECD member countries. No employee social security contributions were levied in Australia, Denmark and New Zealand and the rates were 4% or less of gross earnings in Estonia, Iceland, Ireland and Mexico. In contrast, the single worker at the average wage level paid substantially more (i.e., more than six percentage points) in employee social security contributions than in personal income tax in four countries – Chile, Japan, Poland and Slovenia. In Chile, the average worker paid a marginal amount of personal income tax in 2019 (0.05% of gross earnings). In eight countries – Austria, the Czech Republic, Germany, Israel, Korea, Lithuania, the Slovak Republic and Turkey - the shares of personal income tax and employee social security contributions as percentages of gross earnings were very close (i.e., differences of 3 percentage points or less).
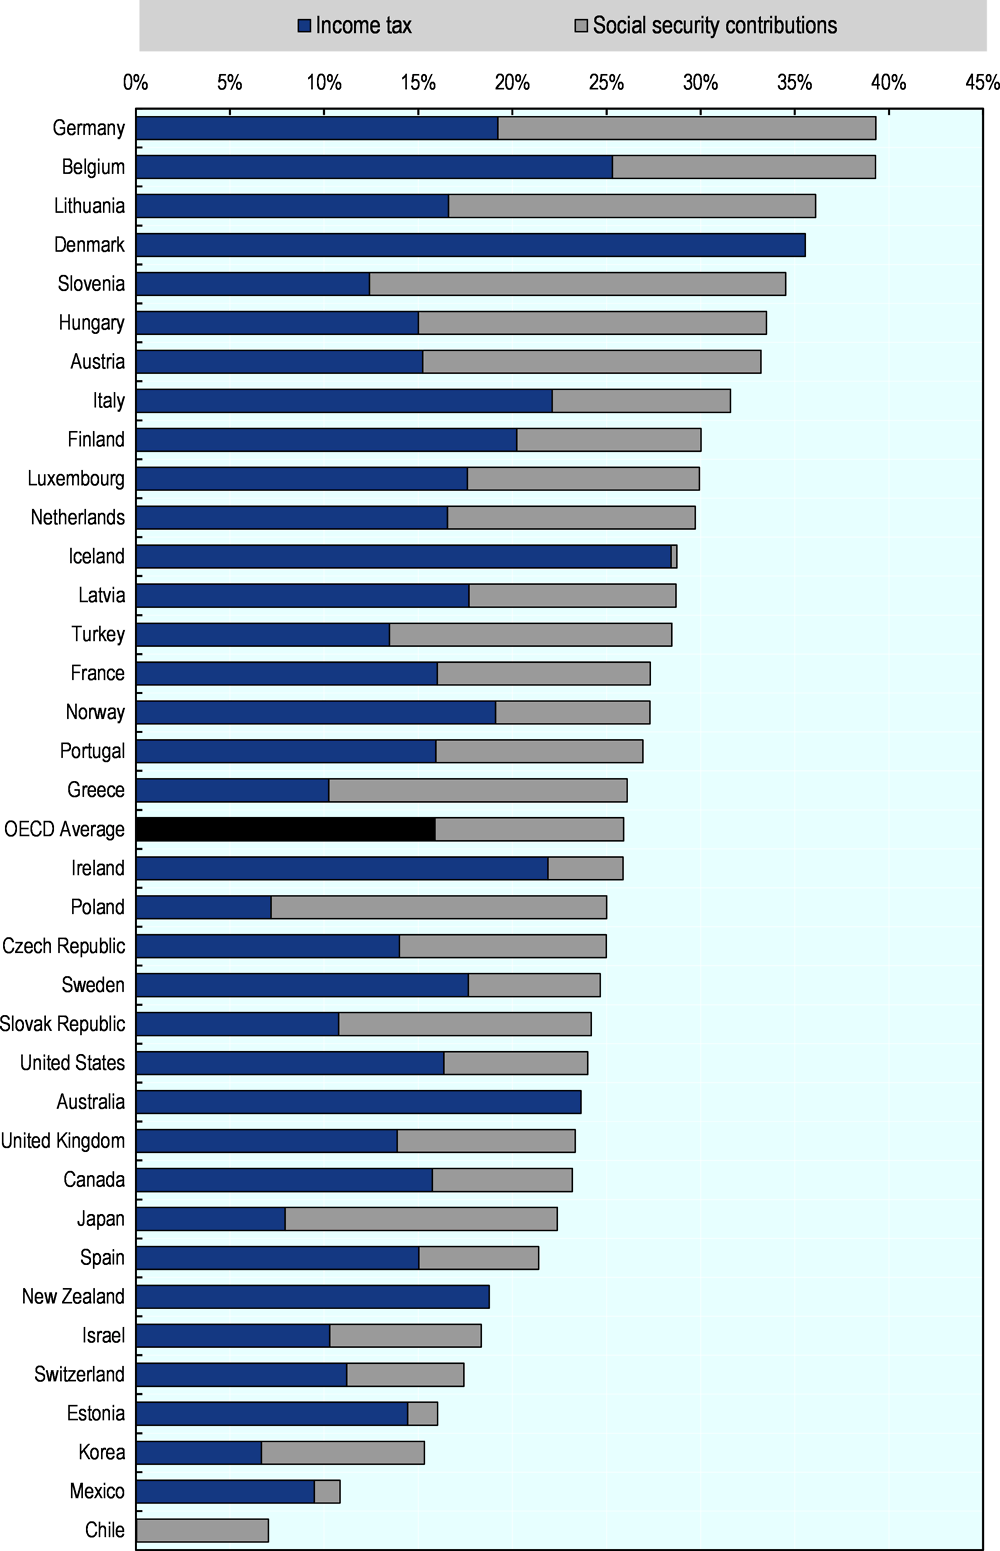
Notes: Countries ranked by decreasing tax burden.
Single workers at the income level of the average worker.
Single versus one-earner couple taxpayers
Table 1.4 compares the tax wedges for a one-earner married couple with two children and a single individual without children, at average earnings levels. These tax wedges varied widely across OECD countries in 2019 (see columns 1 and 2). The size of the tax wedge for the couple with children is generally lower than the one observed for the individual without children, since many OECD countries provide a fiscal benefit to households with children through advantageous tax treatment and/or cash benefits. Hence, the OECD average tax wedge for the one-earner couple with two children was 26.4% compared to 36.0% for the single average worker. This gap has narrowed slightly (by 0.03 percentage points) since 2018.
The tax savings realised by a one-earner married couple with two children compared to a single worker without children were greater than 20% of labour costs in Luxembourg, and 15% of labour costs or more in nine other countries – Belgium, Canada, the Czech Republic, Germany, Hungary, Ireland, New Zealand, Poland and Slovenia. The tax burdens of one-earner married couples and single workers on the average wage were the same in Mexico and differed by three percentage points or less in Chile, Greece, Israel, Korea and Turkey (see columns 1 and 2).
In 27 of the 36 OECD countries, there was only a small change (not exceeding plus or minus one percentage point) in the tax wedge of an average one-earner married couple with two children between 2018 and 2019 (see column 3). There was no change in Chile. There were increases of greater than one percentage point in Slovenia (3.32 percentage points), Poland (2.62 percentage points), New Zealand (1.55 percentage points), Estonia (1.37 percentage points) and the Czech Republic (1.03 percentage points). In contrast, the tax wedge for families fell by more than one percentage point in three countries: Lithuania (4.24 percentage points), Austria (3.67 percentage points) and France (2.34 percentage points). For most of those countries, the changes in the tax wedge resulted from the introduction of, or changes in, tax provisions or cash benefits for dependent children. For Lithuania, the decrease in the tax wedge of an average one-earner married couple with two children was mainly driven by reduced employer social security contributions resulting from the reform of labour taxation. By comparison, the decrease in the tax wedge of a single taxpayer without children at the average wage level was also greater than one percentage point in Lithuania. Detailed explanations on the labour taxation reform in Lithuania are given in the section on the tax wedge above and also in the country details in Part II of the report.
A comparison of the changes in tax wedges between 2018 and 2019 for one-earner married couples with two children and single persons without children, at the average wage level, is shown in column 5 of Table 1.4. The fiscal preference for families increased in 13 OECD countries: Austria, Belgium, Canada, Chile, France, Hungary, Iceland, Ireland, Korea, Latvia, Lithuania, Norway and Turkey. Additionally, the effects of changes in the tax system on the tax wedge were of the same magnitude for both household types only in Mexico. In seven countries: Finland, Greece, Japan, Luxembourg, the Netherlands, Sweden and Switzerland, the fiscal preference for families decreased by less than 0.05 percentage points.

Notes: Countries ranked by decreasing rates for single taxpayer without children.
Household types: a single individual without children and earnings at the average wage level and a one earner married couple with two children and earnings at the average wage level.
Figure 1.3 compares the net personal average tax rate for the average worker between a single individual and a one-earner married couple with two children at the same income level. These results show the same pattern as the tax wedge results. This is because employer social security contributions, which are not taken into account in the former but included in the latter, are independent of household type. Due to tax reliefs and cash benefits for families with children, the one-earner married couple’s disposable income was higher than the single individual’s by more than 20% of earnings in five countries – Luxembourg (24.0%), the Czech Republic (23.2%), Canada and Poland (both 20.8%) and Belgium (20.1%). At the lower end of the spectrum, the disposable income of the one-earner married couple was higher than the single individual by less than 10% of earnings in 14 countries – Lithuania (8.4%), Australia (7.6%), Spain and Sweden (both 6.9%), Japan (6.0%), the Netherlands (5.5%), Finland (5.3%), the United Kingdom (5.0%), Norway (4.1%), Greece (3.8%), Korea (3.0%), Israel (2.6%), Turkey (2.0%) and Chile (0.05%). The burden was the same for both household types in Mexico.
Tax on labour income for two-earner couples
The preceding analysis focuses on two households with comparable levels of income: the single worker at 100% of the average wage, and the married couple with one earner at 100% of the average wage, with two children. This section extends the discussion to include a third household type: the two-earner married couple, earning 100% and 67% of the average wage, with two children.
For this household type, the OECD average tax wedge as a percentage of labour costs for the household was 30.5% in 2019 (Figure 1.4 and Table 1.5). Belgium had a tax wedge of 44.5%, which was the highest among the OECD countries. The other countries with tax wedges exceeding 40% were Italy (41.9 %), and Germany (42.5%). At the other extreme, the lowest tax wedge was observed in Chile (6.7%). The other countries with tax wedges of less than 20% were Switzerland (16.1 %), Israel (16.3 %), New Zealand (17.3%) and Mexico (18.6%).
Figure 1.4 shows the average tax wedge and its components as a percentage of labour costs for the two-earner couple for 2019. On average across OECD countries income tax represented 10.7% of the labour costs and the sum of the employees’ and employers’ social security contributions represented 22.1% of this. The OECD tax wedge is net of cash benefits, which represented 2.3% of labour costs in 2019.
The cash benefits that are considered in the Taxing Wages publication are those universally paid to workers in respect of dependent children between the ages of six to eleven inclusive. In-work benefits that are paid to workers regardless of their family situation are also included in the calculations. For the observed two-earner couple, Denmark paid an income-tested cash benefit (the Green Check) that also benefited childless single workers.
Compared to 2018, the OECD average tax wedge of the two-earner couple decreased by 0.27 percentage points in 2019, as indicated in Table 1.5 (column 2), although it increased for 17 out of the 36 OECD countries and decreased in 18 countries. The tax wedge for the two-earner couple remained unchanged for Chile. There were no increases of more than one percentage point. For six of those countries with an overall increase, the changes were less than 0.20 percentage points (Denmark, Israel, Japan, Spain, Switzerland and the United States). In contrast, decreases of more than one percentage point were observed in four countries: Lithuania (5.24 percentage points), Poland (2.11 percentage points), Austria (2.00 percentage points) and Australia (1.11 percentage points). In Australia, both spouses had their income tax liabilities reduced due to the introduction of the Low and Middle Income Tax Offset in 2019. In Austria, the decrease resulted from the introduction of a tax credit for dependent children and in Poland, it is due to an increase in the cash benefit for dependent children. For Lithuania, the decrease in the tax wedge was due to a reform of labour taxation that is described in the section on the tax wedge above.
In most countries with an increasing tax wedge, the change was mainly driven by higher income taxes. They accounted for the whole increase in the tax wedge, before the impact of cash benefits is taken into account, in 14 countries: the Czech Republic, Estonia, Ireland, Israel, Italy, Luxembourg, Mexico, New Zealand, Portugal, the Slovak Republic, Slovenia, Spain, Switzerland and the United States. In contrast, increasing employer social security contributions were the main factor in Japan and Turkey. However, most of those increases in income tax or social security contributions were augmented or alleviated by changes in cash benefits. In Denmark, the decrease in cash benefits as a percentage of labour costs represented the bulk of the increase in the tax wedge.

Note: Two earner married couple, one at 100% and the other at 67% of the average wage, with 2 children. Includes payroll taxes where applicable.
Regarding the net personal average tax rate as a percentage of gross earnings, the OECD average was 19.5% in 2019 for the two-earner couple with two children where one spouse earns the average wage and the other earns 67% of it. Table 1.6 shows the net personal average tax rates for the OECD countries and their components as a percentage of gross earnings. The household gross wage earnings figures in column 5 are expressed in terms of US dollars with equivalent purchasing power. Unlike the results shown in Table 1.3, in Table 1.6 cash benefits are taken into account and reduce the impact of the employees’ income taxes and social security contributions (columns 2 plus 3 minus column 4).
The net personal average tax rate on the two-earner couple varied greatly among OECD countries in 2019, ranging from 6.7% in Chile to 31.1% in Germany. In other terms, the disposable income of the household after tax represented 93.3% of the couple’s gross wage earnings in Chile while it represented 68.9% in Germany. Denmark was the only other country with a net personal average tax rate exceeding 30% (30.7%). At the other extreme, the net personal average tax rate was less than 10% in Mexico (8.5%) and Estonia (7.6%), as well as in Chile.
The Taxing Wages indicators focus on the structure of income tax systems on disposable income. To assess the overall impact of the government sector on people’s welfare other factors such as indirect taxes (e.g. VAT) should also be taken into account, as should other forms of income (e.g. capital income). Non-tax compulsory payments that affect households’ disposable incomes are not included in the calculations presented in the publication, but further analyses on those payments are presented in the online report: http://www.oecd.org/tax/tax-policy/non-tax-compuslory-payments.pdf.
Wages
Table 1.7 shows the gross wage earnings in national currency of the average worker in each OECD member country for 2018 and 2019. The figures for 2019 are estimated by the OECD Secretariat by applying the change in the compensation per employee in the total economy as presented in the OECD Economic Outlook (Volume 2019 issue 2) database to the final average wage values provided by OECD member countries. More information on the values of the average wage and the estimation methodology is included in the Annex of this Report.
The annual change in 2019 – shown in column 3 – varied between 0.4% in Japan and 28.9% in Lithuania. For Lithuania, the average wage estimate for 2019 is calculated on the basis of the percentage increase of 28.9% that was the obligatory coefficient set by law as part of the Lithuanian government’s labour tax reform. This coefficient applied on employee’s gross wage earnings at a national level in order to compensate for the impact of the reform of the taxation of labour income that was introduced in 2019. The reform is detailed in the country chapter for Lithuania (see Part II. Country details, 2019). To a large extent, the changes in wage levels in the other OECD countries reflect the different inflation levels of individual countries – see column 4 of Table 1.7. The annual change in real wage levels (before personal income tax and employee social security contributions) is within the range of -1% to +2% for 23 countries; see column 5 of Table 1.7. Thirteen countries show changes that are outside this range: Lithuania (26.0%), Estonia (6.4%), Latvia and Poland (both 6.2%), Hungary (4.6%), the Slovak Republic (4.2%), the Czech Republic (3.5%), Turkey (3.3%), Slovenia (3.2%), Korea (2.5%), Ireland (2.4%) and Israel and Mexico (both 2.2%). There were no changes below -1%.
In 27 out of the 36 OECD countries, taxpayers had higher real post-tax income in 2019 than in 2018 as real wages before tax increased faster or decreased slower than personal average tax rates; or the personal average tax rates decreased while real wages before tax increased; or real wages before tax increased while the personal average tax rates remained unchanged; or real wages before tax remained unchanged while the personal average tax rates decreased (see column 6).
In contrast, taxpayers had lower real post-tax income in Estonia, Japan, Lithuania, Luxembourg, Mexico, New Zealand and Switzerland:
-
The real wage before tax decreased whereas the personal average tax rate increased in Japan.
-
The personal average tax rate increased faster than the real wage before tax in Estonia, Lithuania, Mexico, New Zealand and Switzerland. In Lithuania, the personal average tax rate increased by 63.0% in 2019 as a result of its reform, which shifted most of the employer social security contributions to the employee (see the previous section on the tax wedge), but employees’ gross wage earnings also increased by 28.9%.
-
The real wage before tax remained unchanged while the personal average tax rate increased in Luxembourg.
Finally, taxpayers had the same real post-tax income in 2019 as in 2018 in Austria and in Canada, where real wages before tax and the personal average tax rates changed by the same magnitude.
When comparing wage levels, it is important to note that the definition of average wage earnings can vary between countries due to data limitations. For instance, some countries do not include the wages earned by supervisory and managerial workers or do not exclude wage earnings from part-time workers (see Table A.4 in the Annex).
Table 1.8 provides more information on whether the average wages for the years 2000 to 2019 are based on industry sectors C-K inclusive with reference to the International Standard Industrial Classification of All Economic Activities, Revision 3 (ISIC Rev.3) or industry sectors B-N inclusive with reference to the International Standard Industrial Classification of All Economic Activities, Revision 4 (ISIC Rev.4).
Most OECD countries have calculated average wage earnings on the basis of sectors B-N in the ISIC Rev. 4 Industry Classification at least since 2008. Some countries have revised the average wage values for prior years as well. Average wage values based on the ISIC Rev. 4 Classification or any variant are available for years back to 2000 for Australia, Canada, the Czech Republic, Estonia, Finland, Greece, Hungary, Iceland, Italy, Japan, Latvia, Lithuania, the Slovak Republic, Slovenia, Spain and Switzerland.
Australia (for all years) and New Zealand (from 2004 onwards) have provided values based on the 2006 ANZSIC industry classification, divisions B to N, which substantially overlaps the ISIC Rev.4, sectors B to N. For New Zealand, the years prior to 2004 continue to be based on sectors C-K in ANZSIC. Turkey has provided values based on the NACE Rev.2 classification sectors B-N from 2007 onwards. Values for the years prior to 2007 are based on the average production worker wage (ISIC rev.3.1, sector D). The average wages are not based on the sectors B-N in the ISIC Rev. 4 Industry Classification for the Netherlands (from 2012 onwards) and Mexico (all years).
Notes
← 1. From the 2020 edition of Taxing Wages, the household types including spouses earning 33% of the average wage will be replaced with household types where both spouses are at the average wage level and where one spouse is at the average wage level and the other at 67% of it.
← 2. Not all national statistical agencies use ISIC Rev.3 or Rev.4 to classify industries. However, the Statistical Classification of Economic Activities in the European Community (NACE Rev.1 or Rev.2), the North American Industry Classification System (US NAICS 2012). The Australian and New Zealand Standard Industrial Classification (ANZSIC 2006) and the Korean Standard Industrial Classification (6th to 9th KISC) include a classification which broadly conforms either with industries C-K in ISIC Rev. 3 or industries B-N in ISIC Rev.4.
← 3. Non-tax compulsory payments are requited and unrequited compulsory payments to privately-managed funds, welfare agencies or social insurance schemes outside general governments and to public enterprises (http://www.oecd.org/tax/tax-policy/tax-database.htm#NTCP).
Metadata, Legal and Rights
https://doi.org/10.1787/047072cd-en
© OECD 2020
The use of this work, whether digital or print, is governed by the Terms and Conditions to be found at http://www.oecd.org/termsandconditions.
