copy the linklink copied!Chapter 1. The education system in Georgia
Georgia has seen tremendous recent improvement in educational participation and outcomes. Nevertheless, educational progress has not been equitable across all population groups and many students in Georgia still struggle to master basic competencies. These issues reflect systemic challenges in modernising the teaching profession, using evidence in policy-making and strengthening school oversight. The country’s evaluation and assessments systems need to be strengthened in order for education outcomes to be improved for all students.
copy the linklink copied!Introduction
Over the past two decades, Georgia has embarked upon significant educational reform. These reforms have included decentralising school governance and introducing new, competence-based curricula and developing a teacher professional development scheme. Efforts such as these have contributed to a significant improvement in key educational indicators, including achieving near universal enrolment in primary education and an increase in student performance on international surveys. Nevertheless, despite these improvements, a large share of Georgian students continue to leave school without mastering basic competencies for life and work. Equity is also a concern, as outcomes between regions and ethnic groups are large and growing.
This report builds upon Georgia’s successes by focusing on what has most strongly contributed to educational progress and makes recommendations about how the progress can not only be continued, but also be made more equitable. In particular, the review makes recommendations about how Georgia’s educational evaluation and assessment systems can be strengthened, which would help align policy reforms, assure educational quality and direct the education sector towards greater excellence and equity.
copy the linklink copied!National context
Economic and political context
Georgia has strengthened democratic governance and reduced corruption
Since its independence in 1991, Georgia has established strong democratic governance (Freedom House, 2018[1]). There are simplified processes to improve transparency across the public sector (World Bank, 2012[2]) and, according to Transparency International, Georgia now has one of the lowest corruption levels in the region (Transparency International, n.d.[3]).
The progress that Georgia has made in reducing corruption is reflected in the education sector. A reform of entry procedures into tertiary education, including the introduction of an examination, was made to directly address historical bribery of university officials (Andguladze and Mindadze, 2018[4]). Considerable attention has also been given to reducing the prevalence of private tutoring, which affects the priorities of upper secondary teachers.
Georgia has experienced fast economic progress, but poverty and inequity remain challenges
Structural reforms to the public sector has opened Georgia to international trade and global financial markets, eased business development, helped improve competitiveness and established a market-oriented economy (Posadas et al., 2018[5]). Between 2005 and 2015, Georgia’s Gross Domestic Product (GDP) grew annually by almost 6%, on average, and productivity—measured by GDP per worker—more than tripled between 1996 and 2016 (Posadas et al., 2018[5]).
Georgia’s economic development enabled it to reduce its poverty rate from 37% in 2000 to 16% in 2017, as measured as the percentage of the population living below the $5.50 / day (USD PPP, 2011) (World Bank, n.d.[6]). Nevertheless, this rate remains higher than in neighbouring Armenia (14%), Turkey (3% in 2015) (World Bank, n.d.[6]) and across OECD countries (11%) (OECD, 2016[7]). Furthermore, economic inequity in Georgia is a significant problem. Georgia’s income inequality, measured with a Gini coefficient of 0.36, is higher than Armenia’s (0.32), Azerbaijan’s (0.16 in 2005) and the OECD average (0.32) (OECD, 2015[8]).
In Georgia, economic development differs strongly according to geography. Remote and mountainous regions having higher rates of poverty than urban areas. In some regions, over half the population live below the poverty line, whereas less than 20% do in Tbilisi (World Bank, 2016[9]). This is particularly problematic in Georgia because nearly half the population lived in rural areas in 2014 (Posadas et al., 2018[5]). Inequities in Georgia extend to educational access and outcomes. Students in rural areas have less access to quality schooling and score lower on international assessments compared to students in Tbilisi and other urban areas. These inequities, and others, are discussed in greater detail later in this chapter.
Employment is concentrated in low-productivity sectors, which negatively impacts young, academically oriented job-seekers
The current employment rate in Georgia (87% in 2016) (Posadas et al., 2018[5]) is higher than the rate across OECD countries (68%) (OECD, 2018[10]). However, the majority of this comparatively large workforce is still concentrated in low-productivity sectors, despite aforementioned efforts to modernise the economy. The agricultural sector, for example, employs nearly half of Georgia’s workforce but only contributes to 7% of the country’s GDP (Posadas et al., 2018[5]).
The employment situation negatively affects young, university educated job-seekers whose academic preparation is not aligned with the overall needs of the job market (there are also concerns about whether the academic preparation itself is effective). Though overall employment rates are high, as mentioned above, nearly 30% of young people in Georgia (15-25 year-olds) were unemployed in 2017 (ILO, 2019[11]), compared to 12% of 15-24 year-olds in OECD countries in 2018 (OECD Data, 2018[12]). Roughly 40% of unemployed Georgians have a tertiary degree (World Bank, 2013[13]), compared to 6% across OECD countries in 2017 (OECD, 2018[14]).
A rapid over expansion of tertiary education and under development of vocational education (both discussed later in this chapter) have contributed to the misalignment between labour market needs and the backgrounds of job-seekers. Data from the 2015 Programme for International Student Assessment (PISA) show that less than 2% of 15-year-olds were enrolled in vocational programmes in Georgia, compared to 14% in OECD countries (OECD, 2016[15]). In response to this situation, the Ministry of Education, Science, Culture and Sport (MoESCS) has aimed to better meet the needs of the market with the skills of graduating students by expanding the coverage of vocational education and training (VET) institutions across the country and put forward communication campaigns to boost VET’s popularity (MoESCS, n.d.[16]). The Ministry aims to increase the percentage of students enrolled in VET by 30% by 2023 (see chapter 2).
In addition to labour market misalignment, the high number of unemployed tertiary graduates reflects a concern that, despite their credentials, tertiary graduates do not possess strong, 21st century skills. These students enter the labour market poorly prepared for vocational or non-vocational jobs. Subsequent chapters discuss how this situation is related to Georgian teachers’ pedagogical practices, which remain traditional and not well suited to helping students develop higher-order competencies.
Social context
Georgia is ethnically and linguistically diverse and minority populations encounter several challenges
Azerbaijanis and Armenians represent 6% and 5% of Georgia’s population, respectively. These populations are concentrated in mountainous, isolated regions (Geostat, 2015[17]), with 80% of Azerbaijanis across the country living in rural areas (World Bank, 2017[18]). Large economic and political inequities can be found across ethnic minority groups, in part because of their limited knowledge of the Georgian language (less than 20% of Azerbaijanis report being proficient in Georgian) (World Bank, 2017[18]). For example, poverty levels are higher among the Azerbaijani community (46%) compared to Georgians (33%). Out of 150 seats in the National Parliament, only three are held by Armenians and two by Azerbaijanis (World Bank, 2017[18]). Educational access and outcomes also vary considerably for ethnic minority communities compared to Georgians. Students from ethnic minority populations enrol in tertiary education at lower rates and perform less well on international assessments than Georgian students. These inequities will be discussed later in this chapter.
The Georgian government has taken measures to reduce inequities between ethnic groups. It has adopted legislation that gives ethnic minority populations the right to equal opportunities and developed initiatives to protect the culture of minority populations (World Bank, 2017[18]). Nevertheless, key bureaucratic processes, such as parts of the teacher certification examinations, are only available in Georgian and exacerbate inequities based on ethnicity or linguistic background (see chapter 3).
The population is shrinking and urbanising, which makes providing education in rural areas increasingly inefficient
Georgia is facing a rapidly shrinking population because of low fertility rates and high rates of outmigration (World Bank, 2017[18]). Between 2000 and 2010, nearly 10% of the population emigrated to another country. This outmigration, however, has not been equally distributed throughout the country. The rate of population decrease in villages is three times larger than in cities (State Commission on Migration Issues, 2017[19]). This trend, combined with internal urban migration, means that 60% of Georgians are expected to live in cities by 2030 (Asian Development Bank, 2016[20]).
A rapidly decreasing, yet increasingly urban, population poses challenges for the education sector. Schools that are intended to serve rural areas find themselves with fewer students (see Structure of schooling in Georgia). However, despite diminishing enrolment in many schools, the government cannot easily remove teachers from these schools for political reasons. These circumstances make school funding inefficient, as sustaining operations in smaller schools prevents more funding from being allocated to larger and growing schools (see discussions about funding later in this chapter and also in chapter 3).
copy the linklink copied!Governance and funding of the education system in Georgia
Governance of the education system
The Unified Strategy establishes the goals of the system, but is not regarded as a common point of reference
The Ministry of Education, Science, Culture and Sport (MoESCS) developed the “Unified Strategy for Education and Science for 2017-2021” to direct the country’s education system to provide high quality education for all (see Box 1.1). The main priorities of the Unified Strategy include incorporating student-oriented teaching strategies, investing in the teaching workforce and creating a safe school environment. An action plan accompanied the Unified Strategy and sets out expected outcomes, responsible entities and the implementation period for each proposed activity (MoESCS, 2017[21]).
In Georgia’s “Unified Strategy for Education and Science for 2017-21”, relevant actions concerning evaluation and assessment and improving education quality include:
-
developing professional standards for teachers and caretakers in early childhood education
-
updating the national curriculum for primary and secondary education
-
improving and diversifying educational resources, including the approval of school textbooks, developing digital resources and providing learning infrastructure
-
modernising teachers’ professional development standards and improving career advancement schemes
-
establishing mechanisms for the selection, training and retention of school leaders
-
establishing effective mechanisms to ensure that national and international assessment results are used as in policy-making (e.g. curriculum development process).
Source: MoESCS (2017[21]), Unified Strategy for Education and Science for 2017-2021.
Despite being the highest-level strategic document of the education sector, the Unified Strategy is not regarded by stakeholders as a definitive point of reference. Many teachers and principals have not seen it or even heard about it. High-level initiatives are frequently introduced, sometimes at odds with the Unified Strategy and often without sufficient documentation, but are considered more important strategically (see chapter 5).
A new initiative, the “New School Model”, seeks to create more modern learning environments and is steering educational reform
In autumn 2018, the Minister of Education, Science, Culture and Sport introduced the “New School Model”. This initiative establishes a vision of schooling that advocates for modern approaches that aim to develop the whole child. For instance, the “New School Model” encourages teachers to use active pedagogical techniques in order to teach students how to think critically, solve problems and be creative.
To achieve this vision, the ministry is identifying individuals with expertise in information and communications technologies, school leadership and the curriculum. These individuals will be sent to schools to coach school staff in adopting practices that are aligned with the model’s vision of schooling. This approach is being piloted in one school in Tbilisi and plans have been made to increase the number of pilot schools to 50 (see chapter 4).
Curriculum reform has focused greatly on developing student competencies and is moving towards stage-based instruction and assessment
In 2005, Georgia introduced the first national curriculum, which established desired learning outcomes and the distribution of instruction hours for all subjects and grades (MoESCS, 2018[22]). Changes implemented in the 2011 and 2018 versions of the curriculum emphasised a more holistic approach to learning, focusing on developing student competences and social and emotional skills rather than on memorising facts (MoES, 2016[23]). In addition, 2018 reforms introduced a stage-based approach, whereby learning outcomes for students are organised around learning stages, rather than grades. While such changes offer teachers greater flexibility to adapt instruction to different levels of student learning, they also raise questions about whether teachers are prepared to use such an advanced curriculum (see chapter 2).
Agencies affiliated to the Ministry provide technical expertise
Several specialised bodies at arm’s length from MoESCS (see Figure 1.1) assist in the implementation of education policy (MoESCS, 2018[22]). Establishing these bodies is a tremendous accomplishment as their independence and technical competence lend credibility to educational reforms and help legitimise the education system in general. These agencies are listed below.
-
The National Assessment and Examinations Centre (NAEC) is responsible for overseeing all centralised assessments and examinations for students, teachers and other public servants. NAEC conducts the Unified Entry Examination (UEE) and was responsible for conducting the Secondary Graduation Examination (SGE) (see chapter 2). In addition, the Centre oversees regular, sample-based student assessments for maths and sciences in grade 9 and a census-based assessment for Georgian as a second language in non-Georgian schools in grade 9 (see chapter 5). Over 200 professionals work in NAEC, including testing experts, subject area specialists and computer scientists.
-
The Education Management Information System (EMIS), established in 2012, is responsible for collecting and managing statistical data from schools. These data include student demographics and attendance, teacher demographics and school finances. EMIS does not hold examinations data, which is held by NAEC. Principals and teachers submit and view information through EMIS’s E-School portal, and communication is facilitated through the E-Flow platform. Analysing data held in EMIS is done by EMIS statisticians who field and fulfil requests from across the country. The volume of requests can be overwhelming and EMIS staff are not always able to accommodate them in a timely manner (see chapter 5). EMIS is also responsible for the provision and management of information and communication technology to schools.
-
The Teacher Professional Development Centre (TPDC), established in 2009, provides professional development to teachers through regional training centres. It also administers the Teacher Pre-service, Professional Development and Career Advancement Scheme, which outlines different professional levels of teachers and what is required for teachers to reach each level (chapter 3). Furthermore, TPDC oversees the development of professional standards for teachers and school leaders. Reports from national stakeholders suggest that training provided by TPDC is insufficient and can be strengthened. In addition, trainings on offer are not necessarily developed based on specific gaps and needs as demonstrated by evidence.
-
The National Centre for Education Quality Enhancement (NCEQE) was originally established to accredit programmes in vocational and higher education institutes. Its responsibilities have expanded and it now oversees school authorisation. The capacity of NCEQE is a concern. School authorisation currently applies only to private schools and plans to authorise and evaluate public schools are limited by NCEQE’s inability to review over 2 000 schools in a limited time.
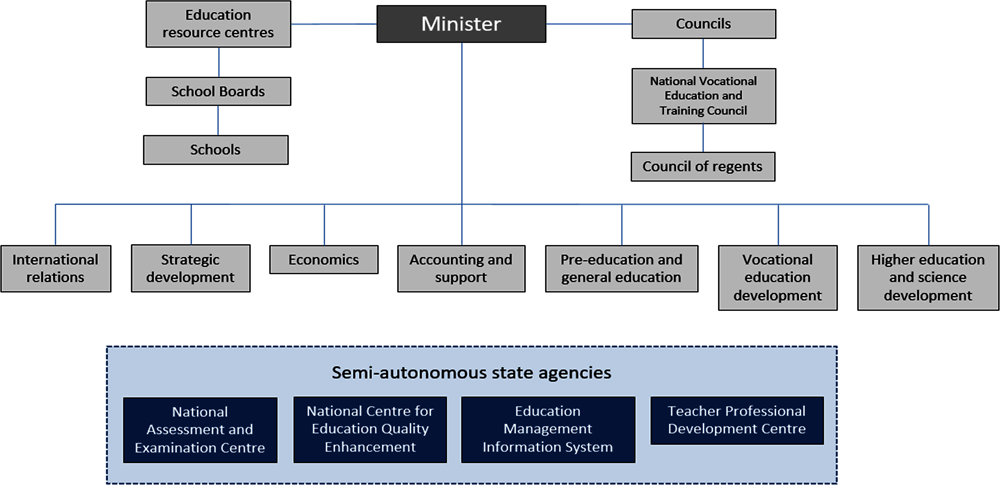
Education management has become increasingly decentralised and local Education Resource Centres help oversee the system
MoESCS establishes the overall strategy of the education system and creating policies that govern its entirety (World Bank, 2014[24]). Key tasks for which it is responsible include developing curriculum, determining school standards, approving textbooks and allocating financial resources. Similar to many OECD countries, Georgia has recently decentralised education management and given schools and local school authorities greater autonomy to respond more directly to stakeholders’ needs (Burns, Köster and Fuster, 2016[25]). In 2005, the Law on General Education was passed, which made local governments responsible for supporting schools in the implementation of their activities, providing social and medical services as well as coordinating transportation to students (Transparency International, n.d.[26]; World Bank, 2014[24]). The following bodies operate at local levels:
-
Education Resource Centres (ERCs): Each municipality has an ERC, staffed by a team of four-five individuals, which is responsible for administering schools and coordinating between them and the ministry. ERCs also visit schools to check that schools are complying with regulations and report the results of their visits to the ministry (MoESCS, 2018[22]).
-
School boards are tasked with the hiring of teachers and principals, agreeing on the school curriculum, approving teaching materials (e.g. textbooks), approving the school budget and deciding how funding is spent (Transparency International, n.d.[26]).
PISA 2015 data confirm that Georgian schools have high levels of autonomy compared to OECD countries. Georgian principals report having considerable responsibility over disciplinary and admission policies. Teachers, on the other hand, have prerogative over assessment practices and course content (OECD, 2016[27]).
Increased decentralisation and autonomy raises questions about the extent of local capacity and the effectiveness of accountability measures
Increased decentralisation has offered local authorities a greater degree of freedom to respond to diverse and local demands. However, it has raised questions regarding school actors’ capacity to be effective in undertaking their new responsibilities. This is compounded by Georgia’s lack of strong accountability mechanisms that ensure quality control and effective steering of decentralised systems. For example, the amount of funding that is disbursed to schools is inconsistent and how it is spent is unclear, but there are few mechanisms in place to ensure that resource allocation and usage are transparent.
Funding of the education system
Overall expenditure on education is low, but returns are promising
Georgia’s expenditure on education is low compared to international benchmarks. Among PISA 2015 participants, Georgia’s cumulative expenditure per student from the age of 6 to 15 (11 704 USD, PPP) is one of the lowest and significantly below those of Bulgaria (29 980) and Turkey (32 752). Spending on education as a percentage of total government expenditure has nearly doubled from under 7% in 2012 to 13% in 2017 (UNESCO-UIS, 2018[28]). Nevertheless, it is still below the United Nations Muscat Agreement target of 15-20% (UNESCO, 2014[29]). This target is relevant for Georgia because it considers the context of economically developing countries, for whom greater investment in education infrastructure is often needed.
While the overall level of expenditure is important, how efficiently and equitably these resources are used also affects outcomes. In PISA 2015, Georgia performed at similar or higher levels than Brazil, Colombia, Mexico, Montenegro and Peru, even though these countries have higher cumulative per student expenditures (Figure 1.2). The Georgian government is currently planning to increase expenditure in the coming years, although how the greater funding will be allocated is still in discussion (MoESCS, 2017[21]). Efficiently and equitably spending the funds will be critical to continuing Georgia’s educational success, and this review discusses in-depth what the trade-offs of various allocation strategies might be.
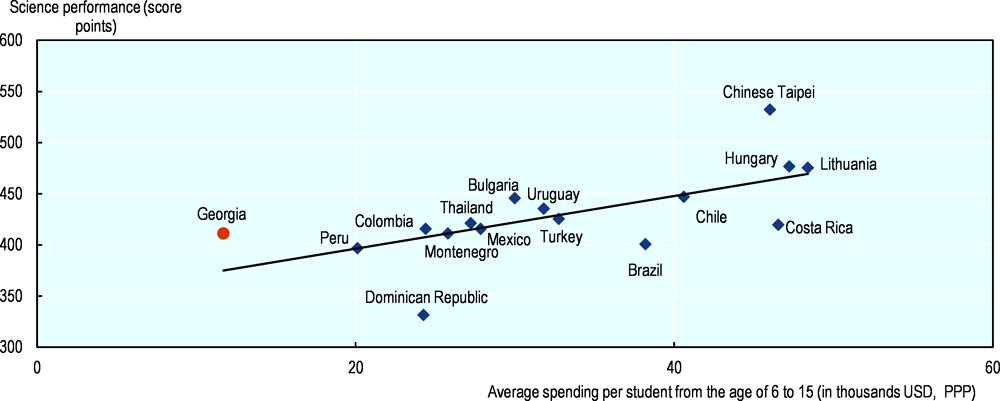
Note: Only countries and economies with available data are shown.
Source: OECD (2016[15]), PISA 2015 Results (Volume I): Excellence and Equity in Education, OECD Publishing, Paris, https://dx.doi.org/10.1787/9789264266490-en.
Higher education receives more per student funding, which poses concerns about equity
In 2012, around 65% of government expenditure in education was allocated to primary and secondary education, 20% to higher education and 15% to pre-primary education (UNESCO-UIS, 2019[30]). In per capita terms, however, spending on higher education is much greater in higher education (World Bank, 2014[31]). Initial government funding (in constant USD, PPP) in higher education was 1 243 per student in 2012, compared to 770 in primary and 667 in lower secondary education (UNESCO-UIS, 2018[32]). Internationally, per capita spending also tends to be greater in higher education (OECD, 2018[14]) and this distribution risks being regressive and further widening social and economic gaps, given that fewer disadvantaged students access higher levels of education. This situation is particularly true in Georgia, where differences in participation and outcomes vary tremendously according to student demographics (see Main trends section).
Vouchers are schools’ main source of funding, though the amount is inadequate to cover costs in most small schools, which receive variable amounts directly from the ministry
Georgia introduced universal voucher funding to schools in 2005 in an effort to enhance transparency in education funding and increase school autonomy (Janashia, 2017[33]). Under this system, parents are free to choose the public or private school they wish their child to attend. As of 2009-10, a voucher of roughly GEL 380 per student (or GEL 505 for rural schools and GEL 635 for schools in mountainous areas) is allocated directly from MoESCS to the school to cover the costs of their attendance. However, at GEL 380, the voucher represents less than 30% of the fee of private schools and parents must supplement the voucher with their own funds (Tabatadze and Gorgadze, 2017[34]). This limitation considerably restricts disadvantaged parents’ ability to enrol their children in a private school.
Vouchers represent schools’ main source of income and are used for current expenses such as teacher salaries and maintenance costs (World Bank, 2014[31]; MoESCS, 2018[22]). Nevertheless, because school sizes vary considerably in Georgia, funding from vouchers alone is not enough to sustain operations at small, rural schools, which do not have enough students to cover their fixed costs. Therefore, schools with fewer than 169 students, which represent over 60% of all schools in Georgia, are allowed to determine and request their own budget amounts directly from MoESCS (Tabatadze and Gorgadze, 2017[34]).
The lack of set procedures to calculate the lump sum amounts that schools request and receive means that there are large disparities in funding among schools of the same size. Research shows that, even between schools with the same number of students, the amount of funding that is requested and awarded varies by as much as 300% (Tabatadze and Gorgadze, 2017[34]). These discrepancies raise concerns about the transparency and oversight of the system.
Most funding is spent on teacher salaries
Around 90% of the funding for primary and secondary education in 2017 was allocated to current expenditures (as opposed to capital investments such as new construction), of which salaries represented around 75% (World Bank, 2014[31]). While this allocation is similar to that across OECD countries (OECD, 2018[14]), a key difference is that, in Georgia, teacher salaries are supporting an ageing teaching workforce whose distribution does not match that of a declining student population (see discussion below). Not only is this allocation of resources somewhat ineffective, as many teachers are struggling to improve because of lack of support, but it also leaves little space for other expenditures that could have a greater impact on educational improvement, such as infrastructure or developing the necessary teacher support systems (World Bank, 2014[31]).
copy the linklink copied!Structure of schooling in Georgia
Compulsory education is expected to expand
Compulsory education in Georgia currently lasts 9 years, covering primary and lower secondary education (early childhood education is not compulsory). This duration is similar to that found in OECD countries, where compulsory primary education is roughly nine years (six years of primary and three years of lower secondary). Some OECD countries have also made participation in upper secondary education compulsory, where students have the choice of undertaking academic or vocational pathways, as well as integrated studies. Recently, MoESCS announced plans to expand compulsory education to ten years in order to strengthen the linkage between general education, VET and tertiary education (discussed further below) (see Table 1.1). It has not been confirmed when this expansion will occur.
Education is offered in Georgian and minority languages, which creates challenges for resource provision and quality assurance
Primary and secondary schools in Georgia offer instruction in Georgian, Azerbaijani, Armenian and Russian, while pre-primary education is offered only in Georgian and Azerbaijani. In most cases, schools instruct only in one of these languages. However, there are 77 Georgian schools in which instruction is delivered in Georgian and a minority language (Livny, Abramishvili and Manukyan, 2017[35]).
Georgia’s efforts to accommodate the needs of linguistic minorities are positive, but require substantial financial and human resources. Textbooks and teacher professional development materials have to be translated into different languages. Moreover, the ministry must hire multi-lingual staff to cover key functions, such as school inspectors and teacher trainers.
Early childhood education
Most Georgian students do not attend early childhood education
Early childhood education is not compulsory in Georgia, which is similar to in other countries in the Caucasus region. Nevertheless, the government wishes to expand early childhood services, in particular for children who are five to six years old, and has enacted policies to achieve this goal. These include abolishing entry fees in 2013, which has helped increase net enrolment rate from 28% in 2001-2002 (World Bank, 2014[24]) to 70% in 2018 (UNICEF, 2018[36]). This figure is slightly lower than those in the neighbouring Russian Federation and Ukraine, which have enrolment rates above 70% (World Bank, 2014[24]).
Access to and the quality of early childhood education can be improved
There is strong evidence that exposing children to stimulating cognitive environments can help establish the foundations for success in school and life (OECD, 2001[37]). Disadvantaged children, who are more likely to face poorer home learning environments, thus stand to gain the most from access to quality early childhood education services.
In Georgia, however, students from disadvantaged backgrounds are less likely than their advantaged peers to attend early childhood education. Only 33% of ethnic minority students and 47% of students living in rural areas enrol in early childhood education, significantly lower than the national average (70%) (UNICEF, 2018[36]). These disparities in access arise from uneven geographical coverage of the pre-primary network, with urban areas being more likely to have pre-primary institutions than rural ones, where more ethnic minority families live. Among the reasons for not enrolling their children in early childhood education services, 67% of Azerbaijani parents and 48% of parents in rural areas mentioned that there were no institutions near their home, compared to only 25% Georgian parents and 2% of parents in urban areas (World Bank, 2014[24]).
There are also concerns regarding the quality of education that is provided through Georgia’s early childhood network. A school readiness study conducted in 2011 observed that only a third of children who attended early childhood education and care had satisfactory levels of cognitive, social and emotional skills. (World Bank, 2014[24]).This can be partly explained by the fact that, prior to 2016, pre-primary institutions only provided childcare services (MoESCS, 2017[21]).
Primary and secondary education
Georgia has a large number of small schools and low student-teacher ratios
As mentioned previously, a shrinking population, especially in rural areas, has resulted in a large number of small schools (65% of all schools enrol less than 25% of the student population) (MoESCS, 2018[22]). Urbanisation, on the other hand, has led to 15% of the country’s schools enrolling roughly half of all students (MoESCS, 2018[22]).
Such disparity in school sizes means that the ratio of students to teachers also varies greatly throughout the country. Although the national ratio (8:1 in 2013-14) is much lower (World Bank, 2014[24]) than across OECD countries (15 in primary and 12 in secondary education, 2016) (OECD, 2018[14]), in rural areas in Georgia, the ratio can be as low as 2:1 and in urban areas as high as 15:1 (World Bank, 2014[38]). Sustaining several small schools raises important efficiency concerns as providing a wide range of learning opportunities for students and hiring high quality staff is more difficult to accomplish under such circumstances (World Bank, 2014[38]).
Most Georgian schools teach students from Grades 1 through 12
Almost three-fourths of Georgian schools (72%) provide comprehensive schooling for all grade levels (MoESCS, 2018[22]), which reflects the fact that many Georgian schools are located in small communities that cannot sustain separate schools for different grade levels. While the country’s context necessitates the high number of such schools, their presence also heightens the need for school-level accountability. Many students will not change schools unless their families move, which means that they will have difficulty finding better educational environments if their current schools are in need of improvement.
Teachers are in oversupply and modernising the profession through the Teacher Professional Development Scheme has resulted in mixed success
While student numbers have declined by around 21% over the past decade, teacher numbers have fallen by less than 1% (World Bank, n.d.[39]). One reason that teacher numbers have not fallen in line with the decline in students is a political decision to keep open many small schools in rural areas. Another reason is that, in the absence of an enforced retirement age for teachers, many teachers in Georgia continue to teach long after they start to receive their pension. Around one in four of Georgia’s teachers are over 60, compared with around one in twenty across TALIS-participating countries (OECD, 2019[40]). The high share of older teachers limits the availability of full-time teaching posts, reducing teachers’ real salaries. It also means that there are fewer teaching posts available for new entrants. Finally, there are concerns that some older teachers are less motivated to engage with professional development or upgrade their skills, making modernising teaching difficult (World Bank, n.d.[39]).
To address these issues, Georgia has implemented successive changes to teacher policy since 2007. These have included increasing the qualification requirements to become a teacher and introducing a merit-based career structure. However, in many cases the impact of these measures has been diminished by subsequent policy reversals and a lack of follow-through. For example, the requirement that new teachers complete a one-year induction has not been implemented. Similarly, the requirement that all teachers reach senior status according to the career scheme by 2014 was never enforced.
At age 15, Georgian students choose between an academic and a vocational track
Following Georgia’s independence from the Soviet Union, the VET system virtually collapsed with many institutions having to close down. Currently, VET and general educational tracks are split and not provided in the same schools (MoESCS, 2018[22]). Across the country, VET is still offered only in 34 public schools – some of which require students to take an admission test due to lack of space – and 90 private institutions in 2016. Collectively, VET institutions enrol less than 2% of upper secondary students in 2017, compared to 14% in Russia and 26% in Turkey (UNESCO-UIS, 2018[41]).
Part of the unpopularity of VET is that completion of the track does not allow students to enter general tertiary education. Since 2005, students in VET no longer receive a secondary education diploma, without which they cannot apply to general higher education institutions. This situation is commonly often referred to as a “dead end” (Livny et al., 2018[42]). Therefore, Georgian students often prefer to follow an academic path in upper secondary education (Livny et al., 2018[42]), which confers greater prestige and is considered more professionally flexible.
Georgia is making efforts to upgrade its VET sector
An aforementioned mismatch between Georgian students’ skills and the needs of the labour market is compelling MoESCS to consider how to expand and strengthen the VET sector. Since 2007, the government has been making important efforts to rebuild the sector by establishing new institutions, particularly in rural areas, developing a comprehensive national qualifications framework and a National VET Council (Livny et al., 2018[42]).
The government is now aiming to increase the number of students by 40 000 by 2023 (MoES, 2018[43]). These efforts will have to be supported by greater expenditure in VET, as current spending has decreased from 4% of total education expenditure in 2007 to 1% in 2012 (World Bank, 2014[24]). From a policy perspective, MoESCS is considering how to better integrate VET education with general education to eliminate the “dead end” currently associated with VET and increase its attractiveness (see chapter 2).
An exit examination at the end of upper secondary school was recently abolished because of the negative backwash effects it created
Until 2019, all students in Grades 11 and 12 took the Secondary Graduation Examination (SGE), which, along with student marks, certified completion of upper secondary school. The examination was introduced in 2011 as part of a government effort to address student absenteeism and improve school accountability. Students in Grade 11 took tests in scientific fields (chemistry, biology, physics and geography) and in Grade 12 they took tests in Georgian or their native language, math, a foreign language and history (MoESCS, 2018[22]). The SGE was administered in a computer adaptive format in which students’ answers on previous questions determined the level of difficulty of the questions they subsequently saw.
Several concerns were raised that the SGE created unintended consequences for students and teachers. For instance, a culture of high-stakes testing encouraged students to prioritise preparing for the SGE over focusing on schoolwork, which sometimes decreased attendance (one of the original goals of the SGE was to increase it). Students would also seek out private tutoring to help them prepare, which exacerbated equity concerns.
From the perspective of teachers, pressure to help students succeed on the SGE made teachers use classroom time for test preparation, even if it meant straying from the curriculum. Furthermore, many teachers, particularly part-time teachers (see chapter 3), would offer private-tutoring services out-of-school in order to augment their incomes. This put them in a situation in which they may have been incentivised to prioritise their tutoring enterprises over their classroom instruction.
In 2019, after internal research by NAEC verified these concerns, MoESCS abolished the SGE. Presently, a student’s marks in upper secondary school is the only criteria used to determine if they graduate. Although some discussion about introducing a new examination system has occurred, no firm plans have been made.
Selection into tertiary education is determined by an entrance examination at the end of upper secondary school, which has also been modified recently to create fewer backwash effects
The Unified Entry Examination (UEE) was introduced in 2005 as an entry exam for upper secondary graduates who wished to enrol in higher education. State grants are also awarded according to students’ performance on the test (MoESCS, 2018[22]). The introduction of the UEE is widely acknowledged for its key role in increasing transparency and addressing the long-standing corruption that defined university admissions in Georgia (Orkodashvili, 2012[44]).
Previously, the UEE required students to take three compulsory subjects–Georgian language, a foreign language and a general ability test–along with an elective subject. In 2019, internal research by NAEC revealed that the UEE was also causing unintended backwash effects. As a result, MoESCS changed the required subjects of the UEE to Georgian language, a foreign language and either mathematics or history, along with an elective subject. Some university programmes may also require additional tests in sciences, history of Georgia, social sciences and literature.
To improve access to higher education, students from linguistic minority schools are required to take only the UEE’s general ability test, which is offered in all minority languages (all other subject tests are only offered in Georgian). Linguistic minority students who pass the general ability test receive one year of training in Georgian language, after which they can proceed to a general four-year undergraduate programme taught in Georgian (with the exception of the Abkhazian region where Abkhazian is the language of instruction) (Government of Georgia, 2004[45]). In addition, MoESCS has introduced quotas for linguistic minorities in higher education institutions.
Tertiary education
Access to higher education has expanded, but there are concerns about the quality of education being provided
Tertiary education in Georgia has undergone a rapid expansion. The gross tertiary enrolment rate increased from 38% in 2000 to 57% in 2017, which is higher than in neighbouring Armenia (52%) and Azerbaijan (27%) (UNESCO-UIS, 2018[46]). Almost 42% of 25-29 year-olds hold a tertiary degree in Georgia, compared to only 27% among those between 60 and 64 years of age (Posadas et al., 2018[5]).
The rate at which Georgia’s tertiary sector has grown has raised questions about the quality of education that is being provided. While higher education spending per student is proportionately greater than primary or secondary education spending, absolute amounts of public funding are still low by international standards (around USD 442 PPP in 2016, compared to over 105 000 USD PPP across OECD countries in 2014) (UNESCO-UIS, n.d.[47]). Given the limited public funding, higher education institutions are financially dependent on student tuition fees, which creates pressure for them to overlook academic readiness and enrol large number of students (Andguladze and Mindadze, 2018[4]). These quality concerns, along with the aforementioned misalignment between the focus of education vis-à-vis the employment landscape of the country, might be contributing to the high degree of unemployment for young, educated Georgians.
Few students from disadvantaged backgrounds and minority groups progress to higher education
Despite efforts to ensure access to all students, enrolment in tertiary education varies considerably across population groups. For example, enrolment from the poorest quintile of students is nearly eight times lower than from the wealthiest quintile. Ethnic Azerbaijanis are three times less likely to enrol in higher than ethnic Georgians (World Bank, 2014[24]). Moreover, evidence indicates the participation rates of these vulnerable groups are stagnant, if not reversing (World Bank, 2014[24]). For example, the net enrolment of students from the poorest quintile declined from 13% in 2009 to 8% in 2012.
Several factors contribute to the disparate enrolment rates. Because higher education is almost entirely financed by student tuition, disadvantaged students are less able to pay the fees necessary to enrol (World Bank, 2014[24]). Perhaps more importantly, the general education that disadvantaged, rural and ethnic minority students receive tends to be of lower quality, which often makes them less qualified to continue into tertiary education. These disparities in outcomes will be examined in detail in the Main trends section.
copy the linklink copied!Main trends in participation, learning and equity in primary and secondary education
Georgia has seen significant improvement in enrolment across all levels of education and in outcomes, as measured by international assessments. Nevertheless, despite this progress, a large share of students still leave the education system without mastering basic skills. Inequities are also large and disparities in access and outcomes can vary considerably across different student populations. Georgia will need to improve its evaluation and assessment systems in order to identify and address weaknesses in student learning and so low outcomes do not become entrenched and disparities are not widened.
Participation
Participation in compulsory education has increased, but many students drop out between lower and upper secondary education
Georgia has achieved near universal participation in primary education, having increased its net enrolment to 98% in 2016 (UNESCO-UIS, 2018[41]). The share of students in secondary education also increased significantly and is comparable to international benchmarks. Participation in lower secondary education increased from 76% in 2007 to 94% in 2016, which is slightly higher than Armenia (89%) and Azerbaijan (90%) (UNESCO-UIS, 2018[41]). Enrolment in upper secondary education increased from 70% in 2007 to 83% in 2016, slightly greater than Armenia (77%), Turkey (78%) and the OECD average (79%) (Figure 1.3) (UNESCO-UIS, 2018[41]).
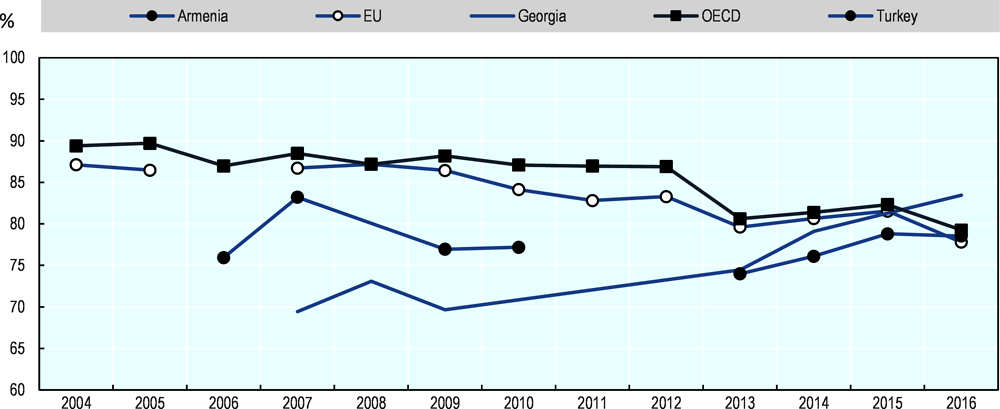
Source: UNESCO-UIS (2018[41]), Education: Net enrolment rate by level of education, http://data.uis.unesco.org/# (accessed on 15 April 2019).
While participation has increased overall, a large number of students drop out of school after grade 9, which is the end of compulsory education. In 2017, while fewer than 500 students dropped out between Grades 7 and 9, over 8 000 did between Grades 10 and 12. This increase was partly a result of a previous policy that whereby principals were evaluated according to their schools’ performance in school-leaving exams, which created an incentive for principals to encourage low-performing students to leave school. Although the number of students who drop out has decreased following elimination of the policy (over 16 000 dropped out between Grades 10 and 12 in 2014), it remains an issue for the country. As vocational education is underdeveloped, students who drop out do not have an opportunity to develop important competencies later and enter the labour market without formal qualifications (Janashia, 2017[33]).
Enrolment in private schools is increasing, though it’s unclear if the education offered by private schools is higher quality
The vast majority of Georgian schools (90%) are public (MoESCS, 2018[22]), though the share of students attending private schools has been rising. In primary education, it increased from 3% in 2005 to 10% in 2015, higher than in neighbouring Armenia (2% in 2017) and Azerbaijan (1% in 2017) (UNESCO-UIS, n.d.[48]). As most Georgian schools offer both primary and secondary education, a similar increase is seen in the share of enrolment in private schools for secondary education.
These increases may be motivated by the perception that private schools provide better education. This perception, however, is not grounded in evidence. While private students’ performance in international assessments, such as TIMSS and PISA, is indeed higher, the difference disappears once socio-economic characteristics are taken into account (Livny, Abramishvili and Manukyan, 2017[35]). This suggests that the higher performance observed in private school students might result from positive self-selection, an interpretation that is supported by PISA data. In 2015, a larger proportion of disadvantaged students (99%) are enrolled in public schools compared to advantaged students (75%) (OECD, 2016[15]).
Learning outcomes and environment
Learning outcomes have improved and are high relative to Georgia’s level of educational expenditure
Georgia does not have a comprehensive, national assessment system. Some students are tested in some subjects in Grades 7 and 9, but there is no continuous, repeated and representative assessment of student learning in all key subjects (see chapter 5). Without valid national measures of student performance, this report looks to international surveys to understand student learning in Georgia.
In PISA, Georgia increased in science performance by 38 score points (equivalent to over one year of schooling) between 2009 and 2015. Similar improvements were observed in reading (27 score points) and mathematics (25 score points). Georgia’s improvement mostly resulted from a reduction in low-performers (students performing below PISA Proficiency Level 2) of nearly 15 percentage points in science, 11 percentage points in reading and 12 percentage points in mathematics (OECD, 2016[15]).
Progress was also observed in Georgia’s performance in TIMSS from 2007 to 2015. In Grade 4, learning outcomes improved by 25 score points in mathematics and 33 score points in science. In Grade 8, there was a 43 score points increase in mathematics and 22 score points increase in science (IEA, 2015[49]).
A third of Georgians still lack basic skills in reading, science and mathematics
Despite these improvements in student learning, overall learning outcomes remain low compared to neighbouring and European countries (OECD, 2016[15]). In PISA 2015, Georgian students scored over 80 score points less than the OECD average in science, equivalent to over two years of schooling. In TIMSS, Georgia ranks among the lowest-performing participating countries in grades 4 and 8 (IEA, 2015[49]).
Georgia’s share of low achievers in science (51%), while decreasing, is still one of the highest among PISA participating economies and is much larger than the OECD average (21%). In addition, less than one percent of students were considered top-performing students, meaning they perform at Level 5 or above. These students can draw on and use information from multiple and indirect sources to solve complex problems, and can integrate knowledge from across different areas. Across OECD countries, 8% of students are considered top-performing (OECD, 2016[15]). These results suggest that, while recent progress has been made, there is considerable room for improvement and that it will be important to make evidence-informed decisions to sustain Georgia’s educational improvements.
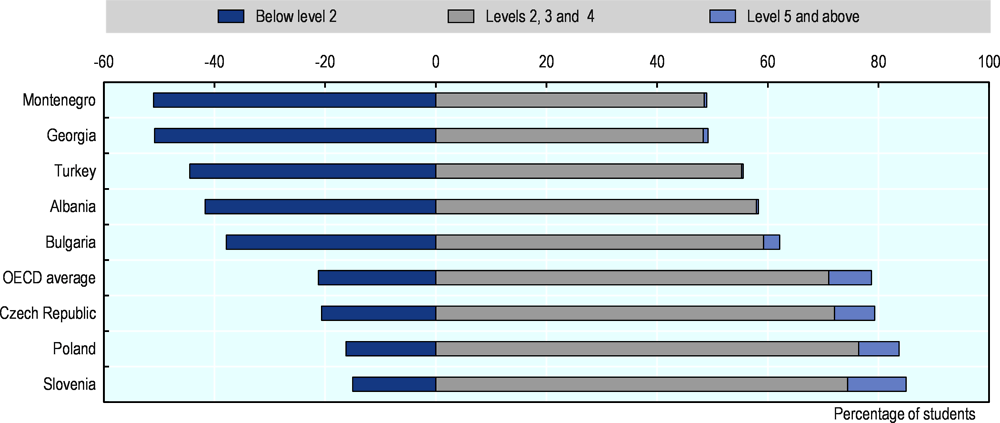
Source: OECD (2016[15]), PISA 2015 Results (Volume I): Excellence and Equity in Education, OECD Publishing, Paris, https://dx.doi.org/10.1787/9789264266490-en.
Georgia benefits from some supportive school environments and teacher practices
Research indicates that a school that provides an orderly, supportive and positive environment is more likely to help students learn (Jennings and Greenber, 2009[50]). Overall, students in Georgia report that behaviour is less likely to hinder learning, that students are less likely to skip classes than students across OECD countries (OECD, 2016[27]). Moreover, Georgian students who reported a better disciplinary climate in their science lessons performed better in science, even after accounting for the socio-economic status of students and schools.
According to PISA 2015 data, 21% of students reported that teachers tell them how to improve their performance at every lesson, compared to 9% across OECD countries. More than half of Georgian students reported that their teacher continues teaching until the students understand, compared to 38% of students in OECD countries. While these country comparisons need to be interpreted with caution owing to social and cultural differences, the findings point to some positive interactions between teachers and students in Georgian schools.
Nevertheless, PISA results, while an important source, only capture data from 15-year-old students. Internal research about teacher practices is not widely available to supplement gaps in understanding. Thus, a non-representative survey was administered to principals and teachers as part of this review and the results will be referenced in this report.
Equity
Enrolment in education is not equitable and more can be done to increase the demand for education from underrepresented populations
Although Georgia has achieved virtually universal access to primary and lower secondary education, data from UNICEF’s global Multiple Indicator Cluster Surveys (MICS) shows that enrolment in primary and secondary education varies considerably across different student population groups. For example, net enrolment in secondary education was 72% for Azerbaijani students, compared to 90% for ethnic Georgians (UNICEF, 2008[51]).
The Ministry has recently introduced various initiatives to address inequitable access to education. In 2013, school textbooks were provided free of charge to all students in public schools and disadvantaged students in private schools. Additionally, MoESCS provides free public transportation to remote schools and has made the SGE free for students to take (Makarova, 2016[52]).
These initiatives, however, are primarily intended to facilitate the provision of education to students who are already enrolled. There are fewer initiatives that target students who were never enrolled in the first place. For instance, there are no conditional cash transfer schemes or other mechanisms to incentivise families to enrol their children who might otherwise be employed in a family business. In short, Georgia has improved access to the supply of education, but not necessarily increased the demand for education among more reluctant populations.
Learning outcomes vary greatly according to several dimensions
PISA results show that students in Georgia demonstrate varying performance according to several demographic dimensions. One of these dimensions is PISA’s index of economic, social and cultural status (ESCS), which estimates students’ socio-economic background based on several variables, including parents’ education, parents’ occupations and household possessions. Students are classified as socio-economically disadvantaged if their ESCS is among the bottom 25% within their country or economy and advantaged if their ESCS is among the top 25%. In 2015, disadvantaged students in Georgia scored 78 points less than advantaged students, an equivalent of roughly 2.5 years of schooling. This gap is smaller than the OECD average (88 score points difference), but larger than in Russia (58 score points difference) and Turkey (59 score points difference) (OECD, 2016[15]).
An important measure of equity of outcomes in PISA is resilience, which is the percentage of disadvantaged students in a country or economy whose performance is in the top quartile of students around the world, after accounting for socio-economic status. Across the OECD, 29% of disadvantaged students are considered resilient, meaning they achieve better performance in their socio-economic status would predict. Russia and Turkey have similar shares at 26% and 22%, respectively. In Georgia, however, only 8% of disadvantaged students perform in the top quartile of science (OECD, 2016[15]), indicating that the most vulnerable students in Georgia find great difficulty in overcoming their circumstances and succeeding academically.
Other dimensions according to which student outcomes in Georgia vary include:
-
Geographic location: Students from rural areas scored 44 score points behind their peers in cities, equivalent to nearly 1.5 years of schooling (see Figure 1.6). This difference can be seen at a regional level, where almost two-thirds of students are above the PISA science baseline in Tbilisi, but only one-third of students are in rural regions (see Figure 1.5).
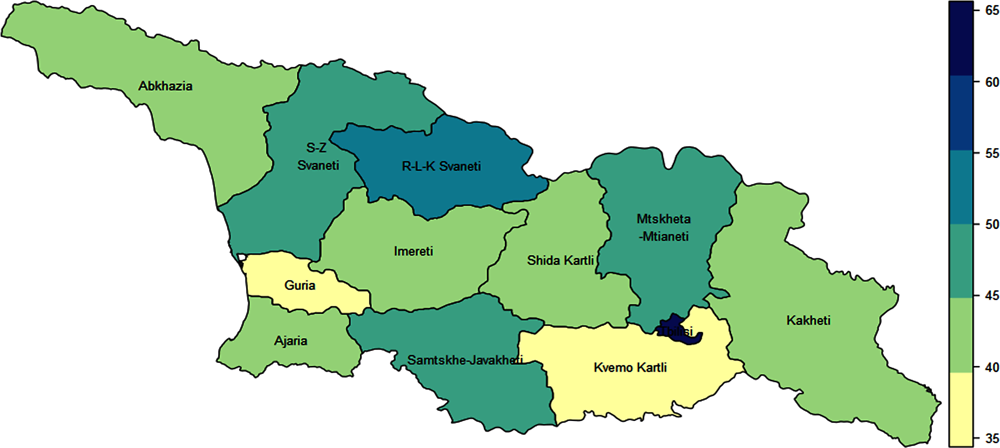
Source: Authors’ calculations based on PISA 2015 sampling data in OECD (2016[15]), PISA 2015 Results (Volume I): Excellence and Equity in Education, OECD Publishing, Paris, https://dx.doi.org/10.1787/9789264266490-en.
-
Mother tongue: Students who speak Georgian at home scored 419 in science, whereas students who do not speak Georgian at home scored 359 (see Figure 1.6) (OECD, 2016[15]). Although roughly half the country’s students were below baseline proficiency, almost 90% of Azerbaijani students were and no Azerbaijani students scored above Proficiency Level 3.
-
Educational track: While virtually all upper secondary students are enrolled in general education, the Georgian government is trying to expand the vocational sector and make it compatible with expectations from higher education institutions. In 2015, however, vocational students performed nearly 90 score points lower than their peers in general education programmes (Figure 1.6). Across OECD countries, the gap is much lower (39 score points) (OECD, 2016[15]).
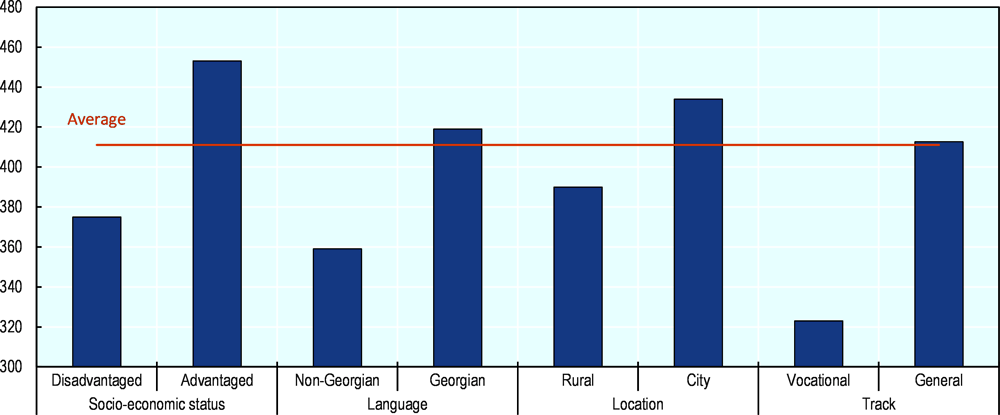
Source: OECD (2016[53]), PISA 2015 Database, www.oecd.org/pisa/data/2015database/ (accessed on 6 June 2019).
Inequity has worsened over time
Gaps in outcomes between students groups in Georgia in PISA 2015 have actually widened compared to the same gaps in PISA 2009. In 2009, students from cities scored 30 score points more than students from rural areas. By 2015, this gap increased to 44 points. The difference in science score between students who speak mainly Georgian at home and those who speak mainly another language at home has also widened from 40 score points to 60 points, equivalent to almost two years of schooling (Figure 1.7).
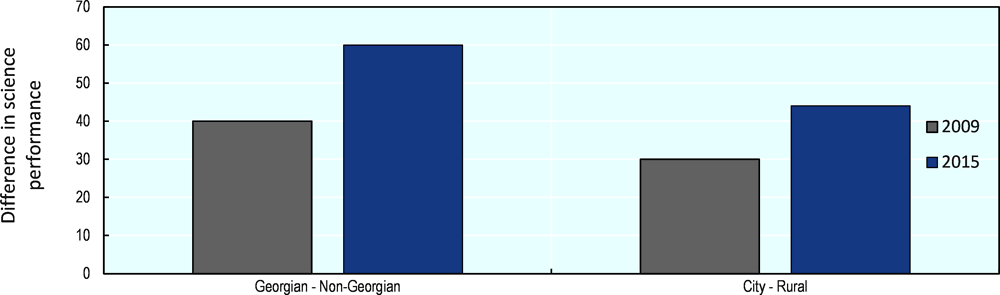
Sources: OECD (2016[53]), PISA 2015 Database, www.oecd.org/pisa/data/2015database/ (accessed on 6 June 2019);
OECD (2010[54]), Data base PISA 2009,www.oecd.org/pisa/data/pisa2009database-downloadabledata.htm (accessed on 6 June 2019).
Worsening educational inequities can be further observed in Georgia at the school-level, where PISA data reveal that the disparity in science performance between Georgian schools has widened considerably. Figure 1.8 shows that, while the highest-performing schools in 2015 exhibit much higher performance than they did in 2009, the lowest-performing schools in 2009 and 2015 have nearly identical levels of performance, (OECD, 2016[15]).
Not only is there greater variation in overall performance between schools, but the variation is more closely correlated with the socio-economic status of the students who attend those schools. According to authors’ analyses of PISA data, in 2009 socio-economic status explained 34% of the variation in performance between schools, whereas in 2015 it explained 51%. Furthermore, in 2009, a one-unit difference in socio-economic status between two schools was associated with around a 52 score point change. In 2015, it was associated with around a 76 score point change.
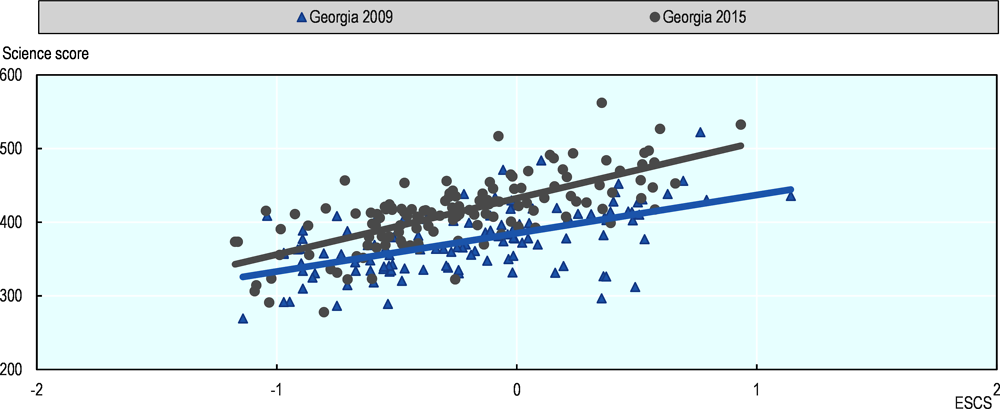
Note: Each marker represents one school that was sampled to participate in PISA.
Sources: OECD (2016[53]), PISA 2015 Database, www.oecd.org/pisa/data/2015database/ (accessed on 6 June 2019);
OECD (2010[54]), PISA 2009 Database, www.oecd.org/pisa/data/pisa2009database-downloadabledata.htm (accessed on 6 June 2019).
These findings again suggest that the education system in Georgia, particularly evaluation and assessment structures, are not identifying the neediest schools and providing those schools with the resources they need to improve. PISA evidence supports this notion. School principals in disadvantaged schools in Georgia are more likely to report that their capacity to provide instruction is hindered by a lack or inadequacy of educational material and physical infrastructure than principals in advantaged schools. This gap between principals from advantaged and disadvantaged schools in Georgia is much larger than across OECD countries (OECD, 2016[27]). Moreover, PISA 2015 data also shows that disadvantaged schools are less likely to have certified (21%) and full-time teachers (61%) than the most advantaged schools (40% and 76%, respectively). These gaps are also larger than those across OECD countries.
copy the linklink copied!Conclusion
While Georgia has implemented several initiatives in recent years to expand access and improve learning outcomes, a large share of students still does not master basic skills. Furthermore, the participation and learning outcomes of the most vulnerable student communities are very low and, in some cases, worsening. Georgia needs to develop a system that properly identifies where individual students are in the learning (chapter 2) and how different groups of students are performing across the country (chapter 5). These measures need to be accompanied by training teachers to educate students using modern pedagogies (chapter 3) and providing schools, especially the neediest ones, with the support they need to help all students learn (chapter 4). This report looks at how developing coherent evaluation and assessment systems within a long-term reform strategy could help to improve educational excellence and equity across the country (Box 1.2).
OECD Reviews of Evaluation and Assessment look at how evaluation and assessment policy can be used to improve student outcomes. They examine countries’ evaluation and assessment policies and practices for school education, and draw on insights from international practices, to provide actionable recommendations.
The reviews focus on four key components:
-
Student assessment monitors and provides feedback on individual student progress and certifies the achievement of learning goals.
-
Teacher appraisal assesses the performance of teachers in providing quality learning for their students.
-
School evaluation looks at the effectiveness of schools in providing quality education.
-
System evaluation uses educational information to monitor and evaluate the education system against national goals.
The reviews draw on existing OECD work on evaluation and assessment, which included reviews of 18 countries’ evaluation and assessment policies and practices. Each country review is based on national information provided by the country to the OECD, background research and country visits. During the country visits, a team of OECD staff and international experts meet with key actors across the education system to identify policy strengths and challenges, and discuss the challenges of evaluation and assessment with national actors. The OECD prepares a report for the country, which analyses national practices and policies, and provides policy recommendations to strengthen evaluation and assessment linked to national goals and priorities.
References
[4] Andguladze, N. and I. Mindadze (2018), “Standard setting in Georgia”, in Bair, J. et al. (eds.), Examination Standards - How measures and meaning differ around the world, UCL Press, London.
[20] Asian Development Bank (2016), Realizing the Urban Potential in Georgia: National Urban Assessment, https://www.adb.org/sites/default/files/institutional-document/186168/urban-potential-georgia.pdf (accessed on 20 May 2019).
[25] Burns, T., F. Köster and M. Fuster (2016), Education Governance in Action: Lessons from Case Studies, Educational Research and Innovation, OECD Publishing, Paris, https://dx.doi.org/10.1787/9789264262829-en.
[1] Freedom House (2018), Nations in Transit 2018: Georgia Country Report | Freedom House, https://freedomhouse.org/report/nations-transit/2018/georgia (accessed on 24 January 2019).
[17] Geostat (2015), 2014 General Population Census Results - Demographic and Social Characteristics, http://census.ge/en/results/census1/demo (accessed on 24 January 2019).
[45] Government of Georgia (2004), Law of Georgia on Higher Education.
[49] IEA (2015), TIMSS 2015 International Results in Mathematics, IEA, http://timssandpirls.bc.edu/timss2015/international-results/wp-content/uploads/filebase/full%20pdfs/T15-International-Results-in-Mathematics.pdf (accessed on 4 February 2019).
[11] ILO (2019), Country Profile - Georgia, https://www.ilo.org/ilostat/faces/oracle/webcenter/portalapp/pagehierarchy/Page21.jspx?_afrLoop=257818312756327&_afrWindowMode=0&_afrWindowId=jmbmphv5v_1#!%40%40%3F_afrWindowId%3Djmbmphv5v_1%26_afrLoop%3D257818312756327%26_afrWindowMode%3D0%26_adf.ctrl-st (accessed on 24 January 2019).
[33] Janashia, S. (2017), General Education in Georgia: Policy Problems and Solutions, ISET Policy Institute.
[50] Jennings, P. and M. Greenber (2009), “The prosocial classroom: Teacher social and emotional competence in relation to student and classroom outcomes”, Review of Educational Research,, Vol. 79/1, pp. 491-525, https://doi.org/10.3102/0034654308325693.
[35] Livny, E., Z. Abramishvili and L. Manukyan (2017), Georgian Students’ Performance in the Programme for International Student Assessment (PISA) and Trends in International Mathematics and Science Study (TIMSS) - A Synthesis of Findings and Policy Recommendations.
[42] Livny, E. et al. (2018), Policy Brief: Reforming the Georgian VET: Challenges and Ways Forward.
[52] Makarova, Y. (2016), “Assessing the focus of national education financing policies on equity”, https://unesdoc.unesco.org/ark:/48223/pf0000245619 (accessed on 28 January 2019).
[43] MoES (2018), Reform of Education System.
[23] MoES (2016), Order №40/n, On Approval of the National Curriculum.
[22] MoESCS (2018), Georgia Country Background Report, Ministry of Education and Science, Tbilisi.
[21] MoESCS (2017), Unified Strategy for Education and Science for 2017-2021.
[16] MoESCS (n.d.), Monitoring Report for Strategic Objectives and Action Plan Performance - United Strategy for Education and Science (2017-2021).
[40] OECD (2019), TALIS 2018 Results (Volume I): Teachers and School Leaders as Lifelong Learners, TALIS, OECD Publishing, Paris, https://dx.doi.org/10.1787/1d0bc92a-en.
[14] OECD (2018), Education at a Glance 2018: OECD Indicators, OECD Publishing, Paris, https://dx.doi.org/10.1787/eag-2018-en.
[10] OECD (2018), OECD Labour Force Statistics 2018, OECD Publishing, Paris, https://dx.doi.org/10.1787/oecd_lfs-2018-en.
[53] OECD (2016), PISA 2015 Database, http://www.oecd.org/pisa/data/2015database/ (accessed on 6 June 2019).
[15] OECD (2016), PISA 2015 Results (Volume I): Excellence and Equity in Education, PISA, OECD Publishing, Paris, https://dx.doi.org/10.1787/9789264266490-en.
[27] OECD (2016), PISA 2015 Results (Volume II): Policies and Practices for Successful Schools, PISA, OECD Publishing, Paris, https://dx.doi.org/10.1787/9789264267510-en.
[7] OECD (2016), Society at a Glance 2016: OECD Social Indicators, OECD Publishing, Paris, https://dx.doi.org/10.1787/9789264261488-en.
[8] OECD (2015), In It Together: Why Less Inequality Benefits All, OECD Publishing, Paris, https://dx.doi.org/10.1787/9789264235120-en.
[54] OECD (2010), Data base PISA 2009, http://www.oecd.org/pisa/data/pisa2009database-downloadabledata.htm (accessed on 6 June 2019).
[37] OECD (2001), Starting Strong: Early Childhood Education and Care, Starting Strong, OECD Publishing, Paris, https://dx.doi.org/10.1787/9789264192829-en.
[12] OECD Data (2018), Youth unemployment rate, https://data.oecd.org/unemp/youth-unemployment-rate.htm (accessed on 24 January 2019).
[44] Orkodashvili, M. (2012), “The Changing Faces of Corruption in Georgian Higher Education”, European Education, Vol. 44/11, pp. 27-45, https://doi.org/10.2753/EUE1056-4934440102.
[5] Posadas, J. et al. (2018), Georgia at Work: Assessing the Jobs Landscape, http://www.worldbank.org. (accessed on 24 January 2019).
[19] State Commission on Migration Issues (2017), 2017 Migration Profile of Georgia, http://migration.commission.ge/files/migration_profile_2017_eng__final_.pdf (accessed on 8 April 2019).
[34] Tabatadze, S. and N. Gorgadze (2017), “School voucher funding system of post-Soviet Georgia: From lack of funding to lack of deliverables”, Journal of School Choice International Research and Reform, Vol. 12/2, pp. 271-302, https://doi.org/10.1080/15582159.2017.1408000.
[3] Transparency International (n.d.), Georgia, https://www.transparency.org/country/GEO#chapterInfo (accessed on 24 January 2019).
[26] Transparency International (n.d.), Setting Georgia’s Schools Free?, https://www.transparency.ge/sites/default/files/post_attachments/School%20Reform-ENG_0.pdf (accessed on 24 January 2019).
[29] UNESCO (2014), 2014 Global Education for All Meeting - Final Statement The Muscat Agreement Status of EFA, http://unesdoc.unesco.org/images/0022/002281/228122E.pdf (accessed on 28 June 2018).
[30] UNESCO-UIS (2019), Education : Expenditure by level of education as a percentage of total government expenditure on education, http://data.uis.unesco.org/# (accessed on 5 February 2019).
[28] UNESCO-UIS (2018), Education : Expenditure on education as a percentage of total government expenditure (all sectors), http://data.uis.unesco.org/# (accessed on 25 January 2019).
[32] UNESCO-UIS (2018), Education : Government expenditure on education in constant PPP$, http://data.uis.unesco.org/# (accessed on 5 February 2019).
[46] UNESCO-UIS (2018), Education : Gross enrolment by level of education, http://data.uis.unesco.org/# (accessed on 29 January 2019).
[41] UNESCO-UIS (2018), Education : Net enrolment rate by level of education, http://data.uis.unesco.org/# (accessed on 15 April 2019).
[48] UNESCO-UIS (n.d.), Education : Distribution of enrolment by type of institution, 2018, http://data.uis.unesco.org/# (accessed on 20 January 2019).
[47] UNESCO-UIS (n.d.), UIS Statistics on Education, http://data.uis.unesco.org/?lang=en&SubSessionId=bc815974-9c38-4285-ba51-cf20d695f746&themetreeid=-200 (accessed on 2 February 2019).
[36] UNICEF (2018), Study on Quality of Early Childhood Education and Care in Georgia, https://www.unicef.org/georgia/reports/study-quality-early-childhood-education-and-care-georgia (accessed on 15 January 2019).
[51] UNICEF (2008), Georgia Monitoring the situation of children and women - Multiple Indicator Cluster Survey 2005.
[18] World Bank (2017), Social Exclusion and Inclusion in Georgia, https://openknowledge.worldbank.org/bitstream/handle/10986/28317/AUS16604-WP-v2-P156404-PUBLIC-full-report.pdf?sequence=1&isAllowed=y (accessed on 16 February 2019).
[9] World Bank (2016), Georgia: Recent Trends and Drivers of Poverty Reduction (FY16 Georgia Poverty Assessment) - Poverty and Equity Global Practice, http://pubdocs.worldbank.org/en/980951472223098077/Georgia-PPA-FY16-presentation-AUG2016-final.pdf (accessed on 24 January 2019).
[24] World Bank (2014), Georgia - Technical assistance to support preparation of education sector strategy : education sector policy review - strategic issues and reform agenda, http://documents.worldbank.org/curated/en/505151488895322292/Georgia-Technical-assistance-to-support-preparation-of-education-sector-strategy-education-sector-policy-review-strategic-issues-and-reform-agenda (accessed on 21 June 2018).
[31] World Bank (2014), Georgia Public Expenditure Review - Strategic Issues and Reform Agenda, http://documents.worldbank.org/curated/en/779561468275119198/pdf/781430GE0v10RE0Box0385291B00PUBLIC0.pdf (accessed on 10 February 2019).
[38] World Bank (2014), SABER Country Report Georgia - Teachers, World Bank Group, http://documents.worldbank.org/curated/en/788461468198234275/pdf/105634-WP-ADD-SERIES-PUBLIC-SABER-Teachers-Georgia-CR-Final-2014.pdf (accessed on 6 January 2019).
[13] World Bank (2013), Georgia - Skills Mismatch and Unemployment - Labor Market Challenges, http://documents.worldbank.org/curated/en/999371468242985088/pdf/728240ESW0Geor00Box377374B00PUBLIC0.pdf (accessed on 24 January 2019).
[2] World Bank (2012), Fighting corruption in public services : chronicling Georgia’s reforms, http://documents.worldbank.org/curated/en/518301468256183463/Fighting-corruption-in-public-services-chronicling-Georgias-reforms (accessed on 24 January 2019).
[39] World Bank (n.d.), A Review of Teacher Policy Reforms in Georgia - A Case Study, World Bank.
[6] World Bank (n.d.), Poverty gap at $5.50 a day (2011 PPP) (%) | Data, https://data.worldbank.org/indicator/SI.POV.UMIC.GP?locations=GE-AM-AZ-TR (accessed on 8 April 2019).
Metadata, Legal and Rights
https://doi.org/10.1787/94dc370e-en
© OECD 2019
The use of this work, whether digital or print, is governed by the Terms and Conditions to be found at http://www.oecd.org/termsandconditions.