
1. Under pressure: Labour market and wage developments in OECD countries
The recovery from the COVID-19 pandemic lost momentum in 2022, with employment and unemployment stabilising. Labour markets remain tight, despite signs of easing. In this context, the quality of jobs on offer has improved in some dimensions, but real wages are falling significantly in almost all OECD countries despite a pick-up in nominal wage growth. In most countries, profits have grown robustly, often more than nominal wages. Nominal minimum wages are keeping pace with inflation, but any real gains may fade rapidly if inflation remains high. In contrast, wages negotiated in collective agreements between employers or employers’ organisations and trade unions are reacting with some delay even in countries where the majority of workers are covered by a collective agreement, although a catch-up phase is expected in the coming quarters.
Amid a cost-of-living crisis, the robust recovery from the COVID-19 recession lost momentum since 2022. The energy shock caused by Russia’s war of aggression against Ukraine put a drag on global growth and contributed to propelling price inflation in many countries to levels not seen in decades. However, OECD labour markets have proved resilient. Employment and unemployment have held their ground, and the labour market remains tight in most countries, despite some signs of easing. The past quarters have shown signs of improvements, with global GDP growth picking up slightly.
The latest available evidence at the time of writing suggests that:
After stabilising in the second half of 2022, employment in the OECD area picked-up slightly in the first months of 2023. In May 2023, OECD-wide employment was about 3% higher than in December 2019. Unemployment rates across the OECD mostly remained below pre-crisis levels. A recent pick-up in growth has led to an improvement of the economic projections for the near future, but GDP growth is likely to remain subdued in 2023 and 2024. Over the same period of time, OECD-wide employment is projected to continue to expand and the unemployment rate to increase slightly.
Inactivity rates have declined relative to the pre- COVID-19 crisis in most countries. Early concerns that the pandemic might permanently increase inactivity rates have not come to pass, including among older adults. On average across all OECD countries, inactivity rates for 55 to 64 years old have decreased more than for the younger age groups. Inactivity rates for the whole working age population, however, are higher than before the crisis in seven OECD countries, with the largest increases found in Latin American member states.
Labour markets remain tight even as pressures are easing. Labour market tightness (i.e. the number of vacancies per unemployed person) eased in the second half of 2022 but remained well above pre-crisis levels. Online job postings data for selected countries suggest that labour demand has continued to ease in the first half of 2023.
Amid tight labour markets, nominal wage growth has picked up and some non-monetary aspects of job quality have improved. In Q1 2023, nominal year-on-year wage growth exceeded its pre-crisis level in nearly all OECD countries, reaching 5.6% on average across the 34 countries with available data. Among new hires, the share of temporary contracts and involuntary part-time has declined in most OECD countries. In addition, data on online job postings in Canada, the United Kingdom and the United States show an increase in the share of vacancies offering employee benefits, especially health-related benefits, retirement programs/schemes and paid time off.
As inflation reached levels not seen in decades in many countries, real hourly wages have fallen – often substantially – in virtually every industry and OECD country, contributing to the cost-of-living crisis. In Q1 2023, despite the pick-up in nominal wages, the difference between nominal annual wage growth and inflation was -3.8% on average across the 34 OECD countries with available data, with a negative difference observed in 30 countries. The loss of purchasing power is particularly challenging for workers in low-income households, who have less leeway to deal with increases in the cost of living through savings or borrowing and often face higher actual inflation rates because a higher proportion of their spending goes to energy and food.
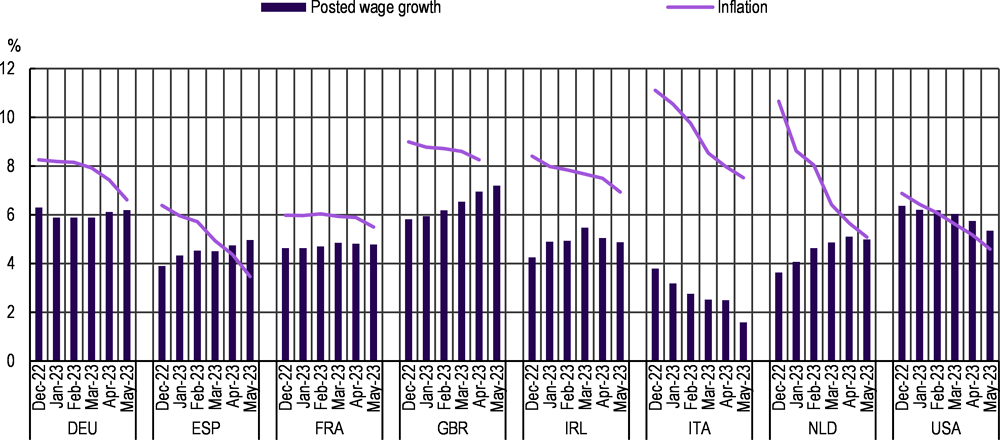
Nominal wage growth has not significantly accelerated in the first half of 2023, but the gap with declining inflation is narrowing in some countries. Recent wage data from five countries point to stable nominal wage growth in most in April and May 2023. Similarly, growth in wages posted on the online platform Indeed has been steady or declining in the first five months of 2023 in France, Germany, Ireland, Italy and the United States. In Spain, the Netherlands, and – more markedly – the United Kingdom nominal growth of posted wages has increased. In general, the gap between inflation and nominal wage growth in posted wages has become smaller. However, wages posted on Indeed have grown in real terms only in Spain and the United States in recent months.
In many countries, real wages are falling across all industries, but less so in low-pay industries. Among the 31 countries with available data, in Q1 2023, real wages in low-pay industries performed better than those in mid-pay industries in 18 countries, and better than those in high-pay industries in 22 countries. Real wages in low-pay industries had a worse performance than real wages in both mid- and high-pay industries only in six countries.
In most countries, profits have increased more than labour costs, making an unusually large contribution to domestic price pressures, and leading to a fall in the labour share. Data from Europe and Australia indicate that this has occurred not only in energy sectors, but also in other parts of the economy, including in accommodation and food and manufacturing. As economies re-opened, pent-up demand and large recovery plans bolstered aggregate demand, helping profits grow quickly while supply bottlenecks limited the speed of adjustment of output. With strong consumer demand and rapidly evolving inflation driven by external factors, many producers were likely able to adjust prices quickly, while wage increases typically involve longer renegotiations periods.
Several policy levers can be activated to limit the impact of inflation on workers and ensure a fair sharing of the cost-of-living crisis between taxpayers (through government taxes), companies, and workers. The most direct way to help workers is via an increase in their wages. Wage setting institutions – including minimum wages and collective bargaining – can help mitigate losses in purchasing power and ensure a fair distribution of the cost of inflation between firms and workers, while avoiding a price-wage spiral. The latest available evidence and information from a policy questionnaire addressed to Labour Ministries and social partners across OECD countries suggests that:
Between December 2020 and May 2023, on average across OECD countries, nominal statutory minimum wages have increased by 29%. This trend has allowed minimum wages to keep pace with inflation (prices increased by 24.6%, on average, over the same time period), even if real gains tend to be quickly eroded as inflation remains high. Going forward, it is important to ensure that statutory minimum wages continue to adjust regularly through the different national institutional settings and uprating mechanisms. There is a concern that increases in the minimum wage contribute to fuel inflation. However, the effect of minimum wage increase to the growth in aggregate wages is limited, even accounting for spillover effects on wages above the minimum.
In most OECD countries, increases in the minimum wage are the result of a discretionary policy decision that is typically taken once a year at most, while in six countries the national statutory minimum wage is automatically indexed to inflation. Automatic indexation helps to safeguard the purchasing power of minimum wage earners and improve the predictability of future increases. However, it also reduces the scope for governments, social partners or commissions to exercise judgement on future increases and could lead to an excessive compression of the wage distribution if other wages are not raised, with consequences both for individual careers, and for the design of redistribution policies.
Wages negotiated in collective agreements between firms and workers have declined in real terms and are reacting with longer delays. Several factors can explain why negotiated wages, on average, have not managed to keep up with inflation. Most importantly, the staggered and rather infrequent nature of wage agreements means that negotiated wages rarely adjust immediately to unexpected price inflation. However, in some OECD countries, unions, employers’ organisations and governments have found innovative ways to cushion the effects of inflation while limiting the costs for firms by using tax-free lump-sum bonuses or non-wage benefits.
Faster growth in negotiated wages is likely in the coming quarters as the most recent bargaining rounds have tried to recoup some of the losses in purchasing power. However, the available evidence suggests that, after a catch-up phase, nominal negotiated wage growth are likely to go back to previous trends without generating a price-wage spiral. Overall, aggregate nominal wage growth is projected to be just over 4% in the OECD area in 2023, before moderating to around 3.5% in 2024 while inflation is projected to be at 6.6% in 2023 and 4.3% in 2024.
Minimum wages and collective bargaining can help achieve a fair distribution of the cost of inflation between workers and employers, as well as across workers of different pay levels. A fair sharing of the cost of inflation can prevent further increases in inequality and support effective monetary policy by averting feedback loops between profits, wages and prices. The analysis of this chapter suggests that, in several sectors and countries, there is room for profits to absorb some further increases in wages to mitigate the loss of purchasing power at least for the low paid without generating significant additional price pressures. Given the downward rigidity of prices, the recent decline in input costs will also likely provide further room to absorb some wage increases without generating inflationary pressures. Collective bargaining can also help identify solutions tailored to firms’ varying ability to sustain increase in wages – for instance for small and medium firms that may face more significant constraints.
This chapter offers a detailed overview of recent labour market developments across the OECD countries with a particular focus on wage dynamics and discusses the policy measures that countries have at their disposal to help address the ongoing cost-of-living crisis, focusing on wage policies. This includes a discussion on the role that minimum wages and collective bargaining have played so far in cushioning the costs of inflation, drawing on a policy questionnaire that was addressed to OECD countries as well as employers’ organisations and trade unions through, respectively, the Business@OECD (BIAC) and the Trade Union Advisory Committee (TUAC) networks.
The chapter is organised as follows: Section 1.1 reviews recent labour market developments across the OECD; Section 1.2 reports on recent wage developments; and finally Section 1.3 discusses the role of statutory minimum wages and collective bargaining as a policy lever to support workers and ensure a fair burden-sharing of the cost of inflation among governments, firms and workers. Section 1.4 concludes with policy recommendations.
Growth across the OECD slowed substantially over the course of 2022, but there are signs of improvement in 2023 (Figure 1.1). Russia’s war of aggression against Ukraine pushed up prices substantially, especially for energy and food, adding to inflationary pressures at a time when the cost of living was already rising rapidly around the world. Inflation eroded household incomes and monetary policy tightened considerably amidst the unusually vigorous and widespread steps to raise policy interest rates by central banks in recent months (OECD, 2022[1]). By the fourth quarter of 2022, global growth had slowed to an annualised rate of just 2%, with growth over the year falling to 2.3%, just over half the pace seen through 2021. Output declined in 15 OECD economies in the fourth quarter, with most of these in Europe. The recent decline in energy prices and the improving prospects for China have contributed to an uptake in economic indicators in the first half of 2023, with global GDP growth picking up to an annualised rate of just over 3% in the first quarter, despite mixed outcomes across countries and particularly weak growth in the Euro Area (OECD, 2023[2]). In the first quarter of 2023, GDP for the OECD area stood 5% above its level at the end of 2019, after a year-on-year growth of 1.5% (Figure 1.1).
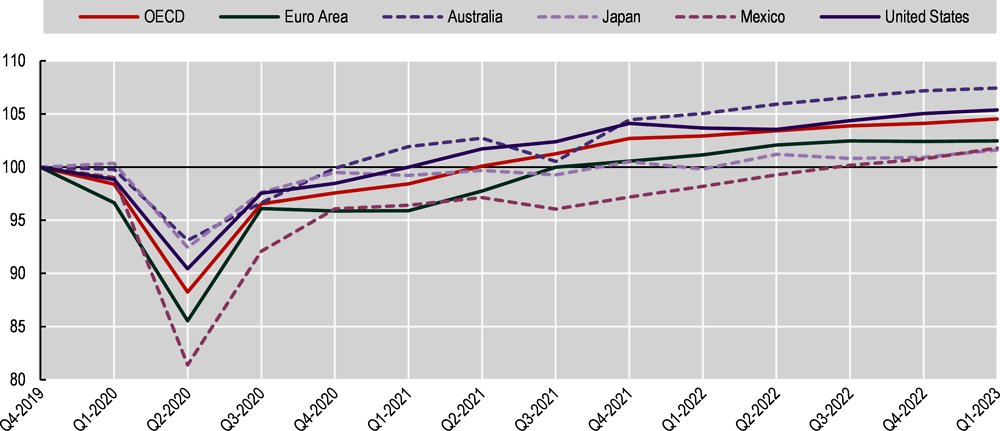
Note: Euro Area refers to the averages of 20 Eurozone countries.
Source: OECD (2023), “Quarterly National Accounts”, OECD National Accounts Statistics (database), https://doi.org/10.1787/data-00017-en (accessed on 23 June 2023).
Amid the slowdown in economic growth, employment growth also lost momentum over the course of 2022 but continued to grow in the first months of 2023 (Figure 1.2). In May 2023, total employment for the OECD, was about 3% higher than in December 2019. Overall, employment growth since the start of the pandemic was slightly stronger for women than men (see Box 1.1). Employment rates across most OECD countries also stabilised above pre-crisis levels by the first quarter of 2023 (Annex Figure 1.A.1).
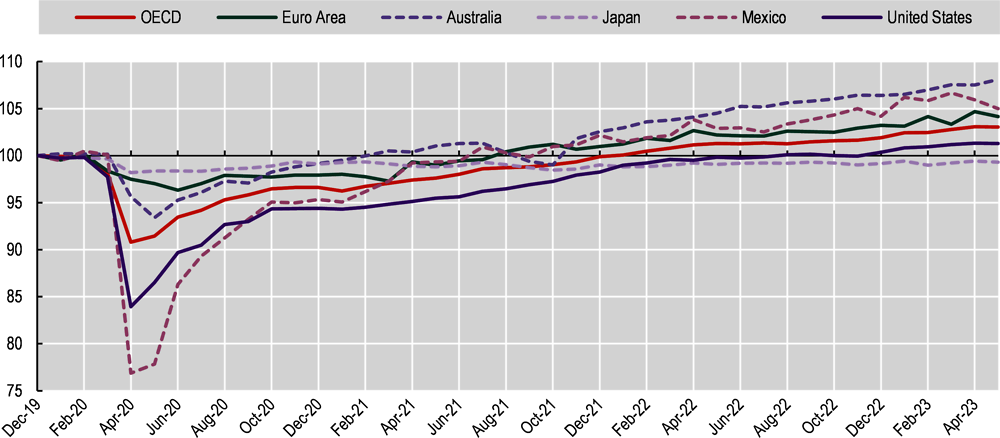
Note: Euro Area refers to the averages of 20 Eurozone countries. The OECD average, the Euro Area and Mexico are derived from the OECD Monthly Unemployment Statistics estimated as the unemployment level times one minus the unemployment rate and rescaled on the LFS-based quarterly employment figures.
Source: OECD (2023), “Labour: Labour market statistics”, Main Economic Indicators (database), https://doi.org/10.1787/data-00046-en (accessed on 3 July 2023).
The initial labour market impact of the pandemic was stronger among women than men in most OECD countries, raising the concern that the pandemic-induced recession might be a “shecession” (OECD, 2020[3]). However, as economies reopened, in most OECD countries women benefitted more than men from the rebound in economic activity. Indeed, in early 2022 – two years after the onset of the pandemic – the employment rate gap between men and women had declined in most of the OECD countries relative to its pre-pandemic level (Salvatori, 2022[4]).
Over the course of 2022 and the first half of 2023, employment levels for both women and men stabilised above pre-pandemic levels (Figure 1.3). By May 2023, on average across the OECD, women’s total employment had grown about 1 percentage point more than men’s, reaching 3.5% above its pre-crisis level.
Note: Women’s and men’s employment are indexed to 100 in December 2019. Euro Area refers to the averages of 20 Eurozone countries. The OECD average and the Euro Area are estimates derived from the OECD Unemployment statistics estimated as the unemployment level times one minus the unemployment rate and rescaled on the LFS-based quarterly employment figures.
Source: OECD (2023), “Labour: Labour market statistics”, Main Economic Indicators (database), https://doi.org/10.1787/data-00046-en (accessed on 3 July 2023).
Similarly, unemployment rates across the OECD held their ground as the year ended, mostly remaining below pre-crisis levels (Figure 1.4). The average unemployment rate for the OECD stood at 4.8% in May 2023 – or half a percentage point below its pre-crisis levels. In May 2023, the unemployment rate indeed exceeded its pre-crisis levels by at least half a percentage point only in four countries – with the maximum difference of 1.6 percentage points recorded in Estonia.
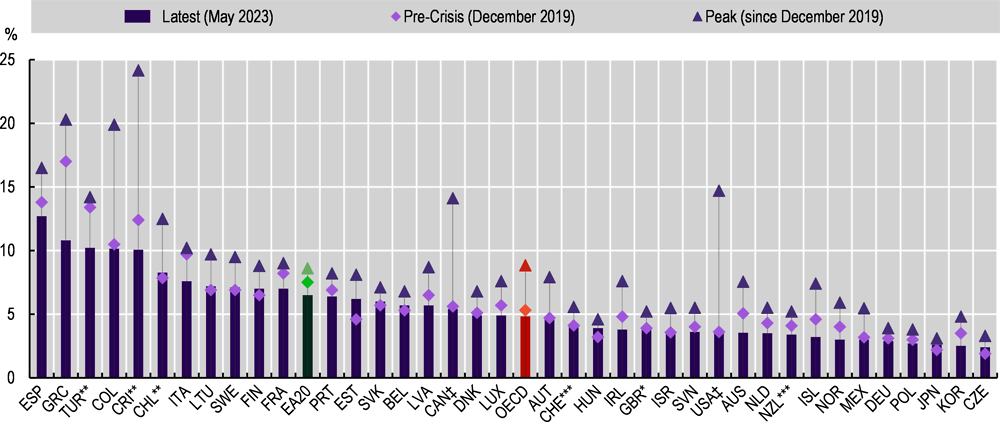
Note: The labour force population includes all those aged 15 or more. Euro Area refers to the averages of 20 Eurozone countries. For countries marked with * the latest data refer to March 2023, those marked ** to April 2023; those marked *** to Q1 2023; and those marked ‡ to June 2023.
Source: OECD (2023), “Unemployment rate” (indicator), https://doi.org/10.1787/52570002-en (accessed on 11 July 2023).
1.1.1. Inactivity rates have generally declined but average hours worked are slightly below pre-crisis levels in several countries
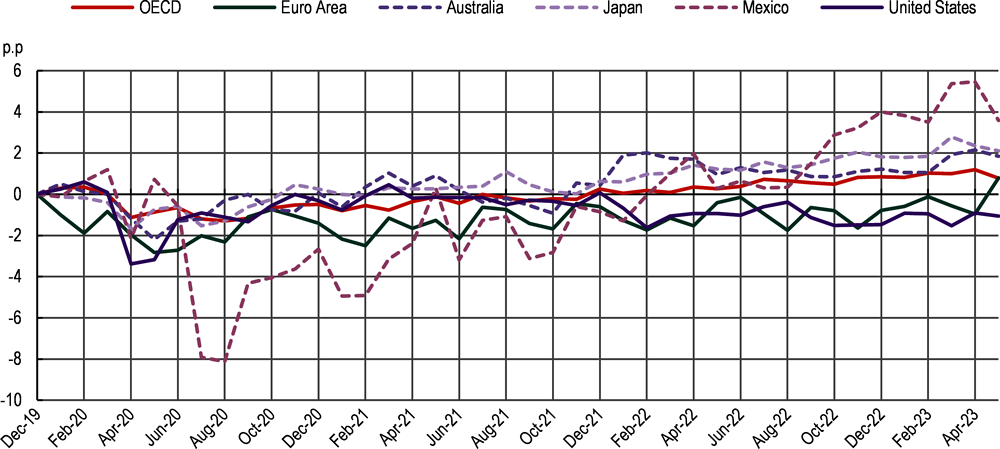
Inactivity rates among the working age population are below pre-crisis levels in most countries, pointing to a recovery of labour supply from the initial decline at the start of the COVID-19 crisis. As of Q1 2023, inactivity rates were at or below pre-crisis levels in 31 countries, with an average decline across all countries of just under 1 percentage point. Inactivity rates were at least 1 percentage point above pre-crisis levels only in Colombia, Costa Rica and Latvia.1
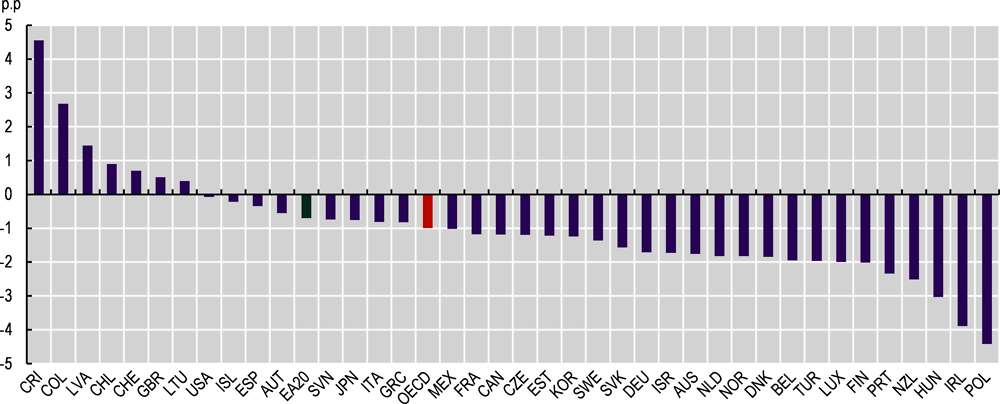
Note: The working age population includes all those aged 15 to 64. OECD is an unweighted average of the countries shown above. Euro Area refers to 20 Eurozone countries. p.p: percentage point.
Source: OECD (2023), “Labour: Labour market statistics”, Main Economic Indicators (database), https://doi.org/10.1787/data-00046-en (accessed on 28 June 2023).
Inactivity rates have generally decreased among older adults as well, despite earlier concerns that the pandemic might induce a permanent reduction in the labour supply of this group. In fact, on average across all OECD countries, by Q1 2023, the inactivity rate for individuals aged 55 to 64 had decreased relative to pre-crisis levels more than for those aged 25 to 54 (-2.5 vs -0.6 percentage points) (Annex Figure 1.A.2). More broadly, there is little indication that the pandemic induced an increase in retirement of older workers across countries. While some earlier evidence for the United States suggested that this might have been the case (Faria-e-Castro, 2021[5]), more recent data point to a limited impact (Thompson, 2022[6]). In addition, there is no indication of significant increases in retirement in the United Kingdom (Murphy and Thwaites, 2023[7]), the Euro Area (Botelho and Weißler, 2022[8]) or Australia (Agarwal and Bishop, 2022[9]).
Hours worked per employed person are below pre-crisis levels in most countries with recent data available (Figure 1.6). The persistence of lower hours worked in tight labour markets does raise the question as to whether the COVID-19 crisis might have led to some structural changes, for example in workers’ preferences over work-life balance. However, the differences are generally small. In Q4 2022, hours worked per employed person were above pre-crisis levels or below that level by less than 2% in 22 of the 30 countries with recent data available. On average, hours worked per employed person were down by just under -1%. In Latvia, New Zealand, Slovenia and Poland they had increased by more than 2%, while they had decreased by more than 4% in Ireland, the Slovak Republic, Portugal, Austria and Korea. The relatively large decline in hours per employed in Korea is due to the progressive lowering of the statutory limit on total weekly working hours from 68 to 52 (Carcillo, Hijzen and Thewissen, 2023[10]).
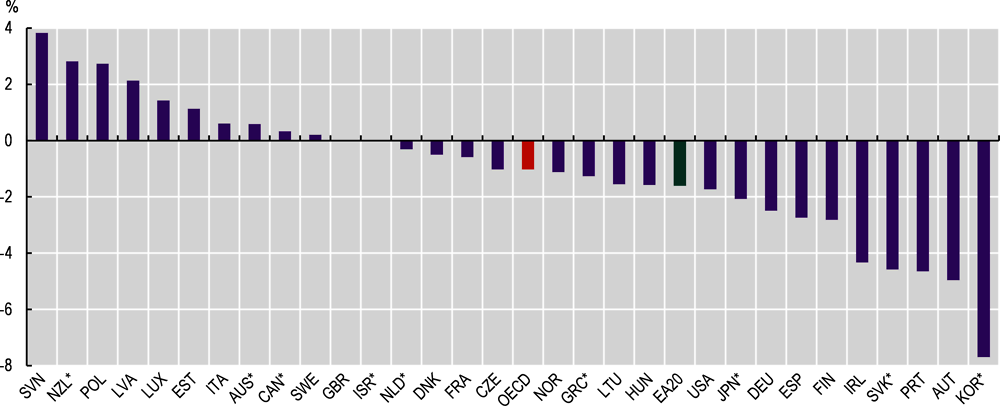
Notes: The figure reports total hours worked divided by total employment. OECD is an unweighted average of the countries shown above. Euro Area refers to 20 Eurozone countries. For New Zealand, it refers to total paid hours divided by filled jobs. *The latest quarter Is Q4 2022.
Source: OECD (2023), “Quarterly National Accounts”, OECD National Accounts Statistics (database), https://doi.org/10.1787/data-00017-en (accessed on 23 June 2023) for the Euro Area and the United Kingdom, Labour Force Survey (Australian Bureau of Statistics), Labour Force Survey (Statistics Bureau of Japan), Economically Active Population Survey (Statistics Korea), Household Labour Force Survey – Tables QEM034AA and QEM025AA (Statistics New Zealand), and Current Population Survey (U.S. Bureau of Labor Statistics).
1.1.2. Labour markets remain tight even as there are signs that pressure is easing
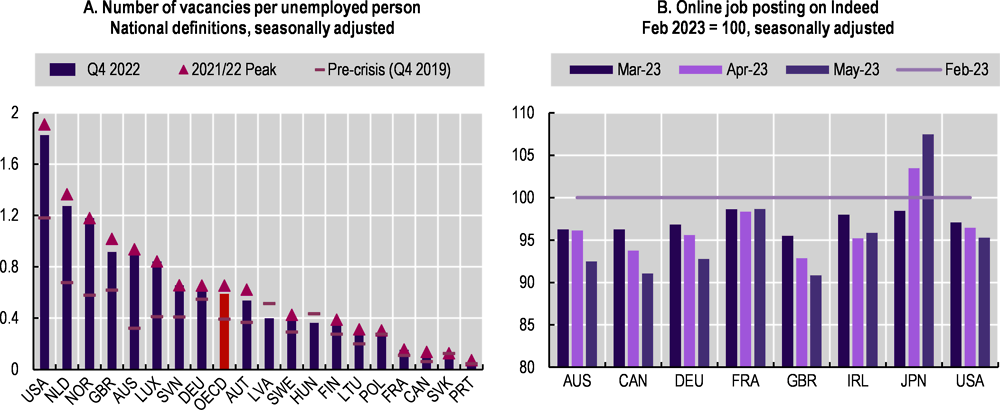
After the sharp increase in vacancies in 2021 amid the unprecedented rebound of economic activity, labour market tightness (i.e. the number of vacancies per unemployed person) peaked in the first half of 2022 in many OECD countries (Figure 1.7, Panel A). Among the 19 countries with data available, the increase in tightness in 2021 was particularly large in English speaking countries, but also in Norway and the Netherlands.2 By the end of 2022, labour market tightness was mostly below its peak levels but generally remained significantly higher than before the COVID-19 crisis.
Data on job postings on the online platform Indeed suggest a continued easing over more recent months in the majority of countries (Figure 1.7, Panel B). Online job postings declined in the first five months of 2023 in Australia, Canada, Germany, the United Kingdom and the United States. The largest decline occurred in the United Kingdom (-10% in May 2023 relative to February 2023). In France, online job postings declined at the start of the year and stabilised in the three months leading to May 2023. Japan is the only country among those with available data where online job postings increased steadily in the first half of 2023. In New Zealand, the official index of online job vacancies fell 9.9% in the year to March 2023.3
Note: OECD is an unweighted average of the countries shown above. In Panel A, the definition of vacancies is not harmonised across countries. For European countries (except Austria, France, Germany, Hungary and Portugal – see below), a vacancy is defined as a paid post that is newly created, unoccupied, or about to become vacant for which the employer is taking active steps and is prepared to take further steps to find a suitable candidate from outside the enterprise concerned; and which the employer intends to fill either immediately or within a specific period. For Australia, a vacancy is defined as a job available for immediate filling and for which recruitment action has been taken by the employer. For Austria, a vacancy is defined as a job notified by firms to employment agencies which remain unfilled at the end of the month. For Canada, a vacancy is defined as a job meeting the following conditions: it is vacant on the reference date (first day of the month) or will become vacant during the month; there are tasks to be carried out during the month for the job in question; and the employer is actively seeking a worker outside the organisation to fill the job. The jobs could be full-time, part-time, permanent, temporary, casual, or seasonal. Jobs reserved for subcontractors, external consultants, or other workers who are not considered employees, are excluded. For France, a vacancy is defined as the monthly number of vacancies posted by companies in Pôle emploi. For Germany, a vacancy is defined as a job of seven days’ duration or more reported by employers to employment agencies to be filled within three months and remaining unfilled at the end of the month. For Hungary, a vacancy is defined as the number of vacancies notified to local labour offices and then to the Ministry of Labour. For Portugal, a vacancy is defined as the number of vacancies reported by employers to be still vacant at the end of the month. For the United Kingdom, a vacancy is defined as a position for which employers are actively seeking recruits from outside their business or organisation (excluding agriculture, forestry and fishing) based on the estimates from the Vacancy Survey. For the United States, a vacancy is defined as a job that is not filled on the last business day of the month and a job is considered open if a specific position exists and there is work available for it, the job can be started within 30 days, and there is active recruiting for the position.
Source: OECD (2020), “Labour: Registered unemployed and job vacancies (Edition 2019)”, Main Economic Indicators (database), https://doi.org/10.1787/190bb5bc-en (accessed on 23 June 2023) for Australia, Austria, Germany, Hungary, Portugal, the United Kingdom, Job vacancy statistics by NACE Rev.2 activity for Finland, Luxembourg, Latvia, Lithuania, the Netherlands, Norway, Poland, the Slovak Republic, Slovenia and Sweden (Eurostat), Job vacancies, payroll employees, and job vacancy rate (Statistics Canada), Les demandeurs d’emploi inscrits à Pôle emploi (Dares, France), Posti vacanti (Italian National Institute of Statistics), Job Openings and Labor Turnover Survey (U.S. Bureau of Labor Statistics, retrieved from FRED); Online job posting on Indeed.
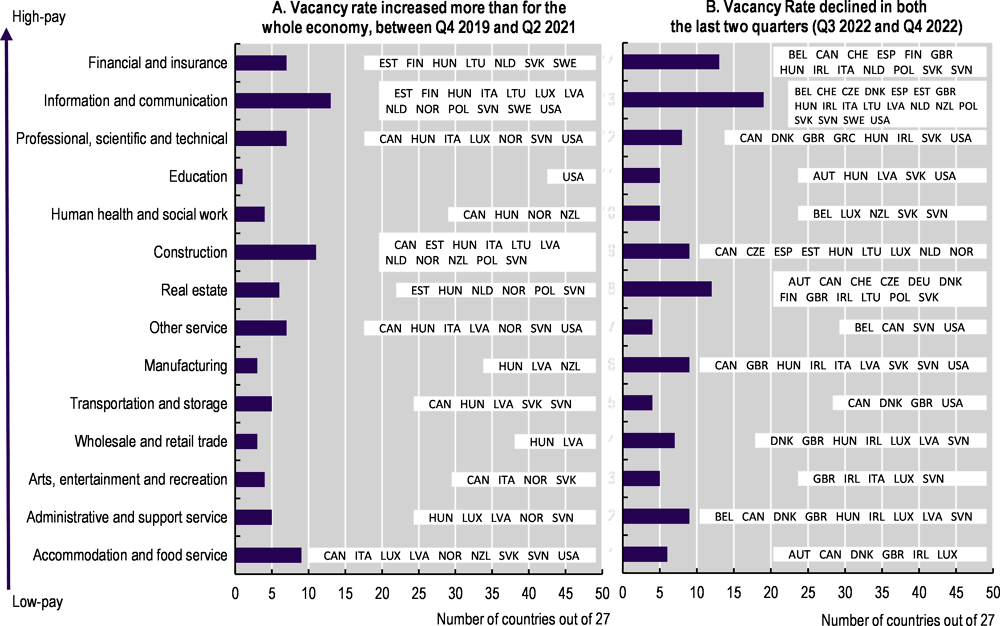
Imbalances between labour demand and supply have been widespread across industries. Vacancy rates capture the fraction of all available jobs that are unfilled and for which employers state that they are actively trying to recruit. Panel A of Figure 1.8 provides an overview of the number of countries (out of the 27 with available data) in which a specific industry experienced an increase in vacancy rates larger than the country average. The three industries most likely to have seen relatively larger increases in vacancy rates cut across the pay ranking are “Information and Communication” (13 countries), Construction (11 countries), and “Accommodation and Food Services” (9 countries).
Vacancy rates declined in the last two quarters of 2022 in many industries across countries (Panel B of Figure 1.8). Declines in vacancy rates have been particularly frequent across countries in “Finance and insurance” (13 countries) and “Information and communication” (19 countries) – two high-pay service sectors. Other industries with frequent declines in vacancy rates across countries are found across the pay rank, and include construction, manufacturing and “administrative and support services” (9 countries each).
Note: Countries where a given industry has increased more than for the whole economy (resp. has declined for the last two quarters) are indicated in white background in the chart. The countries included are Austria, Belgium, Canada, the Czech Republic, Denmark, Estonia, Finland, Germany, Greece, Hungary, Ireland, Italy, Luxembourg, Latvia, Lithuania, the Netherlands, New Zealand, Norway, Poland, Portugal, the Slovak Republic, Slovenia, Spain, Sweden, Switzerland, the United Kingdom and the United States. The definition of vacancies and vacancy rate is not harmonised across countries. For Italy, it refers to paid jobs (new or existing, if they are vacant or about to become vacant) for which the employer is looking (actively and outside the company) for a suitable candidate and is willing to make additional efforts to find one. The vacancy rate is the percentage ratio of the number of vacancies to the sum of vacancies with filled job positions. For the United States, it refers to all jobs that are not filled on the last business day of the month. A job is considered open if a specific position exists and there is work available for it, the job can be started within 30 days, and there is active recruiting for the position. For Canada, a job is considered vacant if it meets the following conditions: it is vacant on the reference date (first day of the month) or will become vacant during the month; there are tasks to be carried out during the month for the job in question; and the employer is actively seeking a worker outside the organisation to fill the job. The jobs could be full-time, part-time, permanent, temporary, casual, or seasonal. Jobs reserved for subcontractors, external consultants, or other workers who are not considered employees, are excluded. The job vacancy rate is the number of job vacancies expressed as a percentage of labour demand; that is, all occupied and vacant jobs. For the United Kingdom, vacancies are defined as positions for which employers are actively seeking recruits from outside their business or organisation. The estimates are based on the Vacancy Survey; this is a survey of employers designed to provide estimates of the stock of vacancies across the economy, excluding agriculture, forestry, and fishing. The vacancy rate is calculated as the number of vacancies per 100 jobs. For countries from Eurostat, a vacancy is defined as a paid post that is newly created, unoccupied, or about to become vacant for which the employer is taking active steps and is prepared to take further steps to find a suitable candidate from outside the enterprise concerned; and which the employer intends to fill either immediately or within a specific period. The job vacancy rate is the number of job vacancies expresses as a percentage of the sum of the number of occupied posts and the number of job vacancies. For New Zealand, Jobs Online measures changes in online job advertisements from 4 internet job boards – SEEK, Trade Me Jobs, Education Gazette and Kiwi Health Jobs (Index August 2010 = 100). For Austria, a vacancy is defined as a job notified by firms to employment agencies which remain unfilled at the end of the month.
Source: Job vacancy statistics by NACE Rev.2 activity (Eurostat), Job vacancies, payroll employees, and job vacancy rate by industry (Statistics Canada), Jobs Online (Ministry of Business, Innovation & Employment, New Zealand), Vacancies by industry (UK Office for National Statistics), Job Openings and Labor Turnover Survey (U.S. Bureau of Labor Statistics, retrieved from FRED).
Numerous factors contribute to differences in the dynamics of labour market tightness between countries. On the demand side, the initial strength of the economic rebound and the intensity of the slowdown differed depending on the composition of the economy, exposure to the energy crisis, and timing of the tightening of monetary policy. On the supply side, while labour market participation is back to pre-crisis levels in most countries (see above), the speed of its recovery varied. Notably, labour force participation lagged behind in two of the largest OECD economies – the United States and the United Kingdom – which also experienced some of the largest increases in labour market tightness. The European Central Bank (2023[11]) attributes part of the higher labour market tightness in the United States relative to the Euro Area to the slower recovery of labour supply.
As the COVID-19 crisis began, there was a concern that the crisis would create mismatches between labour supply and demand due to its differential impact across industries (Salvatori, 2022[4]). However, studies have found that the initial increase in mismatch was short-lived and smaller than during the Global Financial Crisis (Pizzinelli and Shibata, 2023[12]; Duval et al., 2022[13]). During the recovery, labour demand increased across sectors and countries, with no significant changes in sectoral composition. Some evidence suggests that workers redirected job searches away from affected occupations but not industries (Carrillo-Tudela et al., 2023[14]; Hensvik, Le Barbanchon and Rathelot, 2021[15]).
In some countries, quits increased as workers reaped the benefits of tight labour markets
Workers have taken advantage of tight labour markets to improve their working conditions, leading to an uptake in quits and job mobility in several countries. In the United States, quits in non-farm employment increased to their highest levels since the start of series in 2000. After a peak in December 2021, the quit rate (i.e. quits as percentage of total employment) returned to pre-crisis levels in April 2023.4 Initial concerns that this wave of resignations might be eroding the labour force have not come to pass as participation rates in the United States have continued to increase. Instead, the increase in quits is linked to an improvement in working conditions especially for younger and less-educated workers (Autor, Dube and McGrew, 2023[16]). In addition, historical evidence from manufacturing, indicate that the recent surge in quits was not unprecedented since waves of job quits have occurred during all fast recoveries in the post-war period in the United States (Hobijn, 2022[17]).
Similarly, evidence from France indicates that the increase in quits in 2022 was large but not unprecedented and did not erode the labour force, as over 80% of those who quit were employed within six months. Evidence from early 2022, indicates that amid the recruiting difficulties and the increase in workers’ mobility, some firms have made attempts to improve working conditions or allow more flexibility in the organisation of work (Lagouge, Ramajo and Barry, 2022[18]). Similar results also hold for Italy (Armillei, 2023[19]). In the United Kingdom, job-to-job transitions reached a record high at the end of 2021, and then declined slightly over the course of 2022, but in Q4 2022 they were still 10% higher than in the same quarter of 2019.5 By contrast, there is little indication of an increase in quits in Australia, as the proportion of businesses with open vacancies reporting the need to replace leaving employees was stable just under 80% over the course of 2021 and 2022.6
Amid tight labour markets, online job postings have offered benefits more frequently while temporary contracts and involuntary part-time have decreased among new hires
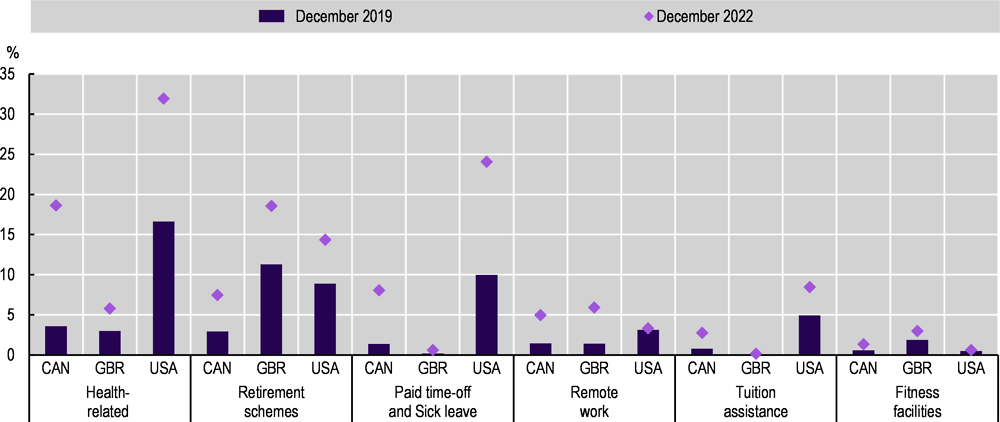
Amid tight labour markets, the share of online job postings offering job benefits has increased in several countries.7 Between December 2019 and December 2022, the United States, Canada and the United Kingdom saw an increase in the share of online job postings offering employee benefits, especially health-related benefits (including dental, vision and life insurance), retirement programs/schemes and paid time off (Figure 1.9).8 The fraction of job postings offering health-related benefits increased in particular in the United States and Canada, by 24 and 11 percentage points respectively. The mention of retirement benefits increased the most in the United Kingdom (+15 percentage points), while the share of job postings offering paid time off or sick leave increased by 17 percentage points in the United States. There were also significant increases in the mention of tuition assistance in Canada and the United States, and small increases in the mention of fitness facilities in all three countries analysed.
The increase in benefit offerings coincided with the sharp increase in labour market tightness described above. While this suggests that workers overall might have benefitted from the tight labour markets of the last year, additional analysis find no indication that benefit offerings increased more in industries where the growth in labour demand (as proxied by the growth in the number of job postings) was stronger (see Annex 1.B).9 The increase in benefit offers also appear to affect industries regardless of their pay level.
Note: An online job posting offers a benefit if it includes in the text at least one of the keywords listed in Annex 1.B.
Source: OECD calculations based on Lightcast data.
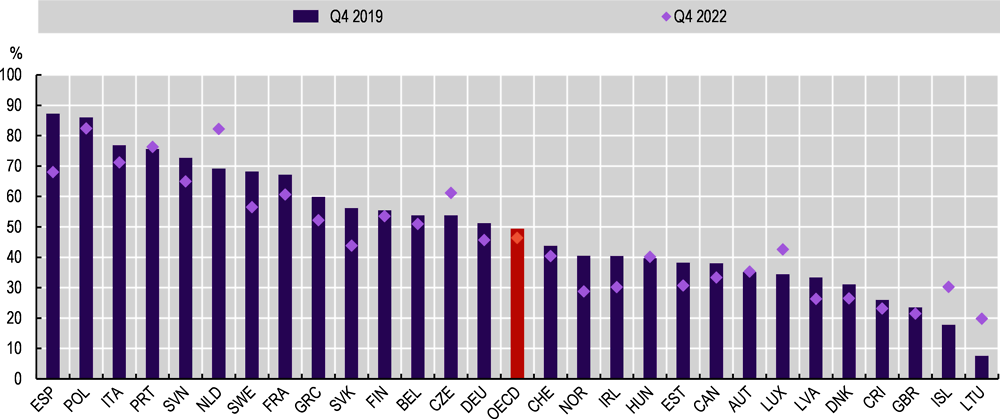
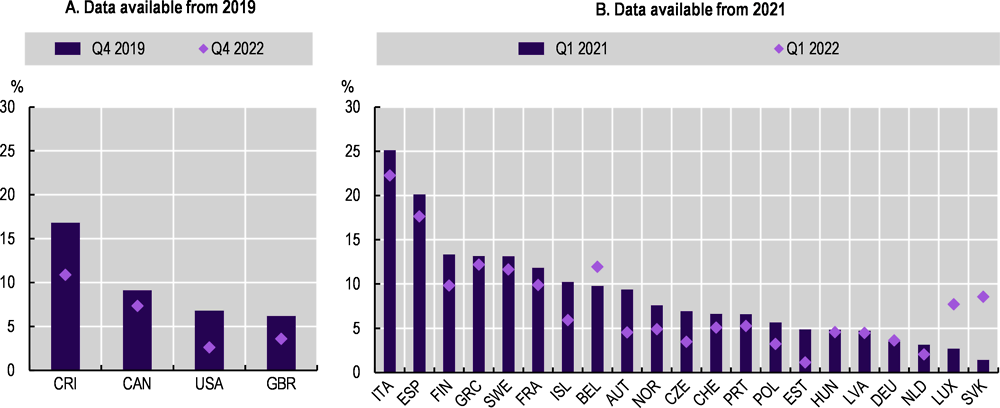
Amid the tight labour markets, the number of temporary contracts and of workers in involuntary part-time jobs have declined among new hires, suggesting an improvement in the working conditions of this group.10 In Q4 2022, the share of new hires on temporary contracts was lower than in Q4 2019 in 20 of the 28 countries with data available – despite the strong economic cycle in both periods (Figure 1.10). On average, the share of new hires on temporary contracts declined from 49% to 46%. The largest proportional declines were recorded in Norway, Spain, Sweden, the Slovak Republic and Ireland, while Lithuania and Iceland saw an increase in the share of new hires on temporary contracts although from initially low levels. Involuntary part-time among new hires declined between Q4 2019 and Q4 2022 in Canada, Costa Rica, the United Kingdom and the United States (Figure 1.11, Panel A). Similarly, in European countries, involuntary part-time among new hires declined in 18 of the 21 countries with data available between Q1 2021 and Q1 2022 (Figure 1.11, Panel B).11
Note: OECD is the unweighted average of the countries shown. New hires are defined as employees with a tenure of at most three months.
Source: OECD calculations based on the Canadian Labour Force Survey (Statistics Canada), the Labour Force Survey (UK Office for National Statistics), Encuesta Continua de Empleo (Costa Rica) and EU labour force survey (EU-LFS) for European countries.
Note: Denmark, Ireland and Lithuania are not included due to anomalies in the data. Data on the share of new hires in involuntary part-time in Panel B are only available from Eurostat from Q1 2021 to Q4 2022. The figure focuses on the comparison between Q1 2021 and Q1 2022 to account for possible seasonality effects. New hires are defined as employees with tenure of at most three months.
Source: OECD calculations based on the Canadian Labour Force Survey (Statistics Canada), the Labour Force Survey (UK Office for National Statistics), Encuesta Continua de Empleo (Costa Rica), Current Population Survey (U.S. Bureau of Labor Statistics) and EU labour force survey (EU-LFS) for European countries.
1.1.3. Economic growth in the OECD is expected to remain subdued in 2023 and 2024, with moderate employment growth and a small increase in unemployment
Despite the signs of improvement seen in the early months of 2023, the outlook is for a period of subdued growth and persisting inflation.12 The full effects of the tightening of monetary policy since the start of 2022 are likely to appear over the course of 2023 and early 2024, particularly on private investment. Annual OECD GDP growth is projected to be below trend at 1.4% in both 2023 and 2024, although it will gradually pick up on a quarterly basis through 2024 as inflation moderates and real income growth strengthens. Helped by the decline in energy prices over the past few months, average annual headline inflation in the OECD as a whole is now projected to fall relatively quickly from 9.4% in 2022 to 6.6% in 2023 and 4.3% in 2024, with year-on-year inflation in the last quarter of 2024 down to 3.8%.
OECD-wide employment is projected to keep expanding in 2023-24 (Figure 1.12) and the unemployment rate to rise only marginally, especially in the Euro Area. The OECD-wide unemployment rate is expected to increase from 4.9% at the end of 2022 to 5.2% in the fourth quarter of 2024 (Figure 1.12), though with relatively large rises of around 0.75 percentage point or more in Australia, New Zealand, the United Kingdom and the United States.
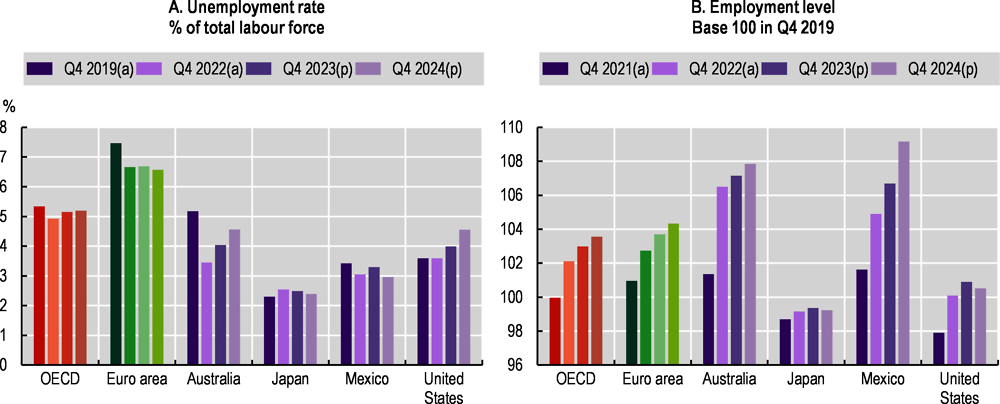
Note: (a) Actual value. (p) OECD projection. Euro Area refers to the 17 EU member states using the euro as their currency which are also OECD Member States.
Source: OECD (2023[2]), OECD Economic Outlook, Volume 2023 Issue 1: Preliminary version, https://doi.org/10.1787/ce188438-en.
Significant uncertainty about economic prospects remains, and the major risks to the projections are on the downside. One key concern is that inflation could continue to be more persistent than expected requiring tighter monetary policy for longer. In addition, the impact on economic growth could be stronger than expected if tighter financial conditions were to trigger stress in the financial system and undermine financial stability. Another key downside risk to the outlook relates to the uncertain course of Russia’s war of aggression against Ukraine and the associated risks of renewed disruptions in global energy and food markets. On the upside, reduced uncertainty from an early end to the war, easier-than-expected financial conditions, more robust labour force growth, and greater use of accumulated savings by households and businesses would all improve growth and investment prospects.
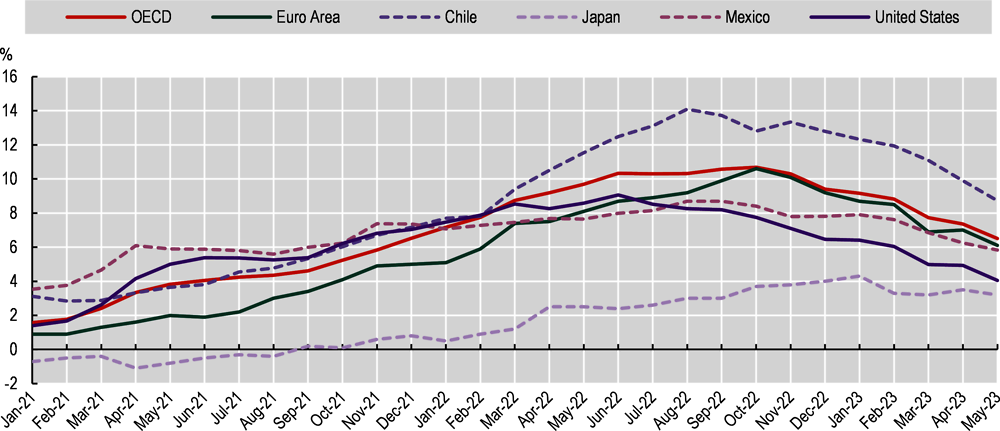
The COVID-19 crisis was followed by a large surge in prices. Prices began to increase in 2021 due to the rapid rebound from the pandemic and related supply chain bottlenecks (Figure 1.13). Then, over the course of 2022, the impact on energy prices of Russia’s war of aggression against Ukraine pushed inflation to levels not seen for decades in most countries. Inflation was initially mostly imported and driven by input and energy prices (OECD, 2022[1]), but, over the course of 2022, it became more broad-based with higher costs increasingly being passed through into the prices of goods and services (OECD, 2022[1]).13
Note: Euro Area refers to the 20 EU member states using the euro as their currency.
Source: OECD (2023), “Prices: Consumer prices”, Main Economic Indicators (database), https://doi.org/10.1787/0f2e8000-en (accessed on 4 July 2023).
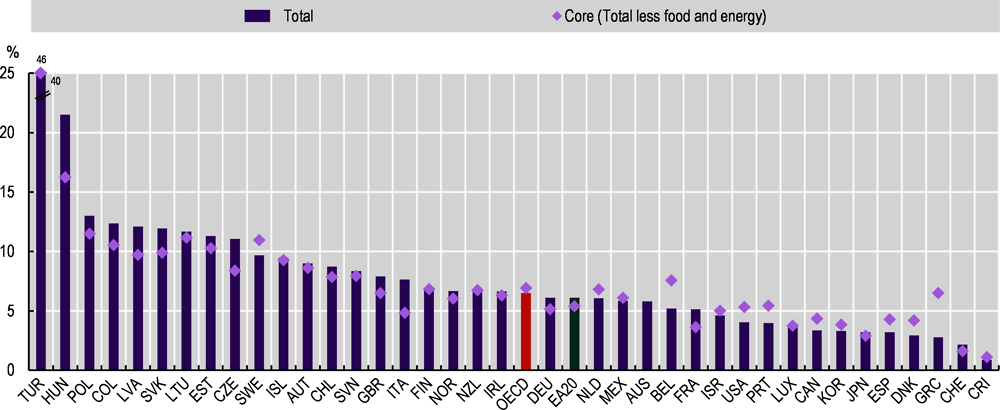
Inflation for the OECD area increased rapidly from below 2% at the start of 2021 to a peak of 10.7% in October 2022 and then fell to 6.5% in May 2023 – the last observation available at the time of writing. As of May 2023, inflation remained above 10% in nine OECD countries. Differences in total inflation across countries tended to be larger than differences in core inflation (see Figure 1.14), reflecting the differential exposure of countries to the increases in energy prices. Because of their higher vulnerability to the increase of energy prices, total inflation was particularly high in countries in Central and Eastern Europe. In general, however, amongst OECD countries, inflation was higher in Europe and South America, while it remained at relatively low levels in Korea and Japan (3.3% and 3.2% respectively).
Note: Core inflation represents price changes excluding energy and food items, not available for Australia. Euro Area refers to 20 Eurozone countries. * For New Zealand, the data refer to year-on-year changes from Q1 2022 to Q1 2023.
Source: OECD (2023), “Prices: Consumer prices”, Main Economic Indicators (database), https://doi.org/10.1787/0f2e8000-en (accessed on 4 July 2023), and Monthly CPI Indicator (Australian Bureau of Statistics).
1.2.1. Low-income households often face higher effective inflation rates and have less leeway to absorb increases in the cost of living
In most countries, low-income households have faced a higher effective inflation rate because a higher proportion of their spending goes towards energy and food which drove most of the initial increase in inflation.14 Similarly, there is evidence that rural households have suffered more in several countries because energy and fuel account for a larger share of their total expenditures (Causa et al., 2022[20]). In general, however, as inflation becomes more broad-based, differences in effective inflation rates across different households or groups with different consumption patterns become less pronounced.
However, low-income households have less leeway to absorb increases in cost of living even when facing effective inflation rates like those of other households. First, low-income households might have less room to substitute for lower-price alternatives if they are already buying cheaper versions of a given item.15 Second, low-income households typically can rely less on savings or borrowing to buffer the increase in cost of living (Charalampakis et al., 2022[21]; The German Council of Economic Experts, 2022[22]).16
1.2.2. Despite a pickup in nominal wage growth, real wages are falling in all OECD countries
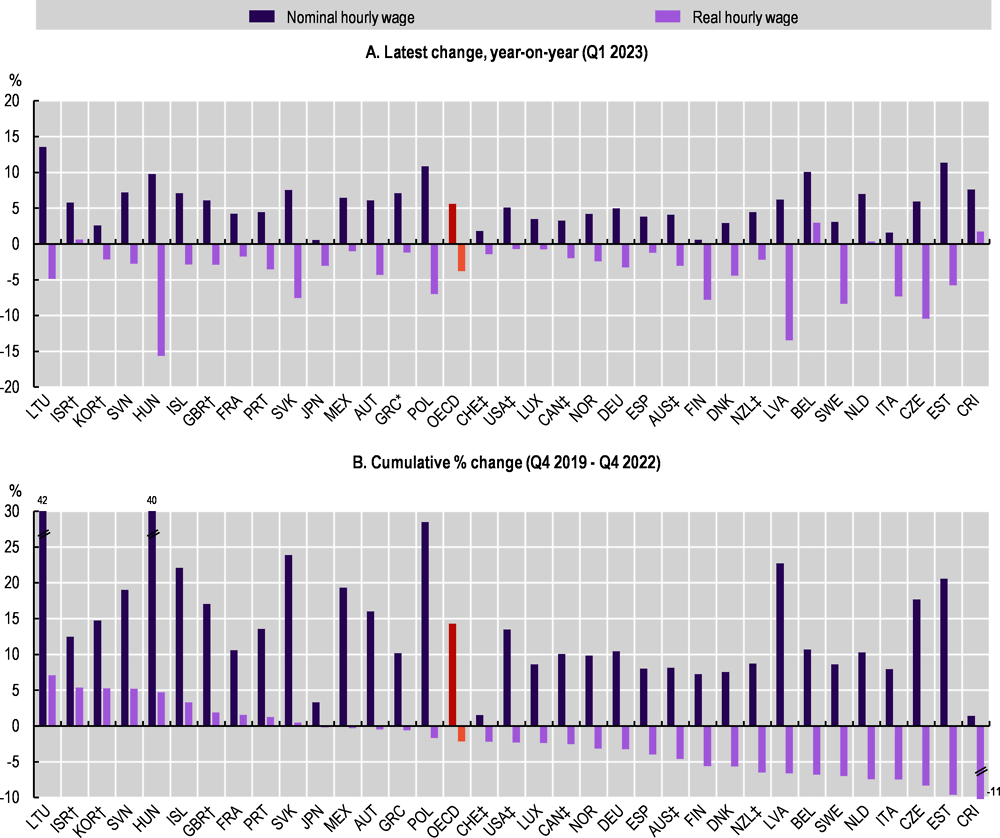
Year-on-year nominal growth in hourly wages generally picked up in 2022, but by less than the rise in inflation, leading to widespread falls in real wages. In Q1 2023, nominal year-on-year wage growth exceeded its pre-crisis level in nearly all OECD countries, reaching 5.6% on average across the 34 countries with data available (Figure 1.15, Panel A).17 However, nominal wage growth fell short of inflation by -3.8%, on average, with negative differences observed in 30 countries.18 19
Note: Real wage growth is calculated by subtracting consumer price index (CPI) inflation (all items) from nominal wage growth. OECD is an unweighted average of the countries shown above. *The latest year-on-year change refers to Q4 2022 (Greece). †The composition of industries is not fixed for Israel, Korea and the United Kingdom, and thus comparing these results with the others requires caution. ‡Additional sources of compositional shifts, such as regions (Australia, Canada, New Zealand), job characteristics and workers’ characteristics (Australia, New Zealand), gender (Switzerland) and occupations (United States) are controlled for. For Israel, the average monthly wages per employee job are used. For the United Kingdom, average weekly earnings are used. Moreover, wages in the public sector are excluded for Australia, Canada, Costa Rica, Japan, Korea, Mexico, New Zealand, the United Kingdom and the United States.
Source: The wages and salaries component of the labour cost index by NACE Rev. 2 activity (Eurostat), Wage Price Index (Australian Bureau of Statistics), Fixed weighted index of average hourly earnings for all employees (Statistics Canada), OECD calculations based on Encuesta Continua de Empleo (Instituto Nacional de Estadística y Censos, Costa Rica), Wages and Employment Monthly Statistics (Israeli Central Bureau of Statistics), OECD calculations based on Monthly Labour Survey (Japanese Ministry of Health, Labour and Welfare), Labour Force Survey at Establishments (Korean Ministry of Employment and Labour), OECD calculations based on Encuesta Nacional de Ocupación y Empleo, Encuesta Telefónica de Ocupación y Empleo, Encuesta Nacional de Ocupación y Empleo Nueva Edición (Instituto Nacional de Estadística y Geografía, Mexico), Labour Cost Index (Statistics New Zealand), Swiss Wage Index (Swiss Federal Statistical Office), Monthly Wages and Salaries Survey (UK Office for National Statistics), and Employment Cost Index (U.S. Bureau of Labor Statistics, retrieved from FRED); OECD (2023), “Prices: Consumer prices”, Main Economic Indicators (database), https://doi.org/10.1787/0f2e8000-en (accessed on 23 June 2023).
Inflation has now exceeded nominal wage growth for several quarters in most countries. As a result, at the end of 2022, real wages were below their Q4 2019 level by an average of -2.2% in 24 of the 34 OECD countries with available data (Figure 1.15, Panel B).20 Even in the remaining 10 countries, however, inflation had eroded most of the nominal wage growth.
The evolution over the past year (leading up to Q1 2023) shows no clear sign of substantial acceleration of nominal wage growth across countries – with the dynamics of real wages still largely driven by inflation instead (Annex Figure 1.A.3). Data for April or May 2023 are only available for a limited number of OECD countries and, along with data from wages advertised in online job postings, point to a narrowing (or even closing in some countries) of the gap between nominal wage growth and inflation. This is mostly because of steady nominal wage growth and declining inflation (see Box 1.2).
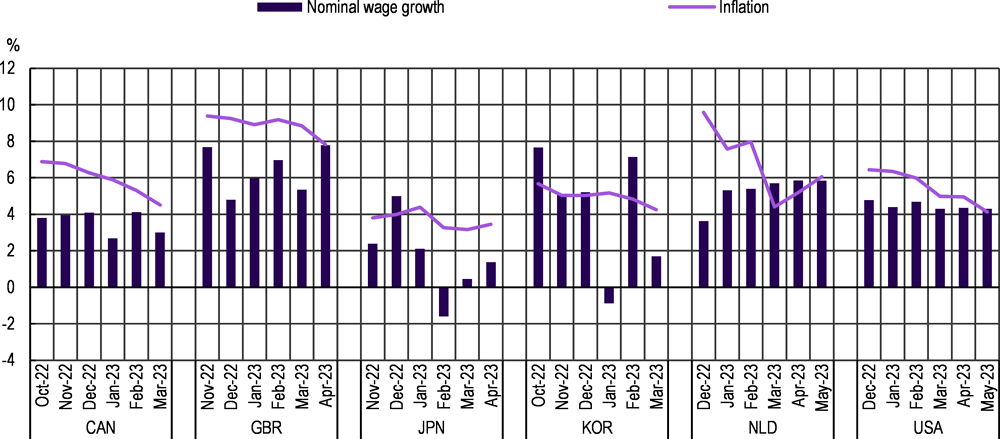
Recent data on wages for five OECD countries mostly point to a narrowing of the gap between nominal wage growth and inflation (Figure 1.16). In fact, the latest data suggest that the fall in real wages might have come to an end in the United Kingdom, the United States and the Netherlands. This is mostly driven by a deceleration of inflation rather than an acceleration of nominal wage growth. In the United Kingdom, however, nominal wage growth was particularly robust in April 2023, reaching a high of just under 8%. In Canada and Japan, however, the latest year-on-year nominal wage growth remains below inflation, while in Korea it exhibits considerable short-term variation.
Note: The wage measures used above do not include the public sector and are not harmonised across countries: fixed weighted index of average hourly earnings for Canada; average weekly earnings – private sector level – seasonally adjusted total pay excluding arrears for the United Kingdom; total hourly cash earnings (seasonally adjusted) for Japan; average hourly wages (seasonally adjusted) for Korea; collective labour agreement wages per hour including special remunerations for the Netherlands; and average hourly earnings of all employees (Total Private, seasonally adjusted) for the United States.
Source: Fixed weighted index of average hourly earnings for all employees (Statistics Canada), Monthly Wages and Salaries Survey (UK Office for National Statistics), Monthly Labour Survey (Japanese Ministry of Health, Labour and Welfare), Labour Force Survey at Establishments (Korean Ministry of Employment and Labour), and Current Employment Statistics (U.S. Bureau of Labor Statistics, retrieved from FRED); OECD (2023), “Prices: Consumer prices”, Main Economic Indicators (database), https://doi.org/10.1787/0f2e8000-en (accessed on 23 June 2023).
Nominal wage growth in online job postings is mostly steady in Europe and the United States, while inflation is slowly declining
Evidence from wages advertised in job posting on the online platform Indeed suggests a steady or declining nominal wage growth over the first five months of 2023 in Germany, France, Ireland, Italy and the United States (Figure 1.17). In Spain, the Netherlands, and – more markedly – the United Kingdom, nominal growth of posted wages has increased slightly. In general, the gap between inflation and nominal wage growth in posted wages (both measured here as 3-month moving averages) has becomes smaller. However, real growth in posted wages has turned positive only in Spain and the United States in recent months. In Italy, the gap between inflation and growth in posted wages increased again in May 2023, after declining for the first four months of the year.
Note: The posted wages are the average year-on-year percentage changes in wages and salaries advertised by job postings on Indeed.
Source: Indeed Wage Tracker (https://github.com/hiring-lab/indeed-wage-tracker); OECD (2023), “Prices: Consumer prices”, Main Economic Indicators (database), https://doi.org/10.1787/0f2e8000-en (accessed on 23 June 2023).
Real wages are falling across industries, but they are faring relatively better in low-pay industries in many countries
Wage dynamics could vary across the wage distribution due to factors such as labour demand, minimum wage laws, collective bargaining, and employer monopsony power. Since data on individual wages become available only with a significant lag for most countries, this section relies on wages by industry to provide some initial insights on how workers of different pay levels have fared in many OECD countries.
To offer an overview of wage developments by industry across countries, Figure 1.18 reports changes in real wages by industries aggregated in three broad groups: low-pay industries (accommodation and food services, administrative & support services, arts, entertainment and recreation, wholesale & retail trade); mid-pay industries (transportation and storage, manufacturing, other services, real estate activities, and construction); and high-pay industries (human health and social work, education, professional activities, information and communication, and finance and insurance). Industries are weighted by employment shares within each group.
Note: Real wage growth is calculated by subtracting consumer price index (CPI) inflation (all items) from nominal wage growth. OECD is an unweighted average of the countries shown. Low-pay industries include Accommodation & food service, Administrative & support service, Arts, entertainment & recreation and Wholesale & retail trade. Middle-pay industries include Transportation & storage, Manufacturing, Other service, Real estate activities and Construction. High-pay industries include Human health & social work, Education, Professional activities, Information & communication and Finance & insurance. Average employment shares by industry over the four quarters of 2019 are used for aggregation and thus small inconsistencies between changes in wages by industry and changes in average wages are possible. *The latest year-on-year change refers to Q4 2022 (Greece and the Netherlands). †There are missing industries: Arts, entertainment & recreation is not included for the United States; Human health & social work and Education are not included for France. ‡Average weekly earnings are used for the United Kingdom. Moreover, wages in the public sector are excluded for Australia, Japan, Korea, New Zealand, the United Kingdom and the United States.
Source: The wages and salaries component of labour cost index by NACE Rev. 2 activity (Eurostat), Wage Price Index (Australian Bureau of Statistics), Fixed weighted index of average hourly earnings for all employees (Statistics Canada), OECD calculations based on Encuesta Continua de Empleo (Instituto Nacional de Estadística y Censos, Costa Rica), Wages and Employment Monthly Statistics (Israeli Central Bureau of Statistics), OECD calculations based on Monthly Labour Survey (Japanese Ministry of Health, Labour and Welfare), Labour Force Survey at Establishments (Korean Ministry of Employment and Labour), OECD calculations based on Encuesta Nacional de Ocupación y Empleo, Encuesta Telefónica de Ocupación y Empleo, Encuesta Nacional de Ocupación y Empleo Nueva Edición (Instituto Nacional de Estadística y Geografía, Mexico), Labour Cost Index (Statistics New Zealand), Swiss Wage Index (Swiss Federal Statistical Office), Monthly Wages and Salaries Survey (UK Office for National Statistics), and Employment Cost Index (U.S. Bureau of Labor Statistics, retrieved from FRED); OECD (2023), “Prices: Consumer prices”, Main Economic Indicators (database), https://doi.org/10.1787/0f2e8000-en (accessed on 23 June 2023).
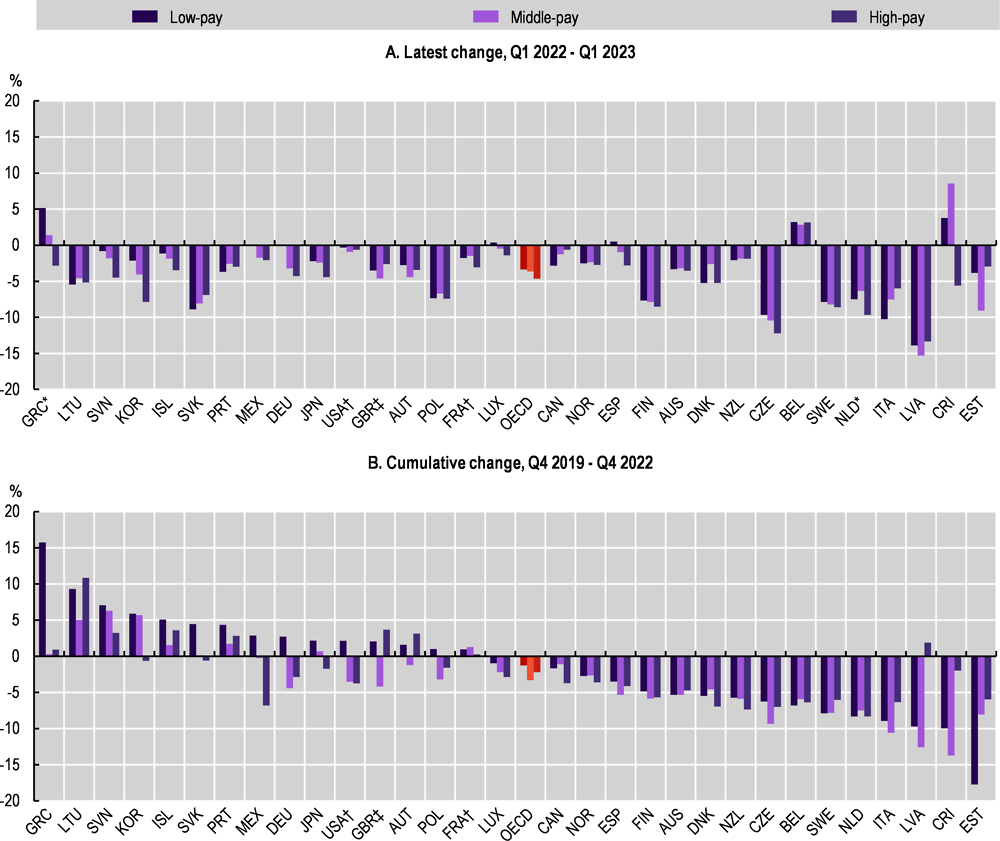
Real wages have declined across industries in almost all OECD countries, but workers in low-pay industries have often fared relatively better (Figure 1.18, Panel A).21 The latest year-on-year changes for Q1 2023 show that real wages performed better in low-pay industries than in both mid- and high-pay industries in 15 of the 31 countries with data available. Conversely, wages in low-pay industries had the worst performance only in six countries, losing more than 1 percentage point relative to both mid- and high-pay industries only in Canada and Italy. In the pair-wise comparison, real wages performed better in low-pay industries than in mid-pay ones in 18 countries, and better than in high-pay industries in 22 countries.
The pattern of relatively better wage performance in low-pay industries also holds when considering changes relative to pre-crisis levels – even if over this longer time horizon real wages declined in fewer countries and industries (Figure 1.18, Panel B). Between Q4 2019 and Q4 2022, real wages performed better in low-pay industries than in both high- and mid-pay ones in 16 of the 31 OECD countries with available data. Conversely, wages in low-pay industries fared worse than both the other two groups of industries only in four countries (Belgium, Estonia, the Netherlands and Sweden). In the pair-wise comparison, real wages performed better in low pay industries than in mid-pay ones in 23 countries, and better than in high-pay industries in 20 countries.
Tight labour markets have contributed to stronger nominal wage growth
Tentative evidence suggests that labour markets tightening has been associated with stronger wage growth at the industry level. A simple analysis correlating changes in real wages with changes in vacancy rates for 14 industries in 15 OECD countries suggests that – on a year-on-year basis – a 1% increase in the vacancy rates was associated with a 0.03% increase in real wages. The analysis provides some indication that the correlation between tightness and real wage growth might have been slightly stronger in low-pay industries, but the differences are not statistically significant. In addition, a simple extension of the exercise does not support the conclusion that differences in either the level of tightness or in its impact across (broad) industries can explain the relatively better performance of real wages in low-pay industries. Similarly, another extension of the analysis finds that increases in statutory minimum wages are associated with larger increases in average wages particularly in low-pay industries, but this difference does not explain the differentials in wage growth across industries (see Section 1.3. for a detailed discussion of minimum wage policies and adjustments across OECD countries in recent times).22
These findings might be at least in part the result of averaging across countries with very different institutional settings. Using more granular data from before the pandemic, Duval et al. (2022[13]) find that in the United Kingdom and the United States, the impact of a given increase in tightness on wage growth is at least twice as large in low-pay sectors as in the average industry. However, they acknowledge that the gap might be smaller in continental Europe because of binding and stickier statutory or collectively bargained minimum wages. Consistent with this observation, Hentzgen et al. (2023[23]) find no correlation across industries between recent changes in tightness and nominal wage growth in France, a country where both collective bargaining and the minimum wage play a significant role in wage setting (see Section 1.3). As for the effect of the minimum wage, Hentzgen et al. (2023[23]) find a clear correlation between recent increases in wages in an industry and the proportion of workers affected by increases in minimum wages in France, but Autor et al. (2023[16]) find no indication in the United States that wages at the bottom of the distribution increased more in states that increased their minimum wages recently.
The developments of wages by industry suggest a compression of wages across pay levels, but more granular data are needed to assess the impact of the real wage crisis on inequality
The results presented in this section indicate a trend of compression of wages across workers of different pay levels, as proxied by industry wages. For the few countries for which data on wages by education and occupations are already available, the picture is mixed, with an indication of compression of wages across both education and occupation groups in Costa Rica, Mexico and the United States, but not in Canada and in the United Kingdom (see Box 1.3).
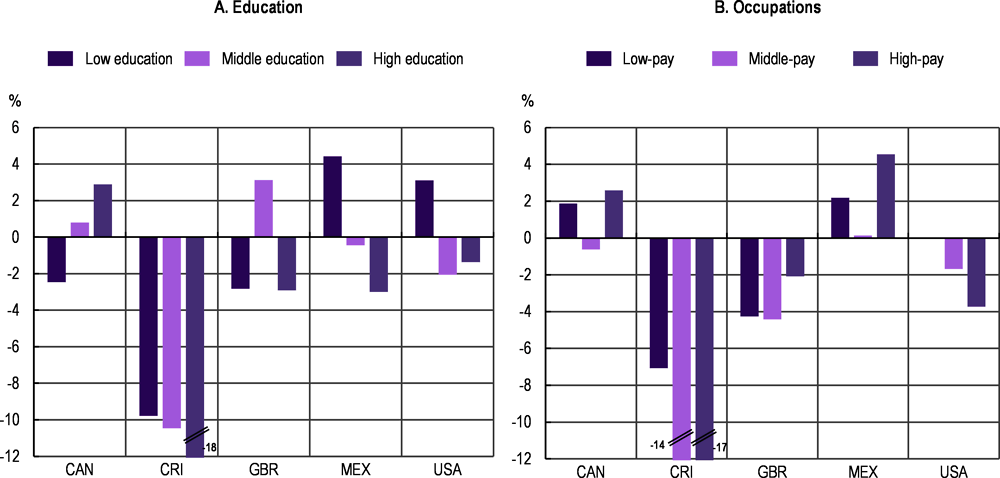
The main analysis in the chapter looks at wages by industry to provide evidence on wage dynamics across workers of different pay levels. For five countries, the analysis can be extended to look at changes in wages by education and occupation thanks to the timely availability of Labour Force Survey data. Figure 1.19 reports changes in real wages (calculated as the difference between nominal wage growth and inflation) for various groups between the end of 2019 and that of 2022. The results suggest a compression of wages across workers of different pay levels (as proxied by education and occupation) in Costa Rica, Mexico and the United States, but not in Canada and in the United Kingdom.
In Costa Rica and the United States, wages performed better among the low educated and workers in low-pay occupations (Figure 1.19). In Costa Rica, real wages fell across the board but much less among workers of low education and workers in low-pay jobs. In the United States, workers with low education and those in low-pay occupations were the only ones that avoided a real wage contraction between Q4 2019 and Q4 2022.
Note: The classification of pay levels by occupation is determined by identifying the top/middle/bottom tercile of employed population based on the ranking of average hourly wages according to a national classification of occupations in each country. The level of education is classified as follows: low (ISCED 0-2), middle (ISCED 3-4) and high (ISCED 5-8). Real wage growth is calculated by subtracting consumer price index (CPI) inflation (all items) from nominal wage growth.
Source: OECD calculations based on the Labour Force Survey (Statistics Canada), Encuesta Continua de Empleo (Instituto Nacional de Estadística y Censos, Costa Rica), Labour Force Survey (UK Office for National Statistics), Encuesta Nacional de Ocupación y Empleo, Encuesta Telefónica de Ocupación y Empleo, Encuesta Nacional de Ocupación y Empleo Nueva Edición (Instituto Nacional de Estadística y Geografía, Mexico) and Current Population Survey (U.S. Bureau of Labor Statistics). OECD (2023), “Prices: Consumer prices”, Main Economic Indicators (database), https://doi.org/10.1787/0f2e8000-en (accessed on 23 June 2023).
In Canada, Mexico and the United Kingdom, however, there is no clear sign of a compression of wages across groups of different pay levels, with results varying depending on whether education or occupations are considered. In Canada, workers with low education are the only ones to have experienced a fall in real wages since the start of the crisis (by -2.5%), but workers in low-pay occupations have seen better wage performance than those in middle-pay occupations (Figure 1.19). In Mexico, wage differentials by education have compressed, as the low-educated are the only group that experienced real wage growth. However, at the same time, wages have grown more for workers in high-pay occupations than in low-pay occupations. In the United Kingdom, the low-educated saw a decline in real wages of -3%, similar to that of high-educated workers, while real wages of mid-educated workers increased by 3%. Workers in low-pay occupations experienced a decline in real wages like those in mid-pay ones, while workers in high-pay occupations saw a smaller fall in real wages.
While informative of a widespread trend across OECD countries, these results do not allow strong conclusions on how the current wage crisis is affecting wage inequality more broadly. More granular data on wages are necessary to assess changes across the wage distribution and conduct a more reliable analysis of their determinants. Because of the paucity and the delay of this type of data, however, there is currently very limited evidence even on individual countries, with data pointing to a compression of the wage distribution in the United States but not in the United Kingdom.
For the United States, Autor et al. (2023[16]) document a remarkable compression of the wage distribution in 2021-22 which counteracted one-quarter of the four-decade increase in aggregate inequality between the 10th and 90th percentile. They find that the pandemic increased the elasticity of labour supply to firms in the low-wage labour market, reducing employer market power and spurring rapid wage growth at the bottom. Among the factors they discuss that might have contributed to this change is a decrease in work-firm attachment spurred by the large number of separations that occurred during the pandemic. By contrast, in the United Kingdom, gross hourly earnings of employees at the bottom and at the top of the distribution have grown in similar ways between the last quarter of 2019 and the last quarter of 2022, with slightly larger growth in the top decile than in the bottom one over the last year.23
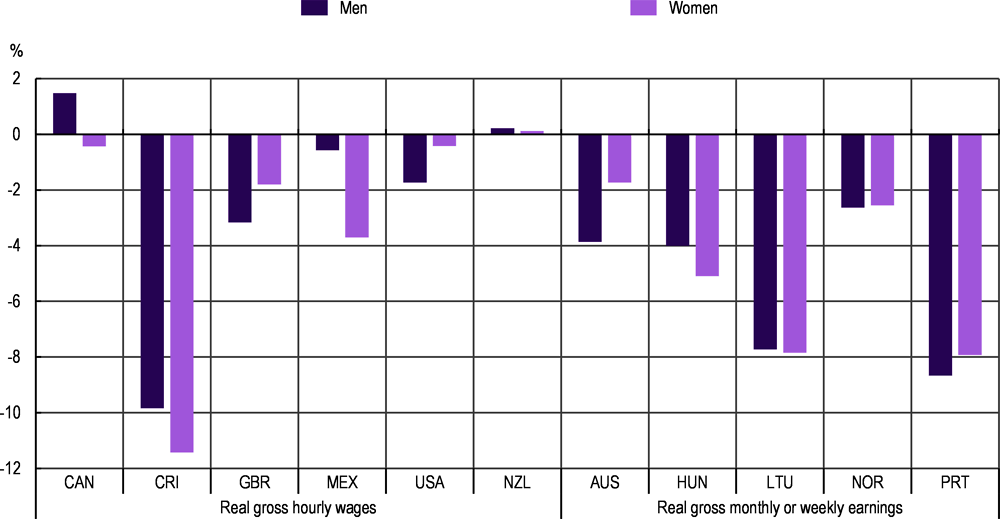
The cost-of-living crisis could affect men and women in different ways if wage dynamics differ substantially across industries and occupations with different gender composition. However, the limited data currently available show no systematic gender differences in the evolution in real wages across countries (Figure 1.20). In four of the 11 countries with data available for Q4 2022, men experienced larger year-on-year declines in real wages than women, with the largest differential in Australia and the United Kingdom where real wages for men fell by at least 3%. In four other countries, men fared better than women on average – with the largest difference in Mexico, where real wages for women fell by more than 3% against less than 1% for men. In the remaining three countries (Lithuania, Norway and New Zealand), year-on-year changes in real wages were similar between the two genders.
Note: Gross monthly earnings for Lithuania and Norway. Gross weekly earnings for New Zealand. Net monthly wages for Portugal. Quarterly cumulative gross earnings for Hungary. Real wage growth is calculated by subtracting consumer price index (CPI) inflation (all items) from nominal wage growth.
Source: OECD calculations based on the Labour Force Survey (Statistics Canada), Encuesta Continua de Empleo (Instituto Nacional de Estadística y Censos, Costa Rica), Labour Force Survey (UK Office for National Statistics), Encuesta Nacional de Ocupación y Empleo, Encuesta Telefónica de Ocupación y Empleo, Encuesta Nacional de Ocupación y Empleo Nueva Edición (Instituto Nacional de Estadística y Geografía, Mexico) and Current Population Survey (U.S. Bureau of Labor Statistics). Average gross earnings of full-time employees (Hungarian Central Statistical Office), Average Weekly Earnings (Australian Bureau of Statistics), Average monthly earnings (Statistic Lithuania, Official Statistics Portal), Average monthly earnings (Statistics Norway), Average Weekly Earnings (Statistics New Zealand), Net monthly mean wages (Statistics Portugal). OECD (2023), “Prices: Consumer prices”, Main Economic Indicators (database), https://doi.org/10.1787/0f2e8000-en (accessed on 23 June 2023).
1.2.3. In many OECD countries, profits have grown faster than wages, making an unusually large contribution to price pressures and reducing the labour share
Over the last three years, labour costs per unit of real output (or unit labour costs) have increased in most OECD countries as growth in nominal wages has exceeded productivity growth (Figure 1.21).24 Profit margins, as measured by profits per unit of real output (or unit profits), also grew in most countries, indicating that – on aggregate – firms were able to increase prices beyond the increase in the cost of labour and other inputs.
In fact, in most countries, unit profits rose more than unit labour costs in 2021 and 2022. As a result, over the last two years, profits have made an unusually large contribution to domestic price pressures (Box 1.5) and the labour share (i.e. the part of national income allocated to wages and other labour-related compensation) has fallen in many OECD countries.25 Changes in real unit labour costs, i.e. the difference between changes in unit labour costs and changes in producers prices (i.e. GDP deflator) – offers a visualisation of the labour share changes. Real unit labour costs declined in 18 out of 29 countries with available data. Among the remaining countries, the largest increases in real unit labour costs took place in Portugal, the United Kingdom and Lithuania (Figure 1.21).26
The combination of rising unit labour costs and unit profits is relatively unusual as increases in one are often absorbed by a fall in the other (OECD, 2023[2]). Looking at historic evidence, one could have expected that the worsening of the terms of trade would have reduced profits (Arce and Koester, 2023[24]). The specific nature of the recovery from the COVID-19 crisis likely provided conditions particularly favourable to the expansion of profits margins.27 At the height of the COVID-19 crisis, in many countries, the fall in profit margins was mitigated by various forms of public support, including job retention schemes which subsidised labour hoarding to an unprecedented extent (European Central Bank, 2021[25]; OECD, 2021[26]). Unlike in previous recessions, production capacity was largely preserved during the pandemic-induced freezing of the economy. As economies re-opened, pent-up demand and large recovery plans bolstered aggregate demand and helped profits pick up quickly as supply-chain bottlenecks slowed down the expansion of supply. In a context with strong consumer demand and rapidly evolving inflation driven by external factors, firms might have had more room to increase prices simultaneously as they expected competitors to behave in the same way, while consumers might have been more prone to accept price increases given the inflationary context (Weber and Wasner, 2023[27]). In addition, some of the increases in prices might have also been in anticipation of future increases in input and labour costs (Glover, Mustre-del-Río and von Ende-Becker, 2023[28]). However, the recent decline in the cost of energy and other inputs along with downward price rigidity is likely to sustain profit margins at least in the near future (INSEE, 2023[29]; European Commission, 2023[30]).
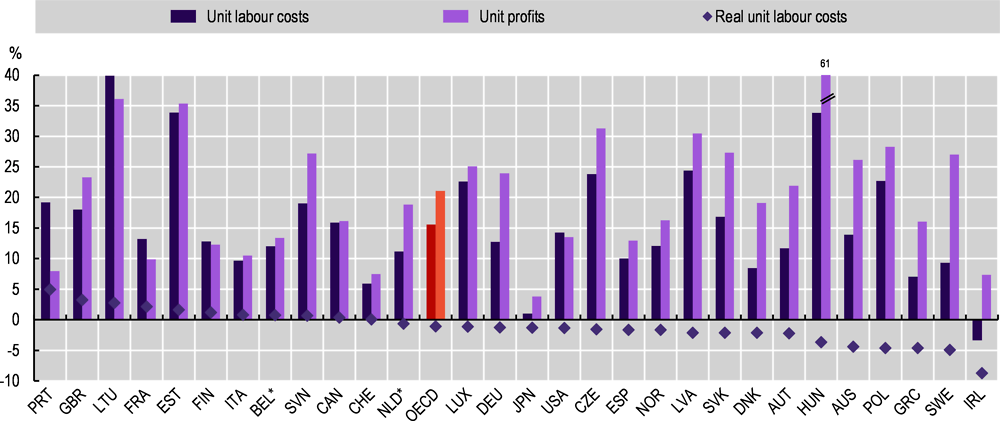
Note: OECD is an unweighted average of the countries shown above. *For Belgium and the Netherlands, changes refer to the period from Q4 2019 to Q4 2022. For Norway, the data are based on mainland Norway. Unit labour costs and unit profits are calculated by dividing compensation of employees, gross operating surplus, respectively, by real GDP. Real unit labour costs are calculated by dividing compensation of employees by nominal GDP, indicating the share of national income going to labour. For Japan and Norway, gross operating surplus is approximated by deducting nominal GDP from compensation of employees. Compensation of employees, gross operating surplus, gross domestic products and GDP deflators are denominated in local currencies.
Source: OECD Quarterly National Accounts: Volume and price indices – GDP Expenditure Approach, http://dotstat.oecd.org/Index.aspx?QueryId=120521; Quarterly National Accounts – Income Approach , http://dotstat.oecd.org/Index.aspx?QueryId=120186; National Accounts – Quarterly Estimates (The Cabinet Office of Japan); National Accounts – Tables 09190 and 09175 (Statistics Norway).
The initial surge in inflation was largely imported in many OECD countries and driven by commodity and energy prices. However, over the course of 2022, inflation became more broad-based with higher costs increasingly being passed through into the prices of domestic goods and services (OECD, 2022[1]). In addition to the increase in the costs of intermediate inputs, price dynamics are also influenced by changes in wages, profits, and taxes and subsidies. The analysis of this section shows that in recent quarters, both profits and labour costs have increased, with growth in profits exceeding growth in labour costs in many countries and sectors.
Figure 1.22 presents a decomposition of changes in the GDP deflator to gauge the contribution of wages, profits, and taxes to domestic price changes. Changes in the GDP deflator differ from consumer price inflation discussed in this section because the composition of household consumption underlying CPI-based measures of inflation is different from the composition of domestic output measured by GDP. Nevertheless, domestic price pressures are one of the main drivers of core inflation, i.e. inflation excluding energy and food (Arce and Koester, 2023[24]).
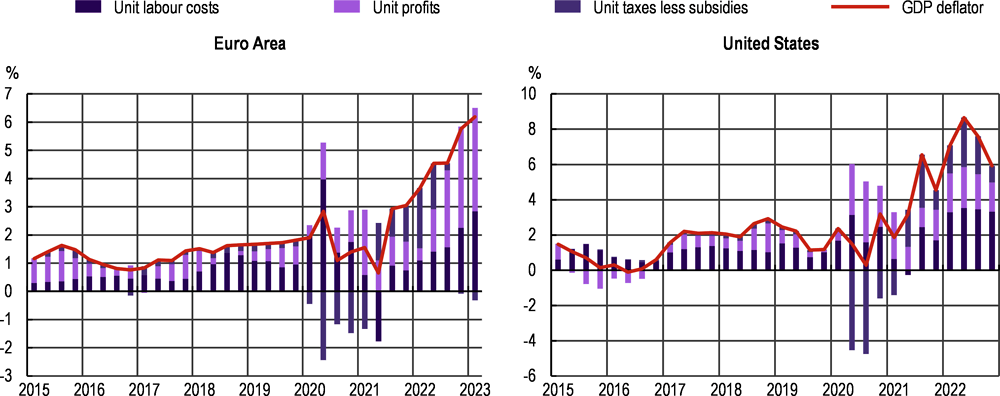
Note: Euro Area represents the average of 20 Eurozone countries. Unit labour costs, unit profits and unit taxes less subsidies are calculated by dividing compensation of employees, gross operating surplus and taxes less subsidies on productions and imports, respectively, by real GDP. For the United States, changes in the GDP deflator are reported net of statistical discrepancies. Data for Q1 2023 are not shown due to unusually large statistical discrepancies in the data available at the time of writing. Compensation of employees, gross operating surplus, taxes less subsidies on productions and imports, gross domestic products and deflators are denominated in local currencies.
Source: OECD Quarterly National Accounts: Volume and price indices – GDP Expenditure Approach, http://dotstat.oecd.org/Index.aspx?QueryId=120521; Quarterly National Accounts – Income Approach, http://dotstat.oecd.org/Index.aspx?QueryId=120186.
In the Euro Area and in the United States, both wages and profits have contributed to recent increases in domestic prices. In the Euro Area, the contribution of profits has been particularly large, accounting for most of the increase in domestic prices in the second half of 2022 and first quarter of 2023. This is in contrast with previous energy shocks, when increases in GDP deflator were mostly accounted for by changes in labour costs (Hansen, Toscani and Zhou, 2023[31]). In the United States, amid particularly tight labour markets, wages have generally contributed to increases in domestic prices more than profits in recent quarters. The recent contribution of profit margins was much larger than in the years before the crisis but has decreased in the most recent quarters. The differences between the Euro Area and the United States might in part reflect the fact that price dynamics have been more demand-driven in the latter (Hansen, Toscani and Zhou, 2023[31]). The contribution of unit taxes and subsidies has been particularly volatile over the period considered due to the introduction and withdrawal of pandemic-related subsidies as well as changes in the composition of household consumption (OECD, 2023[2]).
Data from Europe and Australia show that in the last year unit profits increased more than unit labour costs in several sectors beyond the energy one
Data from Europe and Australia show that the strong performance of profits in 2022 was not limited to the energy sector. In the year to Q1 2023, in Europe, unit profits increased more than unit labour costs in manufacturing, construction and finance, and grew at the same rate as unit labour cost in “accommodation food and transportation” (Figure 1.23). Similarly, unit profits increased more than unit labour costs in several sectors in Australia, including “accommodation and food”, manufacturing, trade, and transportation.
Going forward, this evidence suggests some room for profits to absorb further partial adjustments in wages without generating significant price pressures or resulting in a fall in labour demand. However, the implications of further increases in labour costs for prices, profits and labour demand can vary across firms depending on the competitiveness of the output market, the cost structure of the firm and the evolution of the business cycle. These factors can vary significantly even within the broad sectors referenced in Figure 1.23. Firms that have more market power or operate in non-tradable sectors are more likely to be able to increase prices.28 In contrast, firms operating in more competitive markets may have to absorb wage increases by reducing profits.
Rising costs of other inputs, such as energy, can also eat into profits and limit the ability to absorb some wage increases. Indeed, some of the increases in prices might have been in anticipation of further increases in input costs, as the energy shock works its way through the supply chain. Energy-intensive manufacturing may be particularly vulnerable to these cost pressures, but some service sectors – such as accommodation and food – are also relatively energy-intensive (European Commission, 2022[32]). The impact of the increase in input prices is likely to be more significant on small and medium firms in these sectors. However, given the downward rigidity of prices, the recent decline in input costs will also likely provide further room to absorb some wage increases without generating inflationary pressures. More broadly, firm profitability may be undermined in the short term by a fall in the demand due to the tightening of monetary policy and the erosion of purchasing power. In this context, rising labour costs might be more likely to translate into a reduction in labour demand and potential employment losses. All in all, while the evidence suggests room for profits to absorb some adjustments in wages in several sectors and countries, the exact room of manoeuvre will likely vary across sectors and type of firms.
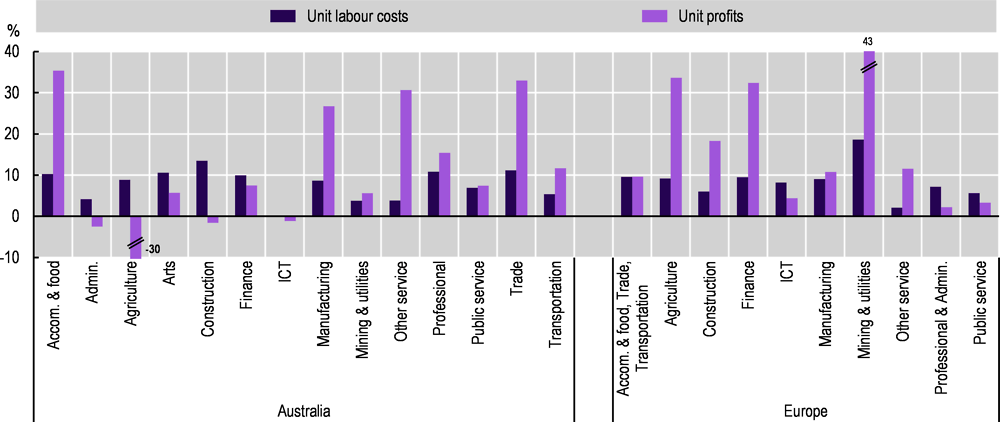
Note: Europe represents the unweighted averages of 19 European OECD countries: Austria, Belgium, the Czech Republic, Denmark, Spain, Estonia, Finland, Greece, Hungary, Ireland, Italy, Lithuania, Luxembourg, Latvia, the Netherlands, Portugal, the Slovak Republic, Slovenia and Sweden. Unit labour costs are calculated as the share of compensation of employees in gross value added (chain volume measures). For Australia, unit profits are calculated as the share of gross operating surplus and gross mixed income in gross value added (chain volume measures). For Europe, unit profits are calculated from the sum of gross operating surplus and taxes less subsidies on production and imports, which are the deduction of compensation of employees from gross value added (current prices). Compensation of employees, gross operating surplus, taxes less subsidies on production and imports, gross value added are based on local currencies.
Source: Australian National Accounts: National Income, Expenditure and Product – Table 6 & Table 45 (Australian Bureau of Statistics); Gross value added and income – A*10 industry breakdowns (Eurostat).
With no indication of a price-wage spiral in recent data, there is room to adjust wages at least for the most vulnerable
The quick rise of inflation over the past two years – that largely originated outside the labour market – raised the concern that it might set-off a price-wage spiral which could further undermine the purchasing power of those employed and even lead to significant employment losses. The evidence presented in this section, however, offers no indication of signs of a price-wage spiral so far. Nominal growth has picked up but it exhibits no clear signs of significant further acceleration across countries. The gap with inflation appears to be narrowing in recent months mostly because of a slow decline in inflation, but the erosion of real wages has not halted yet in the vast majority of OECD countries.
On balance therefore, the main problem going forward is a deepening of the cost-of-living crisis across the OECD. A gradual recovery of at least some of the recent losses in purchasing power is essential to prevent widespread increases in economic hardship especially among workers with low earnings. The analysis of this chapter suggests that, in several sectors and countries, there is room for profits to absorb some further increases in wages to mitigate the loss of purchasing power at least for the low paid without generating significant additional price pressures. Given the downward rigidity of prices, the recent decline in input costs will also likely provide further room to absorb some wage increases without generating inflationary pressures. A fair sharing of the cost of inflation can prevent further increases in inequality and support effective monetary policy by averting feedback loops between profits, wages and prices. The next section discusses policy options to tackle the cost-of living crisis while avoiding a price-wage spiral, focusing on wage setting institutions.
Several policy levers can be mobilised to limit the impact of inflation on workers and ensure a fair share of the costs between governments, companies, and workers. The most direct way to help workers is via an increase in their wages. Governments can take measures to increase their national statutory minimum wage to ensure that they maintain purchasing power for low-paid workers. They can also promote regular renegotiations of collective agreements − given the critical role of wage settings institutions in ensuring adequate wage increases, while avoiding a price-wage spiral − via a suitable regulatory framework as well as tailored fiscal incentives.
Beyond facilitating suitable adjustments of gross wages, governments can also provide direct support to net income more generally. Households and businesses can be compensated for the increase in prices via temporary price measures or via direct government transfers. Most OECD countries have for instance taken energy support measures between the end of 2021 and 2022, through price regulations, income support or tax reductions. Support to energy consumers was about 0.7% of GDP in the median OECD economy in 2022 but above 2% of GDP in some countries, especially in Europe. For the OECD area, similar levels of support are foreseen for 2023 (OECD, 2023[33]). However, only a fraction of the measures adopted in the last two years appears to be targeted to the most affected households and businesses (Figure 1.24). Ensuring that support measures are targeted and temporary is important to concentrate the support on those who need it most, preserve incentives for energy savings and avoid a persistent stimulus to demand at a time of high inflation (Hemmerlé et al., 2023[34]).
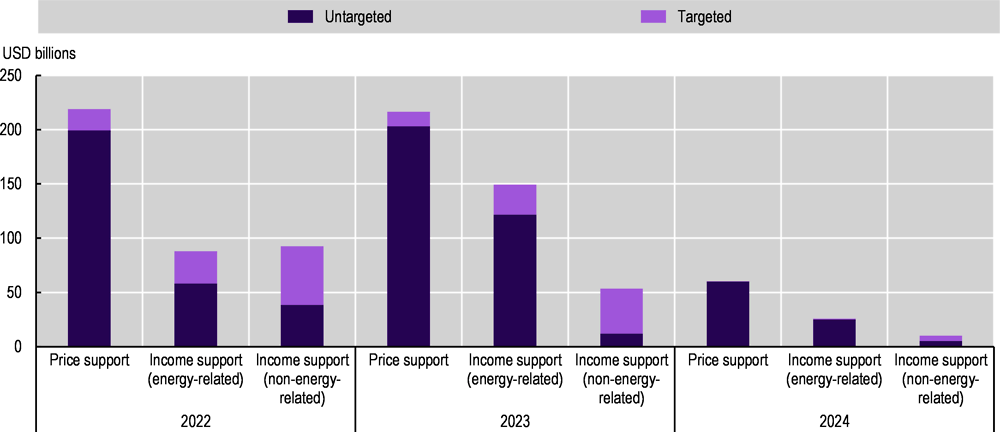
Note: Based on an aggregation of support measures in 41 countries, of which 35 are OECD economies (all members except Hungary, Iceland and Switzerland) and 6 are non-OECD economies (Brazil, Bulgaria, Croatia, India, Romania and South Africa). Support measures are taken in gross terms, i.e. not accounting for the effect of possible accompanying energy-related revenue-increasing measures, such as windfall profit taxes on energy companies. Where government plans have been announced but not legislated, they are incorporated if it is deemed clear that they will be implemented in a shape close to that announced. Measures classified as credit and equity support are not included. When a given measure spans more than one year, its total fiscal costs are assumed to be uniformly spread across months. For measures without an officially announced end-date, an expiry date is assumed and the fraction of the gross fiscal cost that pertains to 2022-24 has been retained. For Japan and Spain, it has been assumed that some existing measures will be extended further into 2023 or 2024, even though that extension has not been decided or announced by the authorities.
Source: OECD (2023[2]), OECD Economic Outlook, Volume 2023 Issue 1: Preliminary version, https://www.doi.org/10.1787/ce188438-en, based on the OECD Energy Support Measures Tracker.
Finally, on top of ad hoc measures to mitigate energy costs, the existing tax and benefits systems can also be used to cushion the shock on the most vulnerable workers through in-work benefits and other social transfers.
On the tax side, some governments, for instance, have taken measures to limit the effects of the so-called “fiscal drag” (i.e. when increases in wages result in larger tax burdens) – see Box 1.6 – and reduce the tax wedge as to increase net wages without affecting labour costs for firms. Austria and Germany, for instance, introduced the possibility for firms to pay tax-free inflation-compensation bonuses (i.e. lump-sum payments) up to EUR 3 000. France detaxed profit-sharing bonuses in 2022 and 2023 for workers earning less than three times the minimum wage. Italy increased the threshold for tax-free “fringe benefits”29 to EUR 3 000, up from EUR 600, for all workers.
On the benefit side, several targeted cash benefits that provide a safety net in case of turbulence, including high inflation, were already in place prior to the cost-of-living crisis (OECD, 2022[35]). Unlike price regulation and subsidies, income support maintains price signals that are needed for easing supply bottlenecks and rebalancing consumption towards greener energy sources. However, except for some forms of in-kind transfers and “social tariffs” for housing or other forms of committed expenditures, such as utilities or public transport, most transfers are not immediately responsive to price shocks (e.g. social benefits do not increase when recipients face higher energy or food prices) as experienced by individual households. It is important therefore to ensure an effective and predictable support and that, despite rapidly changing price levels, transfers keep operating as they were intended to (OECD, 2022[35]).
Inflation not only erodes wages in real terms but can also increase the tax burden of workers via the so-called “fiscal drag” – i.e. the phenomenon whereby increases in wages result in larger tax burdens – meaning that workers could be doubly disadvantaged by inflation – see OECD (2022[35]) and OECD (2023[36]).
“Nominal” fiscal drag1 occurs when thresholds and tax brackets fail to fully adjust for inflation, resulting in workers being pushed into higher tax brackets. Inflation also reduces the real value of tax-free allowances, tax credits, and benefits. To the extent that these instruments target low-income workers, nominal fiscal drag can have a disproportionately large impact at the middle-to-lower end of the income distribution. Social security contributions are also affected by nominal fiscal drag, with impacts varying by income level. At the bottom end, fiscal drag will increase public revenues by lowering the real minimum earnings threshold for paying social security contributions. At the upper end, it will reduce revenues by reducing the value of contribution ceilings.
To mitigate “nominal” fiscal drag, countries can adjust personal income tax (PIT) systems, social security contributions (SSCs), and cash benefits in response to inflation. Some countries automatically adjust these parameters, while others use discretionary approaches. In 2022, in just under half of OECD countries, the PIT system is adjusted automatically, while for 21 countries the adjustments are discretionary (see Table 1.1). The majority of countries index SSCs and cash benefits2. Twelve countries adjust each of PIT, SSCs and benefits automatically, while ten adopt a discretionary approach to all three categories. The timing and modality of adjustment vary across countries: some use prices (CPI or other indices) while others use wages. Long delays in adjusting parameters and incomplete adjustments can contribute to discretionary measures, including pressures for untargeted solutions, and be particularly challenging for the most disadvantaged individuals (OECD, 2022[35]).
← 1. As opposed to “real” fiscal drag which occurs when wages grow in real terms, resulting in a worker’s tax burden increasing with the progressivity of the tax system.
← 2. The cash benefits analysed in this box are limited to those transfers that are contained in the OECD Taxing Wages models; the analysis may not cover all social protection benefits that a given country might provide.
The remainder of this section focuses on the role that minimum wages and collective bargaining have played so far in cushioning the costs of inflation partially drawing on a policy questionnaire that was addressed to OECD countries as well as trade unions and employers’ organisations through the Business@OECD (BIAC) and Trade Union Advisory Committee (TUAC) networks – see Box 1.7.
The analysis on minimum wages and collective bargaining in this chapter partially draws on the information provided by the responses to an OECD policy questionnaire that was circulated in January and February 2023 to Labour Ministries as well as to employer organisations and trade unions through the Business@OECD and TUAC networks across OECD countries. The information collected via the policy questionnaires has been complemented and cross-checked with other data sources at national and international level.
The questionnaire focused on i) the minimum wage uprating procedures (e.g. the frequency of updating, the use of indexation, etc.); ii) the special measures taken to speed up the increase of minimum wages since January 2022; iii) the renegotiation of collective agreements (e.g. frequency, indexation, ultra-activity, etc.); iv) the measures taken by governments to promote the renegotiation of collective agreements and protect wages from the increase in prices.
36 out of the 38 OECD countries have filled in the questionnaire as well as 18 employers’ organisations and 18 trade unions. If the rules change across geographical areas (states, provinces, prefectures, cantons, etc.), the information was reported using the largest area as a reference. Moreover, in the case of collective bargaining, if there are differences across sectors, the answers focused on what is applicable in the agreement that prevails for the manufacturing sector.
1.3.1. Minimum wages have kept pace with inflation
Currently, 30 out of 38 OECD countries have a national statutory minimum wage in place30 and minimum wages also exist in most non-OECD emerging economies. Statutory wage floors are the most direct policy lever governments have for influencing wage levels at the bottom of the distribution. Historically, minimum wages have been justified as a measure for: i) ensuring fair pay, ii) counterbalancing the negative effects of firms’ labour market power; iii) making work pay; iv) boosting tax revenue and/or tax compliance by limiting the scope of wage under-reporting.31
With the sharp rise in prices in most OECD countries hitting particularly the most vulnerable, low-income households, minimum wages have become an even more important tool to protect the standard of living of low-paid workers.32
Almost all OECD countries have taken measures to increase their minimum wages between January 2021 and May 2023, including special measures to speed up minimum wage adjustments in the current cost-of living crisis (see below). If minimum wages are keeping pace so far with inflation in many OECD countries, real wage gains may actually quickly vanish over time as inflation remains high as it happened in 2022 – see Figure 1.25 and trends for all OECD countries with a statutory minimum wage in Annex 1.C.
Some of the differences across OECD countries in the timing, frequency, and size of the nominal increases are linked to different uprating procedures (see Table 1.2). In most OECD countries, the minimum wage is adjusted annually with a usually short delay between the decision and the application. In other countries, the minimum wage is adjusted annually or biannually but with a slightly longer delay which may make a difference in times of high and/or rising inflation. Finally, in some countries, there is no regular adjustment, which may result in long delays and major losses in purchase power. In the United States, for instance, the federal minimum wage has not been increased since 2009 (while minimum wages at state and local level have been updated much more regularly).
The revision of minimum wages may be subject to government discretion or can take place automatically in case of indexation. In some OECD countries – notably, Belgium, Canada (since April 2022), Costa Rica, France, Israel, Luxembourg, the Netherlands and Poland – there is a form of automatic indexation mechanism for the minimum wage at national level (Table 1.3). But automatic indexation also exists for minimum wages at subnational level (e.g. in Canada, Switzerland and the United States). Indexation may then be anchored to wages or prices. Minimum wages are for instance indexed to negotiated wages (i.e. wages defined in collective agreements) in the Netherlands, and to average wages in Israel. Indexation to (past) prices is in places, instead, in Belgium, Canada, France33 and Luxembourg34 as well as nine provinces and territories in Canada, four cantons in Switzerland and 19 states and the District of Columbia in the United States.35 Furthermore, multiple increases can also take place in years of high inflation, as in Belgium, France and Luxembourg.36 Poland links its minimum wage to future price developments and corrects it ex post in case of differences between the forecasts and the realised rates. Finally, a few countries have a form of indexation that kicks in only if social partners fail to find an agreement (Colombia and the Slovak Republic).
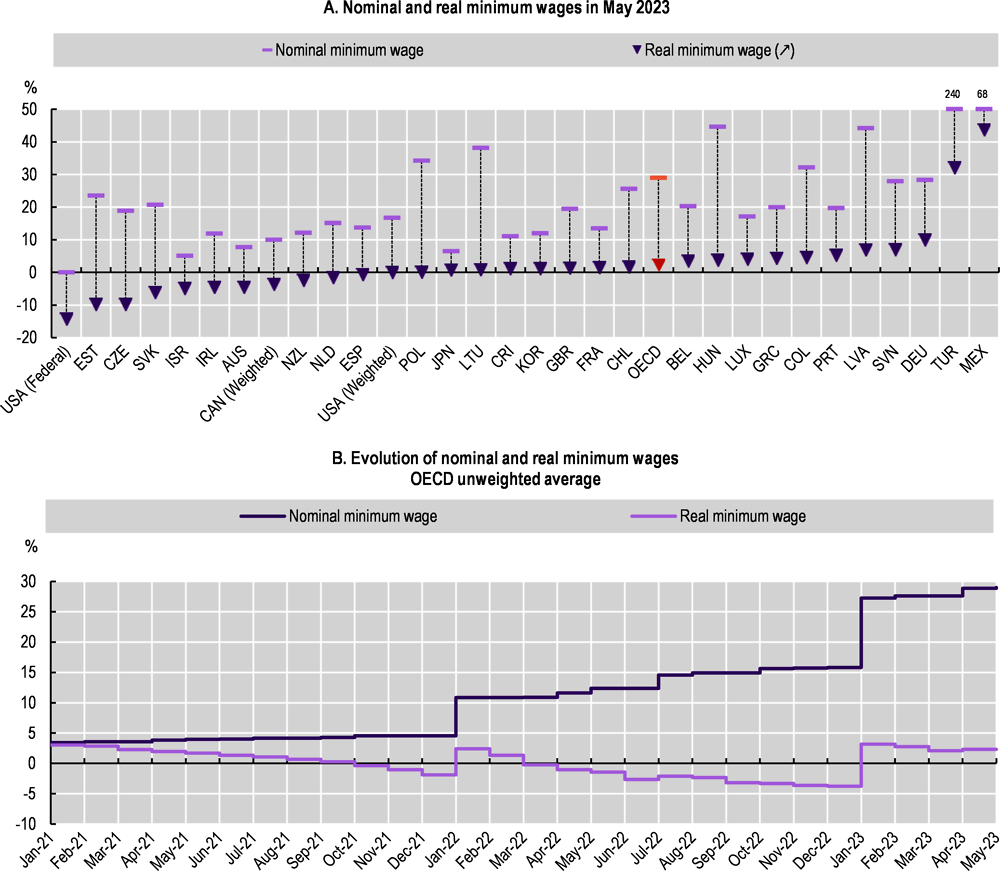
Note: Statistics refer to the cumulative percentage change in March 2023 relative to December 2020 for New Zealand. At date, statistics in Panel A, do not include planned increases in the minimum wage for Australia, the Netherlands, Poland and Türkiye in July 2023 (+8.7%, +3.1%, +3.2% and +34%, respectively). OECD is the unweighted average of all countries shown except the United States (weighted). Canada (weighted) is a Laspeyres index based on minimum wage of provinces and territories (excluding the Federal Jurisdiction) weighted by the share of employees of provinces and territories in 2019. United States (weighted) is a Laspeyres index based on minimum wage of states (not including territories like Puerto Rico or Guam) weighted by the share of nonfarm private employees by state in 2019. For further details on minimum wage series used in this Chart and evolution by country, see Annex Table 1.C.2 and Annex Figure 1.C.1.
Source: OECD Employment database, https://www.oecd.org/employment/emp/onlineoecdemploymentdatabase.htm, OECD (2023), “Prices: Consumer prices”, Main Economic Indicators (database), https://doi.org/10.1787/0f2e8000-en (accessed on 4 July 2023), and Monthly CPI Indicator (Australian Bureau of Statistics).
In other countries, discretionary measures have been taken over the last months to speed up the increase of minimum wages. In Chile, for instance, the minimum wage was increased three times in 2022 reflecting the increases in inflation. In Greece, after postponing the increase during the early phase of the COVID-19 pandemic, the government increased the minimum wage in January 2022 and then again in May 2022. In Türkiye, the minimum wage was increased by around 40% in January 2022 and nearly 30% in June 2022. In October 2022, Germany increased its minimum wage by 15%, from EUR 10.45 to EUR 12 per hour.37 Similarly, in the Netherlands, in October 2022, the government decided, for the first time since the introduction of the minimum wage in 1969, to go beyond the formula displayed above and exceptionally increase the minimum wage by 10% in January 2023. Ireland also announced in 2022 its intention to raise the minimum wage to 60% of the median by 2026, which would correspond to an increase of 16% compared to the current level. In Hungary, the social partners agreed to further increase the minimum wage mid-year if inflation rises to 18% and GDP growth is positive (Eurofound, 2023[37]).
These minimum wage increases, especially when linked to a formula that automatically indexed them to past inflation, are raising two main concerns: a squeezing of the wage distribution and the risk of a price-wage spiral, especially in case of high inflation and uncertainty. In fact, increases in minimum wages often have spillover effects higher in the wage distribution and can, therefore, have an aggregate effect on wage growth that goes well beyond the direct beneficiaries. This happens because minimum wages are used, formally or informally, as a benchmark in the negotiation of collective and individual wages as well as a reference for certain social minima.
Figure 1.26 estimates the impact of minimum wage increase to the growth in aggregate wages, accounting for both its direct effect (on those at or below the minimum wage) and its spillover effect (on those above the minimum wage). The impact of a 1% increase in the minimum wage is simulated using estimates of spillover effects from the literature and taking the share of the minimum wage earners in a baseline year (2018 for France and Germany, an average of 2019, 2021 and 2022 for the United Kingdom and 2022 for the United States) – see Box 1.8 for more details. This exercise suggests that a minimum wage increase of 1% can be expected to have an effect on aggregate wage growth between 0.03% (in the United States, using the share of minimum wage earners of state-level minimum wages) and 0.2% (in France). These estimates are in line with those of Koester and Wittekopf (2022[38]) who conducted a similar analysis with another data source and only including the direct effects.
These cross-country variations can be explained by the difference in the share of minimum wage earners, the magnitude of the spillover effects and the shape of the wage distribution. In France, where a relatively high proportion of workers earns the minimum wage (the share of minimum wage earners even increased since 2018 to 14% in 2022), a double automatic indexation of the minimum wage is in place and the wage distribution is relatively compressed, most of the aggregate wage effects come from wage increases higher up in the wage distribution (i.e. spillovers). On the opposite, in a country like the United States where the share of minimum wage earners is low (around 6% in 2022), spillovers are quite limited and the wage distribution is less compressed, most of the aggregate wage effects come from the increase in minimum wage earners (i.e. direct effects). Between these two polar cases, there are Germany where the share of minimum wage earners is relatively high (8.4% at the baseline in 2018) but the wage distribution is less compressed and the United Kingdom where the share of minimum wage earners (5.9% at the baseline) is similar to the United States but the wage distribution is more compressed.
These effects could be, nonetheless, somewhat underestimated. First, spillover effects could be stronger in a high inflation environment when minimum wage increases are larger and more frequent. Second, these estimates do not account for possible feedback loop on the minimum wage, notably in a country like France where the minimum wage is also indexed to half of the past increase of the real wage of blue-collar workers.38 However, the overall impact is likely to remain relatively limited in magnitude: even assuming a higher share of minimum wage earners (20%), Figure 1.26 shows that the aggregate wage effects range between 0.09% (in the United States) and 0.23% (in France) suggesting a rather limited risk of major impact on wage inflation of minimum wage increases.
On top of the effect of a minimum wage increase on aggregate wages, a second issue is how firms which employ minimum wage workers respond to increases in the minimum wage, and, in particular, if and how much these firms are able to pass higher wages onto prices. Most empirical studies agree that part of minimum wage increases is passed on to consumers – see e.g. Harasztosi and Lindner (2019[39]). However, Lindner (2022[40]) calculates that in the United Kingdom, an increase in the minimum wage of 20% would still only lead to an increase in inflation of 0.2% − which compared to the inflation rates observed in the last quarters is small.
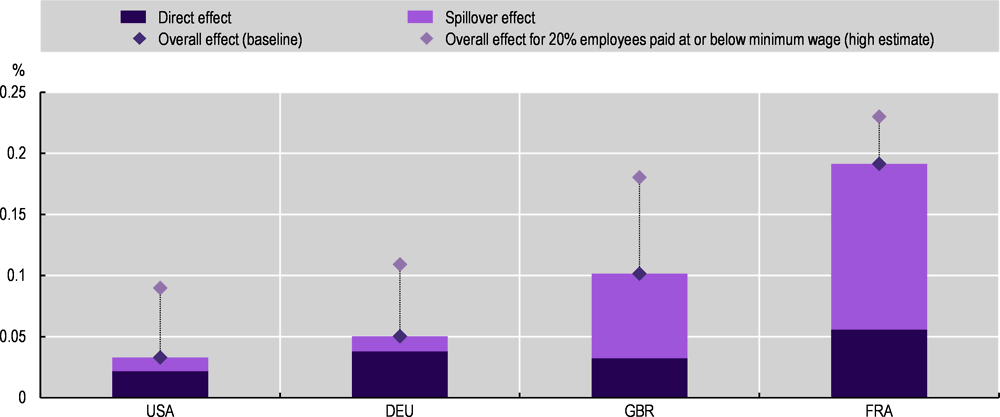
Note: The estimated impact of a minimum wage increase on aggregate wages is based on the share of employees paid at or below the minimum wage in 2018 for France and Germany (11% and 8.4% of employees, respectively), in 2019 and 2021-22 for the United Kingdom (5.9% of employees) and in 2022 for the United States (6% of employees). The high estimate corresponds to the estimated impact of raising the proportion of employees paid at or below the minimum wage to 20%.
The direct effect refers to the impact of a 1% increase in the minimum wage of employees paid at or below the minimum wage on the aggregate wage growth. The spillover effect estimates the impact of this increase for employees paid above the minimum wage on total wage bill through the estimated spillover coefficients based on empirical evidence for various academic studies – see Box 1.8. Note that these estimates do not account for possible feedback loop on the minimum wage, notably in a country like France where the minimum wage is also indexed to half of the past increase of the real wage of blue-collar workers.
Reading: In France, assuming the share of employees paid at or below the minimum wage at its 2018 level (11%), a 1% increase in the minimum wage would lead to a 0.06% increase in the total wage bill (direct effect). This increase in the minimum wage would also have a spillover effect on all earnings above the minimum wage, but in a lesser proportion (+0.2% for employees paid 1.2 times the minimum wage and +0.1% from 1.5 times the minimum wage onwards) through the adaptation of conventional wage scales, resulting in an increase of 0.14% of the total wage bill (spillover effect). In total, this increase would increase the total wage bill by 0.19%.
Source: OECD estimations based on the European Union Structure of Earnings Survey (EU-SES) scientific-use files (SUFs) for France and Germany, the UK Labour Force Survey for the United Kingdom and the Current Population Survey (CPS) for the United States.
In order to estimate the impact of an increase in the minimum wage on the total wage bill (henceforth, the “aggregate effect of minimum wage increases”), both the direct effect of a minimum wage increase, i.e. the wage increase for minimum wage earners, and the spillover effects, i.e. the wage increase for those employees earning more than the minimum wage as firms may have to readapt pay scales to maintain wage differentials, is calculated.
The direct effect is estimated by a 1% increase in hourly wages at, below or slightly above the minimum wage (threshold set at 105% of the minimum wage). For the employees at or below the threshold, the average hourly wage and the average number of hours worked are calculated using EU-SES (2018) for France and Germany, the UK-LFS (2019 and 2021-22) for the United Kingdom and the CPS (2022) for the United States. Using the information on hourly wages and hours, the total wage bill of the employees affected by an increase in the minimum wage is computed.
For the spillover effects, the same calculation is made for four wage bands expressed as a fraction of the minimum wage MW (1.05<MW≤1.2; 1.2<MW≤1.5; 1.5<MW≤2; MW>2) using spillover estimates from the literature (pre-dating the surge in inflation):
In France, building on the work by Gautier, Roux and Suarez Castillo (2022[41]) and Aeberhardt, Givord and Marbot (2012[42]), an increase in the minimum wage of 1% is assumed to lead to an increase of 0.2% in wages up to 1.2 times the minimum wage level; 0.1% between 1.2 and 1.5 times the minimum wage; 0.1% between 1.5 and 2 times the minimum wage, and 0 above.
In Germany, building on the work by Biewen, Fitzenberger and Rümmele (2022[43]), an increase in the minimum wage of 1% is assumed to lead to an increase of 0.02% in wages up to 1.2 times the minimum wage level, and 0 above.
In the United Kingdom, building on the work by Giupponi et al. (2022[44]), an increase in the minimum wage of 1% is assumed to lead to an increase of 0.02% in wages up to 1.2 times the minimum wage level, and 0 above.
In the United States, building on the work by Gopalan et al. (2021[45]), an increase in the minimum wage of 1% is assumed to lead to an increase of 0.03% in wages up to 1.2 times the minimum wage level; 0.03% between 1.2 and 1.5 the minimum wage, and 0 above.
Beyond the risk of a price-wage spiral, which is likely to be limited as just illustrated before, there are other aspects to consider in assessing the merits and pitfalls of regular and sustained minimum wage increases in times of high inflation, especially when linked to an automatic indexation to past price developments. On the one hand, these increases contribute to safeguard the purchasing power of minimum wage earners and may help to reduce in-work inequality (or at least limit its increase, in cases where high-wage workers are able to negotiate wage increases that keep pace with inflation while low-wage workers are not). Automatic indexation, more specifically, may also increase visibility and transparency for firms, which can more easily anticipate future increases,39 as opposed to discretionary increases. On the other hand, automatic indexation mechanisms may reduce the margins of judgement that governments, social partners or commissions have in deciding future increases (e.g. in a period of stagflation, decision-makers may have to weigh the risk of loss of purchasing power against the risk of job losses), limit the role of social partners in setting wages, and may also lead to an excessive compression of the wage distribution if the rest of the wage structure does not move, with consequences on individual careers, as well as on the design of redistribution policies.
While keeping these potential pitfalls in mind, in a context of high inflation, it remains important to ensure regular adjustments of statutory minimum wages to maintain their usefulness as a policy instrument and protect, at least partially, the most vulnerable workers from rising prices.
1.3.2. Negotiated wages: falling in real terms even in countries with high collective bargaining coverage
Collective bargaining: A tool to ensure fair and tailored responses to inflation cost
Statutory minimum wages only determine the wage floor. Above that floor, collective bargaining can play an important role in ensuring a fair share of the cost of inflation for a large share of the employees, in particular at the bottom and the middle of the wage distribution. Collective agreements can help companies and workers find tailored and ad hoc solutions to avoid a price-wage spiral, for instance by limiting (permanent) wage increases in exchange for lump-sums and/or non-wage benefits. Blanchard and Pisani-Ferry (2022[46]), for instance, argue that a forum in which trade unions, employers’ organisations and the government agree on how to share the burden of inflation would likely allow a fairer outcome and lower risk of second-round inflation (e.g. a pass-through of inflationary shocks on wages and prices, thereby triggering a price-wage spiral), making the job of monetary policy easier. Tripartite agreements, including on wages, were relatively common in the heydays of collective bargaining, but they are now very rare. However, the 2022 tripartite agreement on wages and competitiveness in Portugal shows how tripartite social dialogue can be revived to help ensuring a fair share of the costs of high inflation (see Box 1.9).
In October 2022, the government, four employer associations and the trade union UGT in Portugal signed a tripartite agreement on wages and competitiveness. The General Confederation of Portuguese Workers (CGTP-IN) did not sign the agreement, taking the view that wages should be subject of collective agreements alone.
The key goals of the pact are to increase the labour share (i.e. the part of national income allocated to wages and other labour-related compensation) by 3 percentage points compared to the pre-crisis value, to converge with the European average and to raise productivity growth to 2% by 2026.
To achieve these objectives the minimum wage will increase from EUR 760 in 2023 to EUR 900 in 2026. In parallel, several measures will be taken to boost workers’ income via the tax and benefit system. In particular, the personal income tax (IRS) brackets will be revised to avoid that pay rises to compensate for inflation lead to higher taxes – a phenomenon known as fiscal drag. In addition, the incentives to return to the labour market will be strengthened by allowing the partial accumulation of unemployment benefits with the wage. Moreover, overtime pay will be increased, and the severance pay in case of dismissal for economic reason (individual or collective) will increase to 14 days per year of tenure from 12 now.
Companies will be accompanied in this process: specific fiscal incentives are foreseen for those companies which have “dynamic” collective bargaining (i.e. they have a collective agreement less than three years old), which increase wages in line with or above the values set in the agreement and narrow the gap between the 10% best-paid workers and the 10% least-paid workers. Incentives are foreseen also for companies which increase R&D expenditure and on-the-job training and those who invest in the green transition.
The agreement also dedicates a section to youth employment, with provisions that span from a reduction in taxes to incentives to return from abroad. A new hiring incentive scheme for young workers to support open-ended contracts with wages above EUR 1 330 (and an additional “autonomisation” top-up) is included.
Finally, the last section of the tripartite agreement focuses on a simplification of the tax system and the licensing process.
The implementation of the agreement will be subject to a regular assessment by a dedicated working group which will be tasked notably to monitor the implementation of the measures, the progress towards the targets and the development in collective bargaining.
However, over the past decades, collective bargaining has been weakening (OECD, 2019[47]). On average, 15.8% of employees were members of a trade union in 2019, down from 33% in 1975. While this decline characterises a majority of countries, union density has been relatively stable since the mid-1970s in Canada, Korea and Norway, and has increased in Iceland and Belgium.
Declining union density has been accompanied by a reduction in the share of workers covered by a collective agreement, which has shrunk to 32.1% in 2020 from 46% in 1985 on average in OECD countries. This decline was strongest in Central and Eastern European countries, with steep decreases also observed in Australia, New Zealand (where, however, a recent reform has reintroduced a form of sectoral bargaining, see Box 1.10), the United Kingdom, and, more recently, Greece. Coverage has been relatively stable in most other European countries, except for Germany where it has decreased significantly since the reunification in 1990.
However, Figure 1.27 shows that wages negotiated in collective agreements between firms and workers have declined in real terms over the last quarters even in countries such as Austria, Finland, Italy, the Netherlands and Sweden where the large majority of employees is covered by a collective agreement.
New Zealand is the first OECD country to reintroduce a form of sectoral bargaining after eliminating it in 1990. In 2022, it passed the Fair Pay Agreements Act which allows unions and employers to bargain for minimum terms and conditions for all employees in that industry or occupation.
The process to negotiate a Fair Pay Agreement must start from a request of a union which has to demonstrate support from 1 000 workers, or 10% of workers, under potential coverage of an agreement. Workers can also request a Fair Pay Agreement by invoking the public interest, showing that employees in the sector are low paid and have little bargaining power at work or have a lack of pay progression at work or are not paid well enough when factors like working long hours, night shift, weekends or employment uncertainty (like short-term or seasonal work) are considered.
If the Ministry of Business, Innovation and Employment (MBIE) approves a union’s application to initiate bargaining for a proposed Fair Pay Agreement, an eligible employer association can apply to become an employer bargaining party. In case no employers’ representative has stepped forward after three months, the national employers’ association, BusinessNZ, has one further month to decide whether it will bargain on the employer side. If it does not choose to be an employer bargaining party, the MBIE will let the workers bargaining side know and the workers’ side has three months to apply for the Employment Relations Authority to set the terms of the Fair Pay Agreement. If this happens, the Employment Relations Authority will set terms without any bargaining.
The agreements must include specific topics, such as wages and overtime, while others such as safety and flexible working must be discussed but not necessarily included. Other employment terms can be included if the bargaining sides agree. The Fair Pay Agreements, as in all countries with a two-tier bargaining system, set a floor and bargaining at the firm/establishment level can set higher standards.
Once the bargaining sides agree, covered employees and employers can vote on whether they support the employment terms proposed and, if there is a majority (from both bargaining sides), the Fair Pay Agreement will be finalised and set as law, and noncompliance is a criminal act.
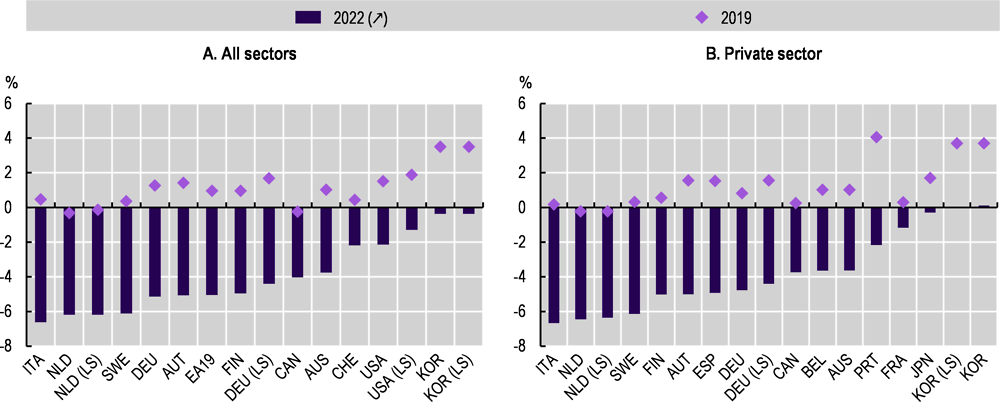
Note: LS: wages including lump sums and/or special payments.
International comparability of data on negotiated wages is affected by differences in definitions and measurement. For further details, see Annex Table 1.C.3. and Annex Table 1.C.4. Statistics are representative of all employees covered by a collective wage agreement for Austria, Belgium, the Euro Area (19), Finland, France, Germany, Italy, the Netherlands, and Sweden. In Canada, statistics refer to collective bargaining settlements of all bargaining units covering 500 or more employees (units of 100 or more employees for the Federal Jurisdiction). In Japan, figures refer to wage increase in major enterprises defined as those with a capital of 1 billion yen or more, 1 000 or more employees, and with a trade union, and, to workplaces with 100 or more full-time workers in Korea. In Switzerland, statistics refer to collective agreements containing wage provisions and with at least 1 500 employees subject to the collective bargaining agreement. For Australia, Canada, Korea, Portugal, Spain, Switzerland and the United States, statistics refer only to employees affected by an increase of the negotiated wage at date. Wage increases in Austria, Belgium, the Euro Area (19), Finland, Germany, Italy, the Netherlands and Sweden refers to the average increase in negotiated wages weighted by the employment composition for a reference year (Laspeyres index). The reference year of the employment composition used is 2005 for Finland, 2009 for Sweden, 2010 for Belgium and the Netherlands, January 2015 for the Euro Area, 2015 for Germany and Italy, and 2016 for Austria. For Australia, Canada, France, Japan, Korea, Portugal, Spain, Switzerland and the United States, wage increases refer to the average increase in negotiated wages weighted by the number of employees affected of the period considered. Statistics for 2022 are provisional for Spain. Negotiated wage increases in Spain in 2022 refer only to the agreed wages not accounting for (retroactive) revisions from “wage guarantee clauses” expressed in the text of the agreements. Private sector in Germany refers to all industries excluding agriculture, public administration, education, health, and other personal services (Sections B to N of the NACE rev. 2).
Source: OECD calculations based on national data on negotiated wages and OECD (2023), “Prices: Consumer prices”, Main Economic Indicators (database), https://doi.org/10.1787/0f2e8000-en (accessed on 22 May 2023).
Negotiated wages are reacting with longer delay
Several factors may explain why negotiated wages have not kept up with inflation, even in countries where large shares of workers remain covered by collective bargaining.
First, the staggered and rather infrequent nature of wage bargaining means that negotiated wages do not adjust immediately and fully to unexpected price inflation. Across OECD countries, collective agreements are renewed on average every 12-24 months, in some cases more. Therefore, several collective agreements still reflect a pre-high inflation scenario.
In a few countries (e.g. Portugal, the Slovak Republic, Slovenia and Spain), the negotiations in certain sectors have been advanced in light of the sudden increase in prices. In others, in the face of very high economic uncertainty, social partners have opted to postpone the conclusion of the agreement to a later stage and reach a “bridge agreement” instead or to combine permanent wage increases with one-off payments. In some cases, one-off payments have been incentivised by the government. The first and most prominent of such “bridge agreements” is the one in the German chemical industry between the trade union IGBCE and the employer federation Bundesarbeitgeberverband Chemie (BAVC) which, in April 2022, agreed on a one-time payment of EUR 1 400 (USD 1 393) postponing talks on a formal wage increase until the autumn (Global Deal, 2022[48]).40 In 2022, the model of “bridge agreements” has been followed by several other companies in Europe, without necessarily involving the unions. These one-off payments have provided a first answer to the fall in real wages. Moreover, if high inflation eases over the coming years, they help to mitigate the risk of feedback loop of increasing wages on inflation. However, they do not constitute a structural solution since the loss of purchasing power due to the marked increase in inflation rates will be permanent unless future inflation rates become negative.
Second, while high bargaining coverage is often considered as a key indicator of social partners’ strength, it may not necessarily fully reflect workers’ bargaining power. In some countries, high coverage is reached through administrative extensions while unions do not systematically have the power to negotiate strong wage increases in all sectors. Moreover, in some countries, like Germany or Italy, the (de facto or de jure) possibility for companies to circumvent the sectoral agreement is a threat that weighs on the final outcomes. Finally, in some cases, workers are covered by collective agreements that have expired (the so called “ultra-activity”). While most provisions remain binding in such cases, wages are eroded in real terms.41
Third, while in a minority of countries and sectors, pay scales in collective agreements are indexed to inflation,42 for most employees the inflation measure retained for wage adjustment is generally forward-looking (i.e. based on forecasts), and excludes energy without any in-built catch-up phase (i.e. the catch-up must be negotiated and agreed with the employers) – see Table 1.5. In particular:
In Luxembourg, all wages are indexed (see previous section).
In Belgium, 98% of private-sector workers have their wages automatically indexed to inflation. The social partners freely determine on a sector-by-sector basis the regularity (quarterly, annually, etc.) and method of indexation (but still using the “health index” as a reference).
In Italy, collective agreements are indexed to the forecast harmonised consumer price index (HICP) net of the contribution of imported energy goods.43 Before the COVID-19 crisis, the forecasts were almost systematically above the realised value. In principle, this should have led to an ex-post reduction in negotiated wages, but it rarely occurred. However, wage increases were limited by the prolonged delays in the renewal of collective agreements. In the coming months, in the sectors with ex-post renegotiation clauses, which cover about 30% of the total wage bill (among the main ones, banking, wood industry and the metal sector), workers will see more significant wage increases in 2023 to compensate for the 4 percentage point difference between the forecast and realised HICP excluding energy (Banca d’Italia, 2022[49]).
In Spain, collective agreements can include indexation clauses. According to the Bank of Spain (Banco de España, 2022[50]), 45% of workers covered by a collective agreement had their negotiated wages indexed to inflation in 2023, up from 16.6% on average in 2014-21, but still lower than at the beginning of the 2000s, when 70% of workers with a collective agreement had such clause. There is no general rule, but according to the preliminary analysis of the Bank of Spain, collective agreements are indexed to the headline inflation index, therefore including energy.44 Most workers are covered by annual indexation clauses, but in some cases, there are multi-year indexation clauses. In that case, wage adjustments would be determined based on inflation dynamics over the full term of the collective agreement (which would help to smooth the impact of a temporary spike in inflation). Seventy-five percent of the clauses currently in force includes some caps or thresholds, i.e. the increase in inflation is not fully passed on to wages.
In other countries, such as Denmark, Germany or Sweden negotiated wages are generally not indexed to inflation, but collective agreements are regularly renegotiated and inflation dynamics are (at least, partially) accounted for even without a formal indexation mechanism.
In the OECD countries for which timely data are available, Figure 1.28 shows that, in 2022, despite the significant losses in purchasing power, there has not been a general increase in industrial disputes (strikes and lockouts) compared to the historically low levels observed in the decade before COVID-19. While data on strikes are not entirely comparable and should be interpreted with caution,1 they show that industrial disputes have increased significantly in Finland (an 8-fold increase compared to the average in 2010-19), in the United Kingdom (a quadruple increase compared to the average in 2010-19), in Denmark (work days lost doubled in 2022 compared to the average in 2010-19), in Belgium (one-third increase) and less so but still significantly in Australia (however, latest data shows industrial disputes in Australia have returned to near historic lows), Canada, Germany, Switzerland and the United States. On the opposite, in Ireland, Mexico and Spain the number of industrial disputes in 2022 has been lower than in the period 2010-19. More generally, apart from Belgium, Finland and the United Kingdom, industrial disputes in 2022 were far below the levels recorded in the 1990s. The large transfer put in place by governments as well as some restraint from trade union and concerns over job security may have contributed to limit strife and wage increases in the recent negotiations (European Commission, 2022[32]).
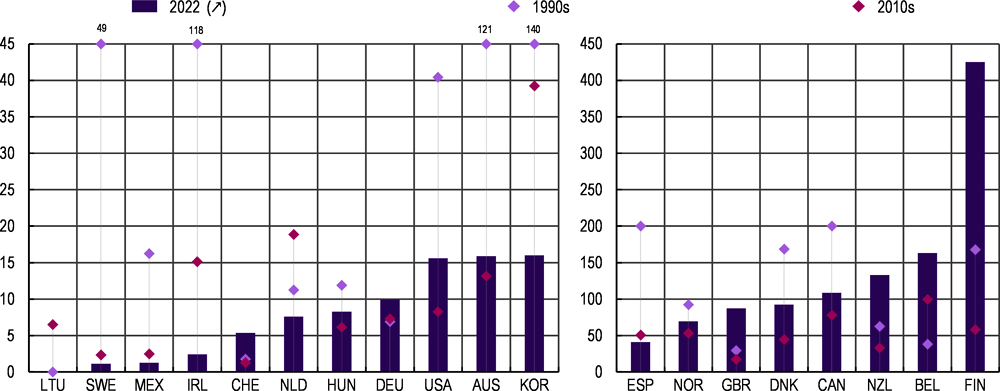
Note: International comparability of data on strikes is affected by differences in definitions and measurement. Belgium: Strikes in the public sector are excluded until 2002. Since 2003 strikes in the public sector are included except for strikes in the local and county administration and similar institutions and for sailors in the merchant marine and shipping industry. Since 2013 strikes in the local and country administration and similar institutions are also included. Mexico: The statistics concern strikes at establishments and enterprises covered by federal jurisdiction. As a result, strikes at enterprises under local jurisdiction are not included. The latest year available refers to June-Dec 2022 for the United Kingdom. 1990s and 2010s refer to the unweighted averages of workdays lost per 1 000 employees in 1990-99 and 2010-19, respectively.
Source: ILOSTAT and national statistical offices for working days not worked and OECD (2023), “Labour Force Statistics: Employment by activities and status”, OECD Employment and Labour Market Statistics (database), https://doi.org/10.1787/data-00289-en (accessed on 15 June 2023). and national statistical offices for total number of employees.
← 1. Data on industrial disputes should be interpreted with caution because differences in definitions and measurement severely limit the comparability of the data across countries (see for more information: https://www.oecd.org/els/emp/Industrial-disputes.pdf). Moreover, the number of strikes also reflects regulations at the national level and may thus not reflect the actual level of strife. For instance, in some countries, typically in the Nordic countries, it is not possible to strike in the presence of a valid agreement and, therefore, strikes and lockouts are possible only at the time moment of renegotiating the agreements.
Finally, and more generally, higher bargaining coverage is not necessarily associated with stronger aggregate wage growth, especially in times of crisis. As discussed in previous OECD work on collective bargaining (OECD, 2019[47]), collective bargaining can also serve as an instrument for wage adjustment and, hence, stabilisation over the business cycle. In countries where wage co-ordination is still strong (notably the Nordic countries as well as Austria, Belgium, Germany and the Netherlands) and to a lesser extent also in the other OECD countries with multi-employer bargaining, wages are negotiated taking into account the general macroeconomic situation, not just inflation, as well as the impact on competitiveness.
Recent bargaining rounds suggests that, after a catch-up phase, negotiated wage growth should go back to previous trends
Looking forward, the staggered nature of wage bargaining means that the adjustment of nominal wages to a sudden increase in inflation takes place over several years. Hence, as external pressures from energy prices and supply bottlenecks are decreasing, increases in negotiated wages may weigh more on price increases. A forward-looking experimental tracker of negotiated wage growth in Austria, France, Germany, Greece, Italy, the Netherlands and Spain developed by the ECB in co-operation with euro-area national central banks shows that collective agreements during 2022 have typically delivered a 4.7% increase for 2023, up from 4.4% in 2022 (Lane, 2023[51]). Outside the Euro Area, negotiated wages also increased in various countries:
In Denmark, a sectoral agreement was reached in the manufacturing sector in February granting an increase of 3.5% in 2023 and 3.4% in 2024 for minimum wage floors. The agreement, which serve as a reference for the rest of the economy, is valid for two years and extends until 1 March 2025, covering approximately 230 000 employees and around 6 000 companies.
In Norway, an agreement for a 5.2% increase for the frontline trade areas (exporting industry and manufacturing which set the benchmark for the rest of the economy) was reached in April after four days of strike.
In Sweden, industry unions and employers agreed on new collective agreements for two years, that include salary increases of 4.1% in the first year and 3.3% in the second year. This agreement sets the reference for the others (the so-called “cost mark”).
These higher-than-normal nominal wage increases largely reflect the catch-up process after the decline in real wages since mid-2021. Meanwhile, as global energy and food prices decline, inflation is expected to continue to decline (OECD, 2023[33]). Mechanically, wages can be expected to become an increasingly dominant factor in underlying inflation in the near future.45 However, most agreements already foresee a deceleration in 2024 suggesting that after a catch-up phase of relatively higher nominal negotiated wage increases nominal negotiated wage growth should go back to previous trends without generating a price-wage spiral. Overall, nominal wage growth is projected to be just over 4% in the OECD area in 2023, before moderating to around 3.5% in 2024 (OECD, 2023[33]).
Labour markets in the OECD area have largely proved resilient to the slowdown in economic growth that took place since the onset of Russia’s war of aggression against Ukraine, as total employment stabilised and unemployment rates generally remained below their pre-pandemic levels. The first months of 2023 have shown signs of improvement in economic growth which is however projected to remain subdued over the next two years.
Against this backdrop, a cost-of-living crisis has taken hold, as the energy shock caused by the war in Ukraine contributed to propelling price inflation to levels not seen in decades in many countries. Despite a pick-up in nominal wage growth amid tight labour markets, real wages have fallen in virtually every industry and OECD country, often considerably.
Overall, there is no indication of a price-wage spiral, while the main risk going forward is a deepening of the cost-of-living crisis across the OECD. Indeed, even as inflation has been decelerating in most OECD countries, nominal wage growth is still trailing behind and thus real wages continue to fall.
Monetary policy should continue to pursue price stabilisation to bring inflation under control and prevent further erosion of real wages and living standards. Fiscal and wage policies can support monetary policy to achieve these objectives and ensure a fair distribution of the cost of inflation. Through fiscal support, most OECD governments have helped cushion the immediate impact of the cost-of-living crisis on household finances often at a sizeable cost for public finances (OECD, 2023[2]). This support should now become more targeted to vulnerable households to avoid turning into a permanent stimulus to demand and further fuelling price increases. In addition, wage setting institutions – minimum wage and collective bargaining – are key to achieve sustainable wages increases and ensure a fair distribution of the cost of inflation between firms and workers, as well as among different groups of workers.
Fairly sharing the cost of inflation is essential to prevent further increases in income inequality and can support monetary policy in taming inflation. In fact, as argued by the President of the European Central Bank (Lagarde, 2023[52]), a fair split of the cost of inflation can prevent a “tit-for-tat” between profits and wages that can feed upward price spirals. From this perspective, the evidence of this chapter suggests that, in several sectors and countries, there are margins for profits to absorb wage increases to help recover some of the losses in purchasing power. Indeed, in many cases, profits have increased more than labour costs in recent quarters, making an unusually large contribution to domestic price pressures and leading to a fall in the labour share. Given the downward rigidity of prices, the recent decline in input costs will also likely provide further room to absorb some wage increases without generating inflationary pressures. However, firm’s ability to absorb wage increases varies, with small and medium firms, in particular, likely to face more significant constraints. Collective bargaining can help identify solutions tailored to sectors and firms’ varying ability to sustain further increase in wages.
Adjustments in nominal minimum wages have helped contain the impact of inflation on the purchasing power of low-paid workers. Going forward, statutory minimum wages should continue to adjust regularly. The analysis shown in this chapter suggests that the risk of further fuelling inflation by increasing minimum wages is limited. However, countries will need to assess carefully the risk that the sole increase of minimum wage − without increases higher up in the wage distribution – may lead to excessive compression of the wage distribution, with negative impact on individual careers and implications for designing redistribution policies.
Collective bargaining can play an important role in allowing some wage adjustment that ensure an equitable distribution of the cost of inflation between workers and employers and across workers of different pay levels. As new bargaining rounds take place, wages negotiated between trade unions and employers are now starting to adjust. Where renegotiations are not taking place, governments can help promote regular renegotiation of collective agreements. In addition, social dialogue and tripartite agreements between governments, workers, and firms, may also offer a platform for a fair sharing of the cost of inflation, and facilitate the job of monetary policy.
Going forward, the focus should be on wages regaining some of the lost purchasing power gradually over an extended period of time, as quick and full recoveries of past inflation would most likely feed further inflation.
In the long run, sustained real wage gains can only be ensured through sustained productivity growth. It is therefore essential for OECD countries to deploy a wide range of labour market, skill, and competition policies to make the most of the opportunities afforded by new technological developments, such as Artificial Intelligence – whose potential impact on the labour market is discussed in the remainder of this volume.
References
[42] Aeberhardt, R., P. Givord and C. Marbot (2012), “Spillover Effect of the Minimum Wage in France: An Unconditional Quantile Regression Approach”, Série des documents de travail de la Direction des Études et Synthèses Économiques, Insee (Institut national de la statistique et des études économiques), Paris, https://www.insee.fr/en/statistiques/1380949.
[9] Agarwal, N. and J. Bishop (2022), “COVID-19 Health Risks and Labour Supply”, Bulletin, Reserve Bank of Australia, https://www.rba.gov.au/publications/bulletin/2022/mar/pdf/covid-19-health-risks-and-labour-supply.pdf.
[24] Arce, O. and G. Koester (2023), How tit-for-tat inflation can make everyone poorer, ECB Blog, https://www.ecb.europa.eu/press/blog/date/2023/html/ecb.blog.230330~00e522ecb5.en.html (accessed on 9 June 2023).
[19] Armillei, F. (2023), Le grandi dimissioni hanno precedenti, lavoce.info, https://lavoce.info/archives/99876/le-grandi-dimissioni-hanno-precedenti.
[58] Australian Bureau of Statistics (2021), “Unit labour costs”, Australian System of National Accounts: Concepts, Sources and Methods, https://www.abs.gov.au/statistics/detailed-methodology-information/concepts-sources-methods/australian-system-national-accounts-concepts-sources-and-methods/2020-21/chapter-20-analytical-measures/unit-labour-costs (accessed on 10 February 2023).
[16] Autor, D., A. Dube and A. McGrew (2023), The Unexpected Compression: Competition at Work in the Low Wage Labor Market, National Bureau of Economic Research, Cambridge, MA, https://doi.org/10.3386/w31010.
[49] Banca d’Italia (2022), Bollettino economico 3/2022, Banca d’Italia, Rome.
[50] Banco de España (2022), Economic Bulletin 3/2022, Banco de España, Madrid.
[61] Baudry, L., E. Gautier and S. Tarrieu (2023), Wage negotiations in a context of rising inflation, Banque de France, Paris.
[43] Biewen, M., B. Fitzenberger and M. Rümmele (2022), “Using Distribution Regression Differencein-Differences to Evaluate the Effects of a Minimum Wage Introduction on the Distribution of Hourly Wages and Hours Worked”, IZA DP, No. 15534, IZA, Bonn, https://docs.iza.org/dp15534.pdf.
[46] Blanchard, O. and J. Pisani-Ferry (2022), Fiscal support and monetary vigilance: Economic policy implications of the Russia-Ukraine war for the European Union, Peterson Institute for International Economics, Washington, DC.
[64] Bodnár, K. and J. Le Roux (2022), “Wage dynamics across euro area countries since the start of the pandemic”, ECB Economic Bulletin, Issue 8/2022, https://www.ecb.europa.eu/pub/economic-bulletin/focus/2023/html/ecb.ebbox202208_04~ece5feea7b.en.html (accessed on 27 February 2023).
[8] Botelho, V. and M. Weißler (2022), “COVID-19 and retirement decisions of older workers in the euro area”, Economic Bulletin Boxes, No. 6, European Central Bank.
[10] Carcillo, S., A. Hijzen and S. Thewissen (2023), “The limitations of overtime limits to reduce long working hours: Evidence from the 2018 to 2021 working time reform in Korea”, British Journal of Industrial Relations, https://doi.org/10.1111/bjir.12743.
[14] Carrillo-Tudela, C. et al. (2023), “Search and reallocation in the COVID-19 pandemic: Evidence from the UK”, Labour Economics, Vol. 81, p. 102328, https://doi.org/10.1016/j.labeco.2023.102328.
[20] Causa, O. et al. (2022), “A cost-of-living squeeze? Distributional implications of rising inflation”, OECD Economics Department Working Papers, No. 1744, OECD Publishing, Paris, https://doi.org/10.1787/4b7539a3-en.
[21] Charalampakis, E. et al. (2022), “The impact of the recent rise in inflation on low-income households”, Economic Bulletin Boxes, Vol. 7,, p. 4, https://EconPapers.repec.org/RePEc:ecb:ecbbox:2022:0007:4.
[59] Clemens, J. and M. Strain (2022), “Understanding “Wage Theft”: Evasion and avoidance responses to minimum wage increases”, Labour Economics, Vol. 79, pp. 1-27, https://doi.org/10.1016/j.labeco.2022.102285.
[62] Colonna, F., R. Torrini and E. Viviano (2023), “The proft share and firm mark-up: how to interpret them?”, Questioni di Economia e Finanza, No. 770, Banca d’Italia, Rome.
[66] Congressional Research Service (2023), State Minimum Wages: An Overview, U.S. Congress, Washington, DC.
[55] Dube, A. (2019), Impacts of minimum wages: review of the international evidence, HM Treasury, London.
[13] Duval, R. et al. (2022), “Labor Market Tightness in Advanced Economies”, Staff Discussion Notes, No. 2022/001, International Monetary Fund, Washington, DC.
[37] Eurofound (2023), Minimum wage hikes struggle to offset inflation, https://www.eurofound.europa.eu/publications/article/2023/minimum-wage-hikes-struggle-to-offset-inflation.
[11] European Central Bank (2023), “Economic, financial and monetary developments”, Economic Bulletin Issue 8/2022, https://www.ecb.europa.eu/pub/economic-bulletin/html/eb202208.en.html.
[25] European Central Bank (2021), “Economic and monetary developments”, Economic Bulletin Issue 2/2021, https://www.ecb.europa.eu/pub/economic-bulletin/html/eb202102.en.html.
[30] European Commission (2023), Spring 2023 Economic Forecast: An improved outlook amid persistent challenges, European Commission, https://economy-finance.ec.europa.eu/economic-forecast-and-surveys/economic-forecasts/spring-2023-economic-forecast-improved-outlook-amid-persistent-challenges_en.
[32] European Commission (2022), Labour market and wage developments in Europe: Annual review 2022, Publications Office of the European Union, https://data.europa.eu/doi/10.2767/128906.
[5] Faria-e-Castro, M. (2021), “The COVID Retirement Boom”, Economic Synopses, Vol. 2021/25, pp. 1-2, https://doi.org/10.20955/ES.2021.25.
[41] Gautier, E., S. Roux and M. Suarez Castillo (2022), “How do wage setting institutions affect wage rigidity? Evidence from French micro data”, Labour Economics, Vol. 78, p. 102232, https://doi.org/10.1016/j.labeco.2022.102232.
[44] Giupponi, G. et al. (2022), “The Employment and Distributional Impacts of Nationwide Minimum Wage Changes”, https://conference.iza.org/conference_files/LaborMarkets_2022/giupponi_g7905.pdf.
[48] Global Deal (2022), Bargaining under uncertainty, Global Deal, Paris, https://www.theglobaldeal.com/good-practices/igbce-chemical-industry-germany/IGBCE-chemical-industry.pdf.
[28] Glover, A., J. Mustre-del-Río and A. von Ende-Becker (2023), “How Much Have Record Corporate Profits Contributed to Recent Inflation?”, The Federal Reserve Bank of Kansas City Economic Review, https://doi.org/10.18651/er/v108n1glovermustredelriovonendebecker.
[45] Gopalan, R. et al. (2021), “State Minimum Wages, Employment, and Wage Spillovers: Evidence from Administrative Payroll Data”, Journal of Labor Economics, Vol. 39/3, pp. 673-707, https://doi.org/10.1086/711355.
[31] Hansen, N., F. Toscani and J. Zhou (2023), “Euro Area Inflation after the Pandemic and Energy Shock: Import Prices, Profits and Wages”, IMF Working Papers, No. 2023/131, International Monetary Fund, Washington, DC.
[39] Harasztosi, P. and A. Lindner (2019), “Who Pays for the Minimum Wage?”, American Economic Review, Vol. 109/8, pp. 2693-2727, https://doi.org/10.1257/aer.20171445.
[34] Hemmerlé, Y. et al. (2023), “Aiming better: Government support for households and firms during the energy crisis”, OECD Economic Policy Papers, No. 32, OECD Publishing, Paris, https://doi.org/10.1787/839e3ae1-en.
[15] Hensvik, L., T. Le Barbanchon and R. Rathelot (2021), “Job search during the COVID-19 crisis”, Journal of Public Economics, Vol. 194, p. 104349, https://doi.org/10.1016/j.jpubeco.2020.104349.
[23] Hentzgen, C. et al. (2023), “Quel effet de l’inflation sur la progression actuelle des salaires ?”, Direction de l’Animation de la recherche, des Études et des Statistiques (Dares), https://dares.travail-emploi.gouv.fr/publication/quel-effet-de-linflation-sur-la-progression-actuelle-des-salaires (accessed on 3 February 2023).
[17] Hobijn, B. (2022), ““Great Resignations” Are Common During Fast Recoveries”, FRBSF Economic Letter, Vol. 2022/08, pp. 1-06, https://ideas.repec.org/a/fip/fedfel/93909.html (accessed on 27 February 2023).
[56] Hobijn, B. and A. Şahin (2022), Missing Workers and Missing Jobs Since the Pandemic, National Bureau of Economic Research, Cambridge, MA, https://doi.org/10.3386/w30717.
[65] ILO/OECD (2015), The Labour Share in G20 Economies, Report prepared for the G20 Employment Working Group in Antalya, Turkey, 26-27 February 2015, OECD, Paris, https://www.oecd.org/g20/topics/employment-and-social-policy/The-Labour-Share-in-G20-Economies.pdf.
[29] INSEE (2023), “Growth is holding up, inflation too”, French Economic Outlook, INSEE.
[38] Koester, G. and D. Wittekopf (2022), “Minimum wages and their role for euro area wage growth”, ECB Economic Bulletin, Issue 3/2022, https://www.ecb.europa.eu/pub/economic-bulletin/focus/2022/html/ecb.ebbox202203_04~dd90d8dbde.en.html (accessed on 7 January 2023).
[52] Lagarde, C. (2023), The path ahead, Speech by Christine Lagarde, President of the ECB, at “The ECB and Its Watchers XXIII” conference.
[18] Lagouge, A., I. Ramajo and V. Barry (2022), La France vit-elle une “Grande démission” ?, https://dares.travail-emploi.gouv.fr/publication/la-france-vit-elle-une-grande-demission (accessed on 27 February 2023).
[51] Lane, P. (2023), Underlying inflation, Lecture by Philip R. Lane, Member of the Executive Board of the ECB, Trinity College Dublin.
[57] Lee, D., J. Park and Y. Shin (2023), Where Are the Workers? From Great Resignation to Quiet Quitting, National Bureau of Economic Research, Cambridge, MA, https://doi.org/10.3386/w30833.
[40] Lindner, A. (2022), It’s time to increase the National Living Wage to help with the cost of living, UCL Policy Lab.
[7] Murphy, L. and G. Thwaites (2023), Post-pandemic participation, Resolution Foundation, London.
[33] OECD (2023), OECD Economic Outlook, Interim Report March 2023: A Fragile Recovery, OECD Publishing, Paris, https://doi.org/10.1787/d14d49eb-en.
[2] OECD (2023), OECD Economic Outlook, Volume 2023 Issue 1: Preliminary version, OECD Publishing, Paris, https://doi.org/10.1787/ce188438-en.
[36] OECD (2023), Taxing Wages 2023: Indexation of Labour Taxation and Benefits in OECD Countries, OECD Publishing, Paris, https://doi.org/10.1787/8c99fa4d-en.
[35] OECD (2022), “Income support for working-age individuals and their families”, Coping with the cost of living crisis, OECD, Paris, https://www.oecd.org/social/Income-support-for-working-age-individuals-and-their-families.pdf.
[63] OECD (2022), “Minimum wages in times of rising inflation”, Coping with the cost of living crisis, OECD, Paris, https://www.oecd.org/employment/Minimum-wages-in-times-of-rising-inflation.pdf.
[1] OECD (2022), OECD Economic Outlook, Volume 2022 Issue 2, OECD Publishing, Paris, https://doi.org/10.1787/f6da2159-en.
[54] OECD (2022), OECD Employment Outlook 2022: Building Back More Inclusive Labour Markets, OECD Publishing, Paris, https://doi.org/10.1787/1bb305a6-en.
[26] OECD (2021), OECD Employment Outlook 2021: Navigating the COVID-19 Crisis and Recovery, OECD Publishing, Paris, https://doi.org/10.1787/5a700c4b-en.
[3] OECD (2020), OECD Employment Outlook 2020: Worker Security and the COVID-19 Crisis, OECD Publishing, Paris, https://doi.org/10.1787/1686c758-en.
[47] OECD (2019), Negotiating Our Way Up: Collective Bargaining in a Changing World of Work, OECD Publishing, Paris, https://doi.org/10.1787/1fd2da34-en.
[60] OECD (2018), Good Jobs for All in a Changing World of Work: The OECD Jobs Strategy, OECD Publishing, Paris, https://doi.org/10.1787/9789264308817-en.
[53] OECD (2012), OECD Employment Outlook 2012, OECD Publishing, Paris, https://doi.org/10.1787/empl_outlook-2012-en.
[12] Pizzinelli, C. and I. Shibata (2023), “Has COVID-19 induced labor market mismatch? Evidence from the US and the UK”, Labour Economics, Vol. 81, p. 102329, https://doi.org/10.1016/j.labeco.2023.102329.
[4] Salvatori, A. (2022), “A tale of two crises: Recent labour market developments across the OECD”, in OECD Employment Outlook 2022: Building Back More Inclusive Labour Markets, OECD Publishing, Paris, https://doi.org/10.1787/ddfa64a7-en.
[22] The German Council of Economic Experts (2022), Managing the Energy Crisis in Solidarity and Shaping the New Reality, The German Council of Economic Experts, Berlin.
[6] Thompson, D. (2022), Did COVID-19 Change Retirement Timing?, United States Census Bureau, https://www.census.gov/library/stories/2022/09/did-covid-19-change-retirement-timing.html (accessed on 25 February 2023).
[27] Weber, I. and E. Wasner (2023), “Sellers’ inflation, profits and conflict: why can large firms hike prices in an emergency?”, Review of Keynesian Economics, Vol. 11/2, pp. 183-213, https://doi.org/10.4337/roke.2023.02.05.
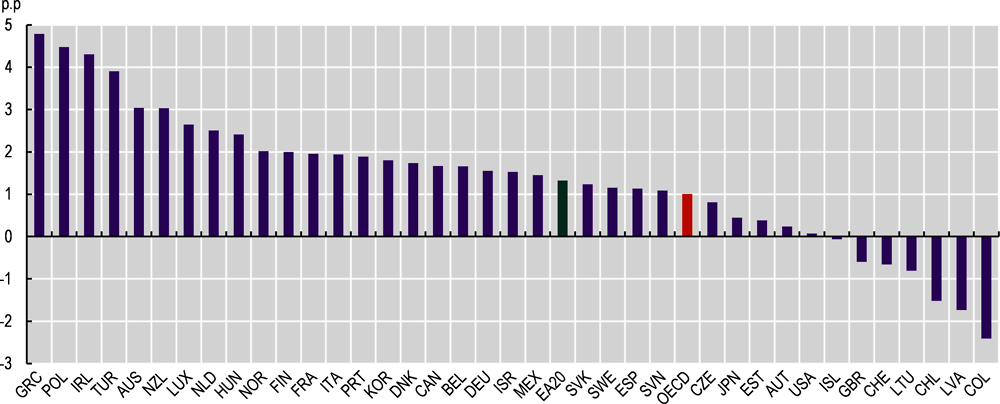
Note: Working age population includes all those aged 15 to 64. OECD is an unweighted average of the countries shown above. Euro Area refers to 20 Eurozone countries. p.p: percentage point.
Source: OECD (2023), “Labour: Labour market statistics”, Main Economic Indicators (database), https://doi.org/10.1787/data-00046-en (accessed on 28 June 2023).
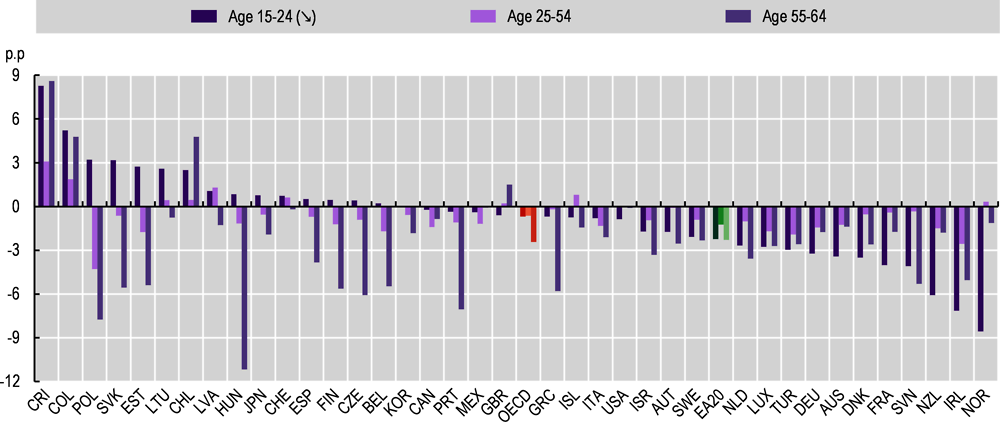
Note: OECD is an unweighted average of the countries shown above. Euro Area refers to 20 Eurozone countries. p.p: percentage point.
Source: OECD (2023), “Labour: Labour market statistics”, Main Economic Indicators (database), https://doi.org/10.1787/data-00046-en (accessed on 28 June 2023).
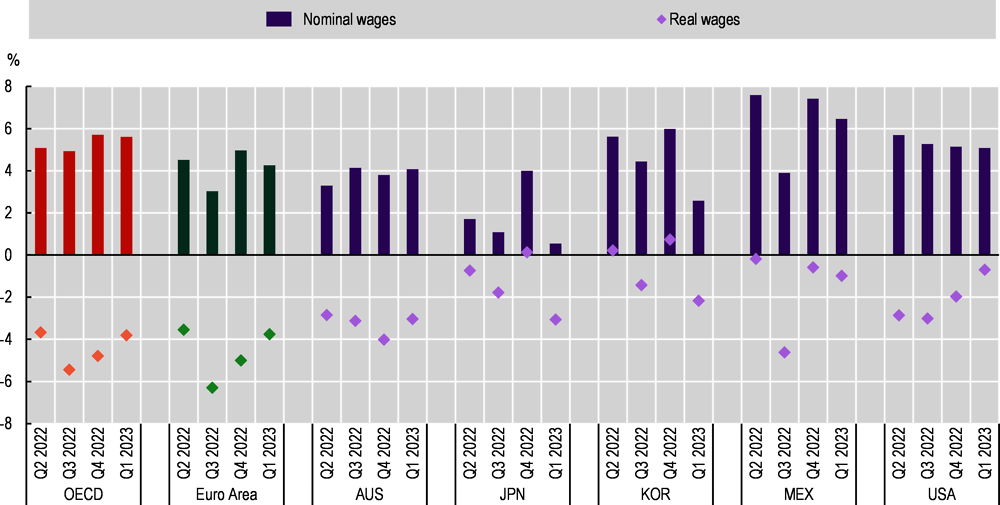
Note: Real wage growth is calculated by subtracting CPI inflation (all items) from nominal wage growth. OECD represents the unweighted average of 34 OECD countries. Euro Area represents the averages of 20 Eurozone countries. The composition of industries is not fixed for Korea, and thus comparing these results with the others requires caution. Additional sources of compositional shifts, such as regions (Australia), job characteristics and workers’ characteristics (Australia) and occupations (United States) are controlled for. Moreover, wages in the public sector are excluded for Australia, Japan, Korea, Mexico and the United States..
Source: The wages and salaries component of labour cost index by NACE Rev. 2 activity (Eurostat), Wage Price Index (Australian Bureau of Statistics), Fixed weighted index of average hourly earnings for all employees (Statistics Canada), OECD calculations based on Encuesta Continua de Empleo (Instituto Nacional de Estadística y Censos, Costa Rica), Wages and Employment Monthly Statistics (Israeli Central Bureau of Statistics), OECD calculations based on Monthly Labour Survey (Japanese Ministry of Health, Labour and Welfare), Labour Force Survey at Establishments (Korean Ministry of Employment and Labour), OECD calculations based on Encuesta Nacional de Ocupación y Empleo, Encuesta Telefónica de Ocupación y Empleo, Encuesta Nacional de Ocupación y Empleo Nueva Edición (Instituto Nacional de Estadística y Geografía, Mexico), Labour Cost Index (Statistics New Zealand), Swiss Wage Index (Swiss Federal Statistical Office), Monthly Wages and Salaries Survey (UK Office for National Statistics), and Employment Cost Index (U.S. Bureau of Labor Statistics, retrieved from FRED); OECD (2023), “Prices: Consumer prices”, Main Economic Indicators (database), https://doi.org/10.1787/0f2e8000-en (accessed on 23 June 2023).
Within the key information contained in online job postings (OJPs), employers often include different discretionary benefits for employees that helps attract the best talent by making their companies stand out from others offering similar positions. Employee benefits widely varies from health-related and retirement benefits to student loan support and workplace amenities (on-site gym, snacks/food provided, etc).
Using nearly 8 million OJPs advertised in Canada, the United Kingdom and the United States, this annex explores how mentions of different types of benefits changed between two specific months: December 2019 and December 2022. The first month represents the period right before the COVID-19 pandemic, which significantly affected labour markets across the world, while the latter is the month with the most updated data available. For this purpose, this section leverages the texts included in the OJPs and, since this data is not generally structured, it uses text mining techniques to identify and classify job postings in different categories of employee benefits.
The first step comprises the analysis of the texts available from OJPs advertised in the United Kingdom in December 2022 – more than 900 000 texts – to extract all possible combinations of two and three contiguous words (often called bigrams and trigrams), excluding stop words, numbers and punctuation. These combinations mitigate the risk of misclassifying OJPs when using single keywords that can be used in different contexts not related to employee benefits. For instance, the word “gym” can be located in the job title of postings seeking for gym trainers but also in the benefits section when a company is offering a “gym membership”. Typical words used in employee benefits, such as insurance, gym, pension, among others, worked as an additional filter to select relevant bigrams and trigrams from a list of nearly 700 000. A complementary strategy includes to review random texts from OJPs including the word “benefits” in the three countries analysed to manually identify specific keywords used to offer employee benefits, including specific programs such as the 401(k)-retirement account in the United States or the Registered Retirement Savings Plan (RRSP) matching contribution in Canada. Annex Table 1.B.1 summarises the combinations that were likely to signal an employee benefit and grouped them in ten different types.
The second step involves tagging each OJP with a 1 if it includes at least one of the keywords defined for each type of benefit in Annex Table 1.B.1. Annex Figure 1.B.1 shows the share of OJPs including the six more frequent benefits per month and type of benefit, excluding the groups “more vacations”, “free/subsidised food”, “social activities” and “parental leave”, since they were not typically used by employers in job postings advertised in these months. Results show significant increases in the mentions of health-related benefits, retirement schemes and paid time-off (in Canada and the United States).
Following the evidence suggesting the increase in the use of employee benefits, a final step aims to assess if the change on the share of employee benefits mentions between the two months analysed was correlated with an increase in the demand for workers at the sectoral level. Annex Figure 1.B.2 compares, by sector, the average change in mentions of employee benefits (weighted average across the different types of benefits using as weights the share of each benefit in the total number of mentions per sector) and the growth observed in the number of job postings. The latter can signal, to some extent, how tight is the labour market for each economic sector. However, results are not conclusive since correlations are weak – as depicted by the weighted trendlines – and the sign of the relation varies across countries.
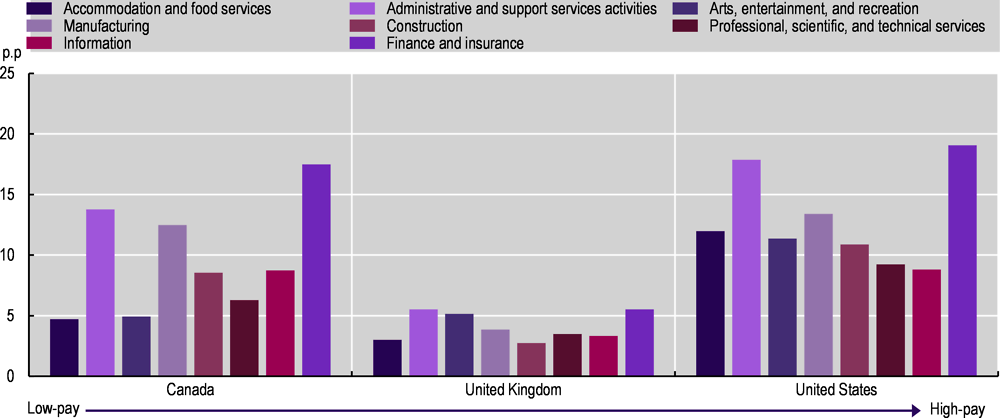
Note: The chart reports the unweighted average of the change (in percentage points) of online job postings offering health-related benefits, retirement schemes, or paid time-off/sick leave. Industries are order by low-pay to high-pay from left to right. p.p: percentage point.
Source: OECD calculations based on Lightcast data.
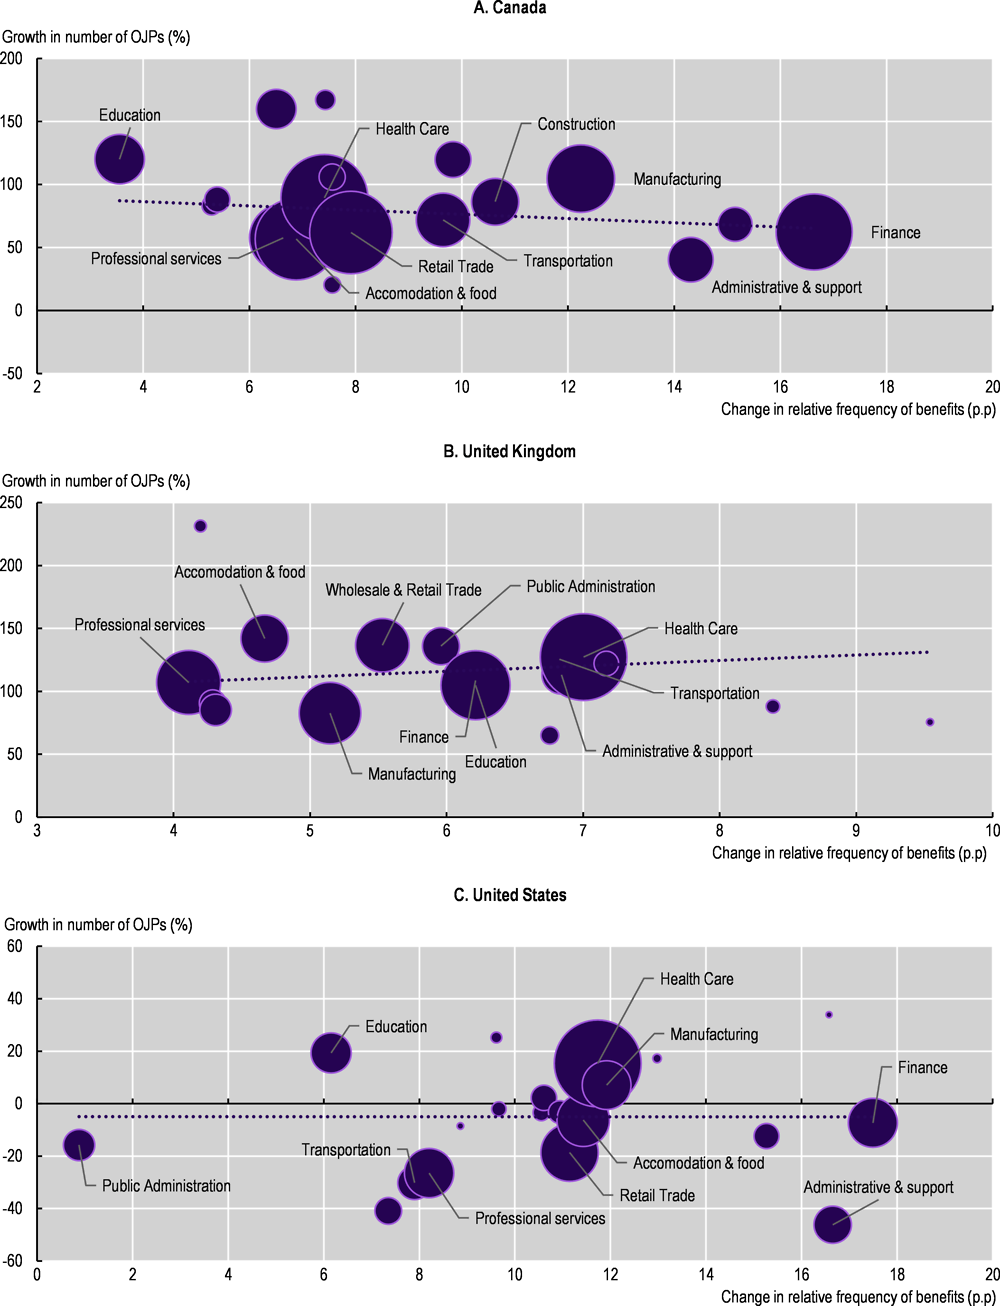
Note: The average change in mentions of employee benefits is weighted by the share of each benefit in the total number of mentions per sector. The trend line is weighted by the share of each sector in the total number of OJPs in both months (bubbles’ size).
Source: OECD calculations based on Lightcast data.
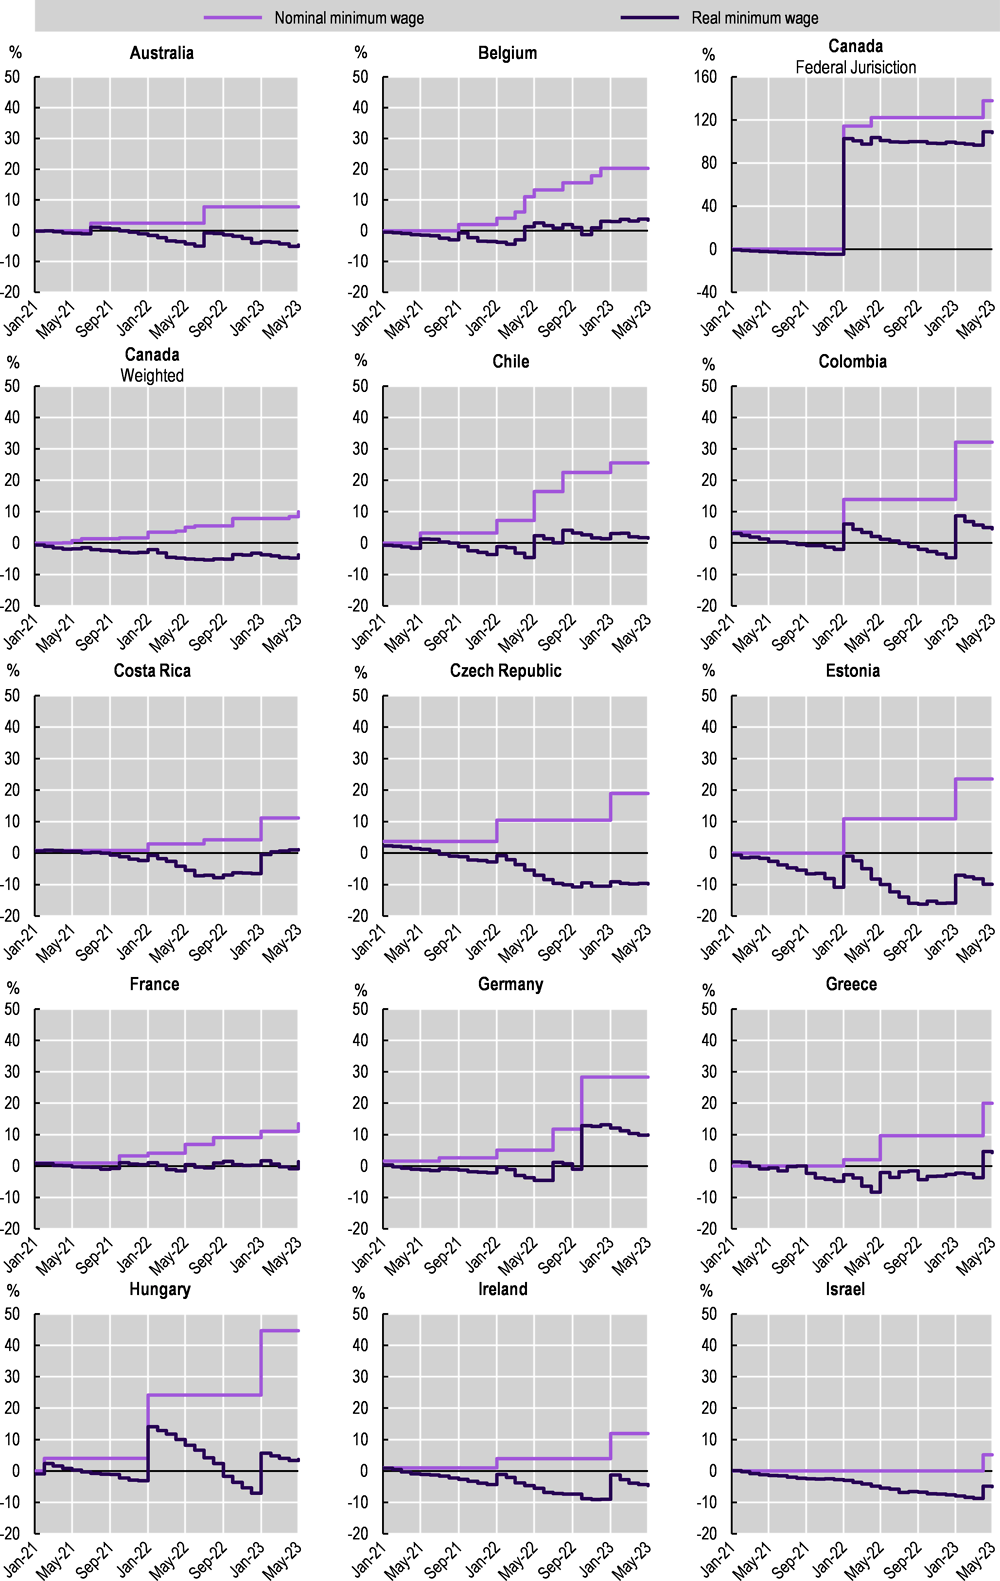
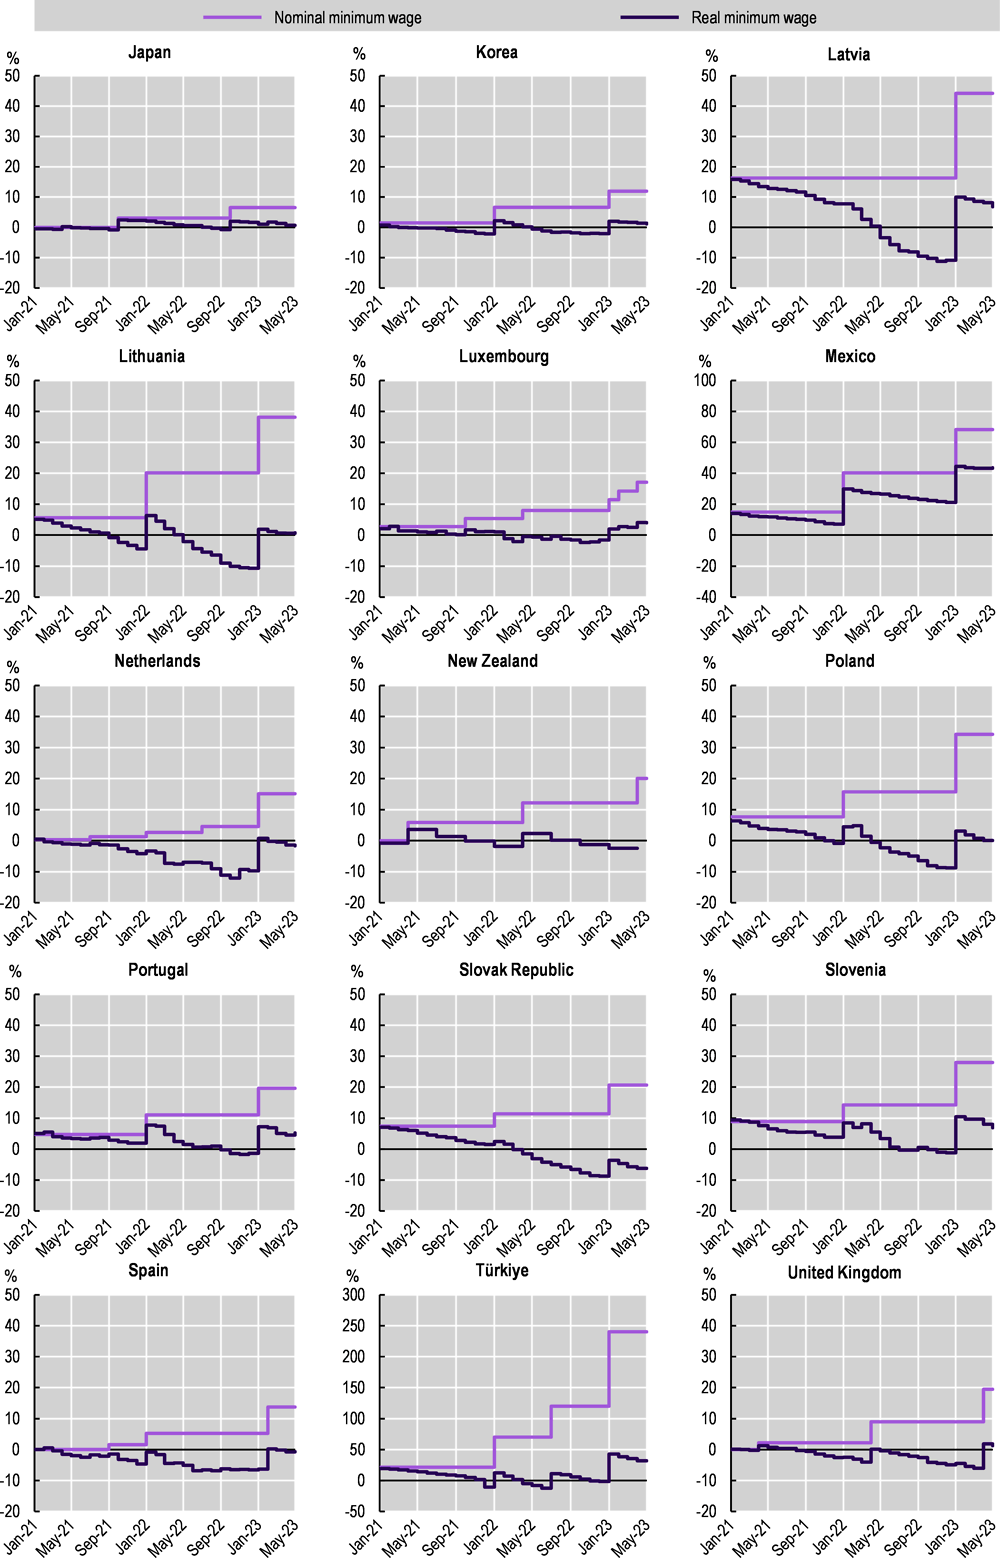
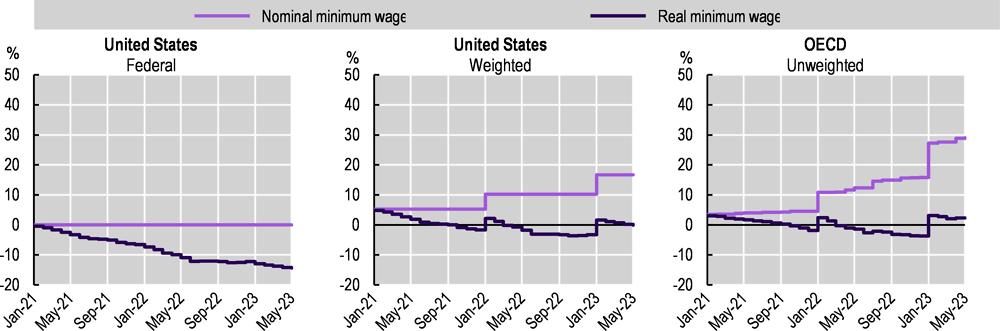
Note: Canada (weighted) is a Laspeyres index based on minimum wage of provinces and territories (excluding the Federal Jurisdiction) weighted by the share of employees of provinces and territories in 2019. United States (weighted) is a Laspeyres index based on minimum wage of states (not including territories like Puerto Rico or Guam) weighted by the share of nonfarm private employees by state in 2019. At date, statistics do not include planned increases in the minimum wage for Australia, the Netherlands, Poland and Türkiye in July 2023 (+8.7%, +3.1%, +3.2% and +34%, respectively). Changes in nominal minimum wage in Belgium in April and May 2022 relate to the transition to a single rate for workers aged 18 and over. OECD is the unweighted average of 30 OECD countries with statutory minimum wage (not including Canada Federal Jurisdiction and the weighted average for the United States).
Source: OECD Employment database, https://www.oecd.org/employment/emp/onlineoecdemploymentdatabase.htm, OECD (2023), “Prices: Consumer prices”, Main Economic Indicators (database), https://doi.org/10.1787/0f2e8000-en (accessed on 4 July 2023), and Monthly CPI Indicator (Australian Bureau of Statistics).
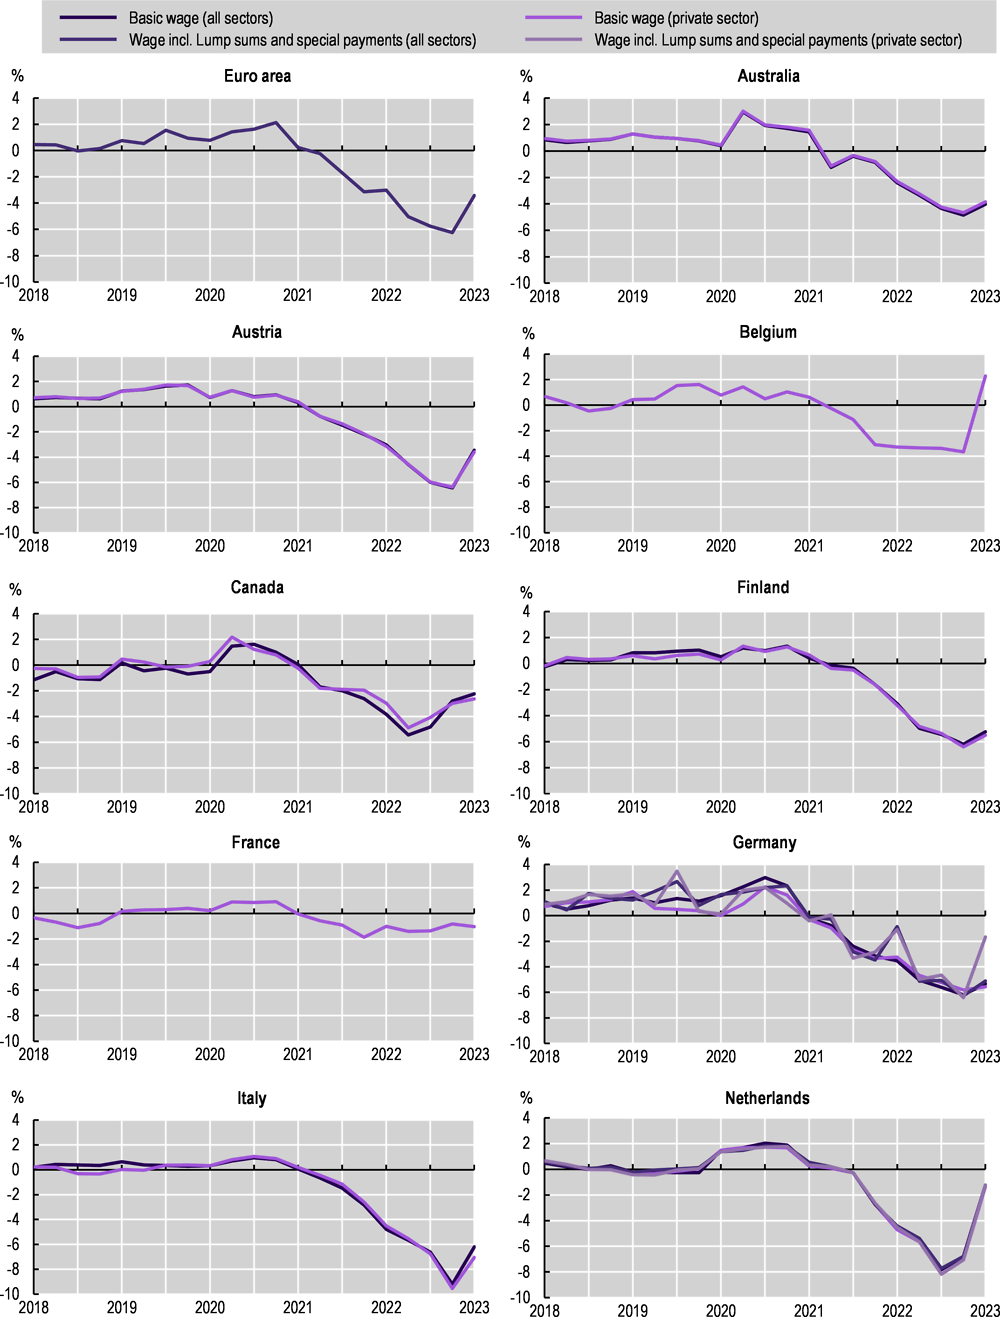
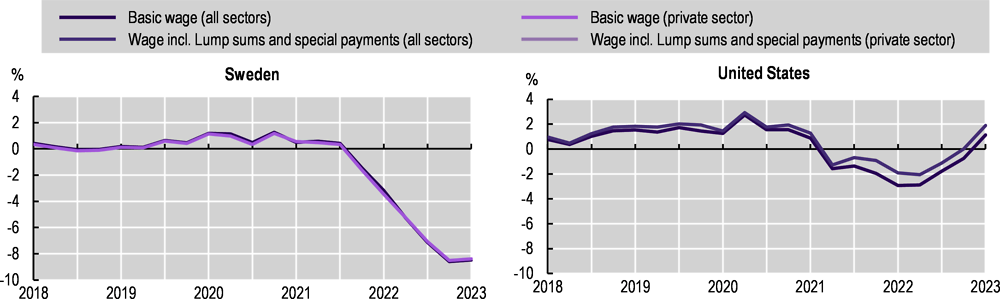
Note: International comparability of data on negotiated wages is affected by differences in definitions and measurement. For further details, see Annex Table 1.C.3. and Annex Table 1.C.4.
Statistics are representative of all employees covered by a collective wage agreement for Austria, Belgium, the Euro Area (19), Finland, France, Germany, Italy, the Netherlands and Sweden. In Canada, statistics refer to collective bargaining settlements of all bargaining units covering 500 or more employees (units of 100 or more employees for the Federal Jurisdiction). For Australia, Canada and the United States, statistics refer only to employees affected by an increase of the negotiated wage at date. Wage increases in Austria, Belgium, the Euro Area (19), Finland, Germany, Italy, the Netherlands and Sweden refers to the average increase in negotiated wages weighted by the employment composition for a reference year (Laspeyres index). The reference year of the employment composition used is 2005 for Finland, 2009 for Sweden, 2010 for Belgium and the Netherlands, January 2015 for the Euro Area, 2015 for Germany and Italy, and 2016 for Austria. For Australia, Canada, France and the United States, wage increase refers to the average increase in negotiated wages weighted by the number of employees affected of the period considered. Private sector in Germany refer to all industries excluding agriculture, public administration, education, health, and other personal services (Sections B to N of the NACE rev. 2.).
Source: OECD calculations based on national data on negotiated wages and OECD (2023), “Prices: Consumer prices”, Main Economic Indicators (database), https://doi.org/10.1787/0f2e8000-en (accessed on 4 July 2023).
Notes
← 1. Results not reported here show that the increase in inactivity in these countries are even larger when assessed against the linear trend extrapolated from 5 or 10 years of quarterly data before the COVID-19 crisis. While informative, however, such an exercise rests on the strong assumption that pre-crisis trends would have continued in the absence of the COVID-19 crisis, which might not have been the case in all countries given the cyclicality of participation rates. For example, participation in the United States and the United Kingdom was expected to decline in pre-pandemic projections (Hobijn and Şahin, 2022[56]; Lee, Park and Shin, 2023[57]).
← 2. Data on vacancies registered at the Japanese public employment service (Hello Work) suggest that labour market tightness did not increase significantly in Japan (https://www.mhlw.go.jp/stf/newpage_33806.html).
← 3. https://www.mbie.govt.nz/business-and-employment/employment-and-skills/labour-market-reports-data-and-analysis/monthly-labour-market-fact-sheet/.
← 4. https://fred.stlouisfed.org/series/JTSQUR.
← 5. https://www.ons.gov.uk/employmentandlabourmarket/peopleinwork/employmentandemployeetypes/datasets/labourforcesurveyflowsestimatesx02.
← 6. https://www.abs.gov.au/statistics/labour/employment-and-unemployment/job-vacancies-australia/latest-release.
← 7. The analysis of job posting data presented in this section was conducted by Diego Eslava and Fabio Manca.
← 8. This analysis leverages text included in nearly 8 million online job postings collected by Lightcast in Canada, the United Kingdom and the United States. As the analysis is very computationally intensive, it has been restricted to these three countries due to resource constraints.
← 9. It is also possible that the results reported in this section reflect an increase in mere mentions of benefits that were already offered rather than an increase in the proportion of jobs offering such benefits. This could also be driven by the tightening of labour markets, making employers more likely to highlight specific aspects of their employment package that might attract applicants. However, the evidence presented in the rest of the section on temporary contracts and involuntary part-time (along with the wage dynamics discussed later in the chapter) do suggest that workers have seen an appreciable improvement in at least some aspects of their working conditions in recent times.
← 10. See OECD (2018[60]) for a discussion of the evidence that temporary contracts are associated on average with worse working conditions.
← 11. Data on the share of new hires in involuntary part-time are only available from Eurostat from Q1 2021.
← 12. This section draws on OECD (2023[2]).
← 13. The share of items in consumer price baskets that have had annual price rises of more than 5% for at least 12 months has gone from near zero at the beginning of 2021 to around a quarter on average by April 2023, and to a third or more in Germany and the United Kingdom (OECD, 2023[2]).
← 14. For example, in the Euro Area the difference between the effective inflation rate in the lowest and highest income quintiles in September 2022 was at its highest level since 2006 (Charalampakis et al., 2022[21]). Similarly, in the United Kingdom, the difference between the inflation rate for low- and high-income households stood at 1.4 percentage points in October 2022 – the largest value since March 2009. New Zealand and the United States appear exceptions to this pattern, with evidence suggesting higher effective inflation rates for mid- or high-income households in recent times. See https://www.bls.gov/spotlight/2022/inflation-experiences-for-lower-and-higher-income-households/home.htm and https://www.stats.govt.nz/information-releases/household-living-costs-price-indexes-december-2022-quarter/. Causa et al. (2022[20]) estimate compensating variations (CV) for a number of OECD countries and find that inflation weighs relatively more on low than high-income households, but with marked differences across countries irrespective of differences in inflation – see Causa et al. (2022[20]) for details.
← 15. Consistent with this hypothesis, in the Unites States the inflation differential between low- and high-income households is more positive when accounting for frequent adjustments in consumer’s behaviour in response to price changes, See https://www.bls.gov/spotlight/2022/inflation-experiences-for-lower-and-higher-income-households/home.htm.
← 16. The German Council of Economic Experts (2022[22]) estimates that households in the bottom income decile lost 8.3% of their net disposable income because of the price increases – while those in the top decile only 3.7%. This difference is much larger than that between the inflation rates faced by the two types of households (10.5% and 9.2% respectively).
← 17. Most of the data reported in Figure 1.15 refer to the “wages and salaries” component of the Labour Cost Index which measures the evolution of aggregate wages for a constant industry structure. Therefore, these results are not driven by compositional changes across industries but can be influenced by those occurring within industries. See notes to Figure 1.15 for the details on the countries for which different wage measures have been used.
← 18. Real wage growth is calculated in Figure 1.15 by subtracting consumer price index (CPI) inflation (all items) from nominal wage growth. This is a common and intuitive approach which, however, will tend to produce larger estimates of changes in real wages than computing changes in nominal wages deflated by CPI, when the difference between inflation and nominal wage growth is large. Computing changes in nominal wages deflated by CPI gives an average real wage growth across the OECD countries included in Figure 1.15 of -3.4%. The Spearman rank correlation index across the cross-country distributions of real wage growth calculated with the two methods is always greater than 0.99.
← 19. The wage measures used in this analysis are the only ones available in a timely manner for a significant number of countries but suffer from some limitations. They are typically obtained by dividing a measure of total compensation paid by employers by the total number of hours worked by employees. The main issue is that the use of job retention schemes typically causes total hours to fall more than total compensation, leading to an artificial increase in the measure of hourly compensation. Clearly, this does not correspond to an actual increase in the earnings of employees which typically fall when they are placed on job retention schemes. This issue causes variations in the growth rate of wage measures that can be persistent over time due to base effects which become less important over time as the use of job retention schemes returns to very low levels. While these effects should be relatively minor for Q1 2023, their presence cannot be ruled out entirely. For this reason, the chapter complements evidence on year-on-year changes in wage with that on changes relative to a pre-crisis reference point that is not affected by these base effects. For a more detailed discussion, see for example Bodnár and Le Roux (2022[64]).
← 20. Cumulative changes refer to the difference between Q4 2019 and Q4 2022 to account for seasonality effects. Q1 2020 is not desirable as a reference point for Q1 2023 because wage measures in early 2020 are already distorted by the widespread use of job retention schemes in response to the COVID-19 crisis.
← 21. The analysis of this section uses official inflation rates based on changes in the CPI for all industries.
← 22. These descriptive results do not necessarily reflect a causal relationship and are derived from a simple regression of wage changes at the industry level on changes in vacancy rates at the industry level, dummies for groups of industries by pay levels, country dummies, and calendar quarter dummies. Each industry is weighted by the average share of employees across countries in the sample. Standard errors are clustered at the industry-country level. The extension of the exercise allows for an interaction of the change in vacancy rate with the dummies for the groups of industries by pay levels. The estimates of the differential in pay growth across groups of industries are generally unaffected by the inclusion of these additional controls. To account for the possible role of changes in minimum wages, a different specification regresses changes in wages at the industry level on changes in national minimum wages interacted with the dummies for groups of industries by pay levels (and a dummy is included for countries without a statutory minimum wage). The countries included are Austria, Belgium, Canada, Denmark, Hungary, Ireland, Italy, Japan, Luxembourg, Latvia, the Netherlands, Norway, the Slovak Republic, Slovenia, the United Kingdom and the United States. The industries included are: Trade, Accommodation & food service, Administrative & support service, Arts & entertainment for low-pay industries; Manufacturing, Construction, Transportation & storage, Real estate, Other service for middle-pay industries; Information & communication, Finance & insurance, Professional activities, Education, Health & social work for high-pay industries.
← 23. https://www.ons.gov.uk/employmentandlabourmarket/peopleinwork/earningsandworkinghours/datasets/distributionofgrosshourlyearningsofemployeesearn08.
← 24. Using the income approach, nominal GDP can be decomposed as where is the GDP deflator, is real GDP, is nominal compensation of employees, is gross operating surplus, and is nominal taxes less subsidies on production and imports. This illustrates also the interpretation of as profit margin, i.e. the difference between total revenue and total costs (labour costs, which are part of value added, and intermediate inputs, which are not part of total value added). From this, the GDP deflator can be expressed as the sum of these three components per unit of real output (i.e. unit labour cost, unit profits and unit taxes less subsidies) or . This implies that changes in the GDP deflator – which capture changes in domestic prices – can be decomposed into the changes of the three components (see Box 1.5).
← 25. The anti-cyclical behaviour of the labour share of income is well documented in the literature (OECD, 2012[53]; ILO/OECD, 2015[65]), but its pronounced decline in the recovery from the COVID-19 crisis appears particularly robust.
← 26. For a formal description of the equivalence between real unit labour costs and the labour share of income see (Australian Bureau of Statistics, 2021[58]). Based on the equation reported in note 24, if changes in unit taxes less subsidies are negligible, larger increases in unit profits than in unit labour costs imply that producer prices per unit of output increase more than unit labour costs. In turn, this implies a reduction in real unit labour cost defined as unit labour cost deflated by the GDP deflator. Real unit labour costs can increase even when unit profits increase more than unit labour cost in the presence of relatively large changes in unit tax less subsidies.
← 27. The increase in profit margins (i.e. the difference between revenue and all production costs) likely reflects the presence of market power which allows firms to raise prices over and above the increase in the marginal cost of labour and other inputs. However, the increase in profit margins does not necessarily imply an increase in the market-power of firms – as captured by the percentage mark-up of prices over the marginal cost (Colonna, Torrini and Viviano, 2023[62]). In fact, profit margins can increase even if mark-ups are constant or decreasing when input costs increase quickly. Colonna, Torrini and Viviano (2023[62]) find that mark-ups have indeed increased in several non-tradable sectors in Germany and the United States, whereas in Italy they have returned to pre-crisis levels after a contraction during the initial stage of the COVID-19 crisis. Hansen et al. (2023[31]) present a range of indicators for the Euro Area that paint a picture of “resilient but perhaps not (sharply) increasing profitability” In general, therefore, the presence of market power has enabled firms to maintain or increase profit margins. More strikingly, in some cases – and notably in several sectors of the two of the largest OECD economies – the increase in profit margins even appears to reflect an increase in market power.
← 28. This observation points to the importance of enhancing competition in non-tradable sectors. For an in-depth treatment of these issues, see https://www.oecd.org/economy/reform/indicators-of-product-market-regulation/.
← 29. Fringe benefits are in-kind benefits offered to employees, which in Italy also include healthcare assistance, insurance policies, loan provisions, and provided accommodations.
← 30. In the eight OECD countries without a statutory minimum (Austria, Denmark, Finland, Iceland, Italy, Norway, Sweden and Switzerland), sector- or occupation-levels collective agreements include de facto wage floors for large parts of the workforce. Yet in Switzerland, five cantons (e.g. local administrative areas such as Geneva and Ticino) have also introduced a statutory canton-wide minimum wage.
← 31. The section on minimum wages builds on and expands the policy brief “Minimum wages in times of rising inflation” published in December 2022 (OECD, 2022[63]).
← 32. This renewed attention also echoes an increasing consensus among policy makers and academics that, at the level set in most OECD countries, minimum wage increases (even large ones) have had a positive effects on earnings at the bottom of the earning distribution but no or limited negative effects on employment – see Dube (2019[55]) for a comprehensive review of the recent evidence. Moreover, the increasing body of evidence across OECD countries on monopsony power, i.e. firms’ power to set wages unilaterally leading to inefficiently low levels of employment and wages, has reinforced the arguments for raising the minimum wage where it is too low, or introducing one where it does not exist, in particular when workers are not already covered by effective collective bargaining (OECD, 2022[54]).
← 33. In France the formula also adds half of past increases in real wages among blue collar workers.
← 34. In Belgium and Luxembourg, the indexation mechanism is the same as the one for general wages.
← 35. Currently, 13 states and the District of Columbia index state minimum wages to a measure of inflation. In addition, another 6 states are scheduled in a future year to index state minimum wage rates to a measure of inflation (Congressional Research Service, 2023[66]).
← 36. However, in Luxembourg, the second increase in 2022 was postponed on the basis of a tripartite agreement.
← 37. This one-off increase was decided by the parliament before the sudden increase in prices and marked a departure from the uprating mechanism in place since 2015 whereby decisions on adjustments to the level of the minimum wage are made every two years by the Minimum Wage Commission (composed by workers’ and employers’ representative with academic experts in a consulting role).
← 38. However, even in a country like France, the increases have not led to a price-wage spiral and are considered by the French central bank as compatible with a gradual decline in inflation in 2023 and a return towards the 2% target by end-2024 to end-2025 (Baudry, Gautier and Tarrieu, 2023[61]).
← 39. Clemens and Strain (2022[59]) find lower non-compliance in US states where the minimum wage is indexed.
← 40. In October 2022, the collective agreement in the German chemical sector was renewed with a 3.25% wage increase for both 2023 and 2024 and the confirmation of the tax-free one-off payments of EUR 1 500.
← 41. In Italy, around 40% of private sector employees are currently covered by a collective agreement that has expired by, on average, 31 months.
← 42. According to the ECB, around 18% of private-sector employees in the Euro Area covered by an agreement indexed to inflation (Koester and Wittekopf, 2022[38]).
← 43. The forecast of the harmonised consumer price index (HICP) net of imported energy goods for a four-year horizon is published by the national statistical office every year in June.
← 44. The inflation reference rate used in collective agreements tends to be the year-on-year rate at the end of each year, although in some cases average year-on-year rates for the year as a whole are used.
← 45. What matters for inflation is not wage growth per se, but wage growth over and above productivity growth. For instance, a 3% wage growth is compatible with a 2% inflation target if productivity grows by 1%.