
Iceland
Educational attainment has been increasing throughout the OECD, in particular at tertiary level. Between 2000 and 2021, the share of 25-34 year-olds with tertiary attainment increased on average by 21 percentage points. In Iceland, the share also increased albeit at a slower pace, by 13 percentage points (from 29% in 2000 to 42% in 2021) (Figure 1). Iceland is one of the 24 OECD countries where tertiary education is the most common highest level of attainment among 25-34 year-olds.
Upper secondary attainment is often seen as a minimum qualification for successful labour market participation. Although the general increase in educational attainment has seen a parallel decline in the share of 25-34 year-olds without upper secondary attainment, 14% of young adults across the OECD still left school without an upper secondary qualification. In Iceland, the share is 20%, which is higher than the OECD average.
Higher educational attainment is often associated with better employment prospects and Iceland is no exception. In 2021 the employment rate among 25-34 year-olds with tertiary education in Iceland was 11 percentage points higher than among those with below upper secondary attainment and 4 percentage points higher than among those with upper secondary or post-secondary non-tertiary attainment. On average across OECD countries, the employment rate among 25-34 year-olds with a tertiary qualification was 26 percentage points higher than among those with below upper secondary attainment and 8 percentage points higher than among those with upper secondary or post-secondary non-tertiary attainment. While the positive link between educational attainment and employment rates holds for both men and for women across the OECD, it is particularly strong for women. In Iceland, 68% of women with below upper secondary attainment were employed in 2021, compared to 81% of those with tertiary attainment. In contrast, the figures were 75% and 89% for men.
Across the OECD, the labour market benefits of tertiary attainment have proved especially strong during economic crises. This was also the case during the COVID-19 pandemic in Iceland. Between 2019 and 2020, unemployment for 25-34 year-old workers with below upper secondary attainment increased by 1.3 percentage points, by 3.8 percentage points for workers with upper secondary attainment and by 3.3 percentage points for workers with tertiary attainment. In 2021, unemployment for workers with below upper secondary attainment increased by 2.9 percentage points, compared to 2020, while it fell by 1.6 percentage points for workers with upper secondary attainment and by 1.9 percentage points for workers with tertiary attainment.
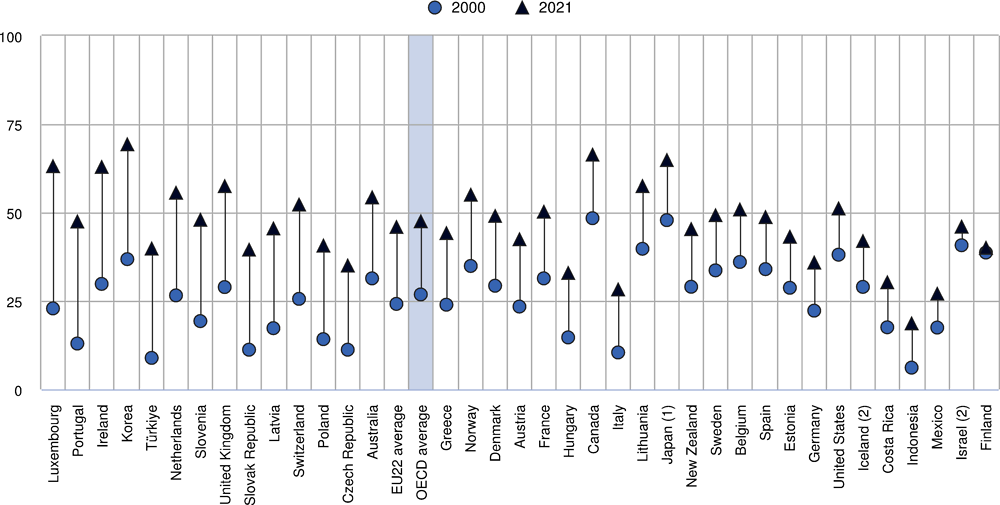
1. Data for tertiary education include upper secondary or post-secondary non-tertiary programmes (less than 5% of adults are in this group).
2. Year of reference differs from 2000: 2002 for Israel and 2003 for Iceland.
Countries are ranked in descending order of the difference in the share of tertiary-educated 25-34 year-olds between 2000 and 2021.
Source: OECD (2022), Education at a Glance Database, http://stats.oecd.org/. See Source section for more information and Annex 3 for notes (https://www.oecd.org/education/education-at-a-glance/EAG2022_X3-A.pdf).
Compulsory education begins at the age of 6 and ends at the age of 16 in Iceland. The range of ages for which at least 90% of the population are enrolled is longer than the period of compulsory education and goes from the age of 2 to the age of 17. This is similar to most other OECD countries, where more than 90% of the population are also enrolled for longer than the period of compulsory education.
The age at which children enter early childhood education differs widely across countries. In Iceland, early childhood education starts offering intentional education objectives for children younger than 1 and 49% of children under 3 are enrolled in early childhood education. Across OECD countries, the average enrolment rate among children below the age of 3 is 27%, but the rates range from less than 1% to 63%. The enrolment rate among 3-5 year-olds increases substantially in all OECD countries. In Iceland, 96% of all children of this age are enrolled in early childhood education, which is above the OECD average.
The average age of graduation from general upper secondary programmes varies from 17 to 21 years across OECD countries and is 20 years in Iceland. Differences in the average age of graduation from vocational upper secondary education are much larger and vary from 16 to 34 years across the OECD. These differences largely depend on whether vocational upper secondary students usually enrol in these programmes towards the end of their compulsory education or in mid-career. In Iceland, the average age of graduation from vocational upper secondary education is 28 years, which is above the OECD average at 22 years (Figure 2).
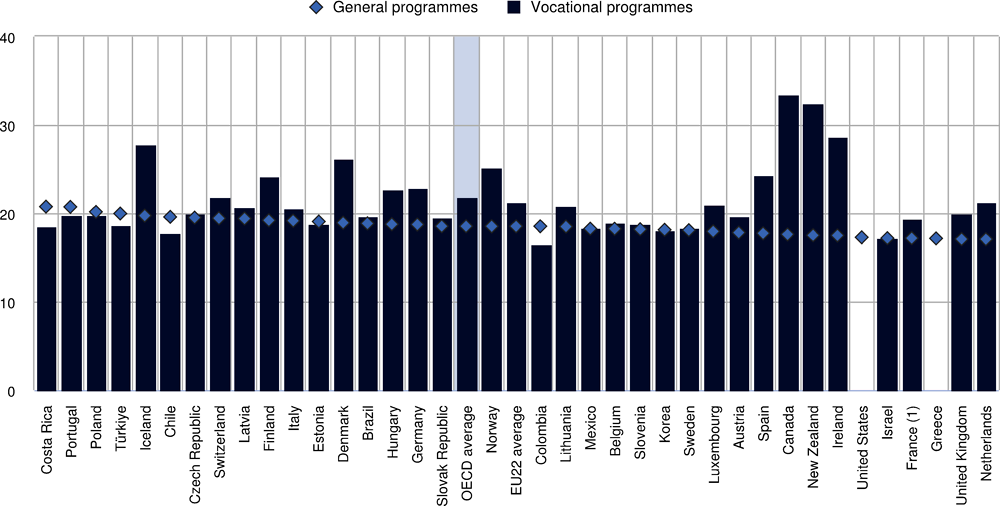
1. Average age is based on all graduates instead of first-time graduates.
Countries are ranked in descending order of the average age of first-time upper secondary graduates in general programmes.
Source: OECD//Eurostat/UIS (2022), Tables B3.1 and B3.2. See Source section for more information and Annex 3 for notes (https://www.oecd.org/education/education-at-a-glance/EAG2022_X3-B.pdf).
In almost all OECD countries, women make up the majority of those graduating from general upper secondary education. In Iceland, the share is 58% (OECD average 55%). In contrast, men are overrepresented among graduates of vocational upper secondary programmes in most OECD countries, as is the case in Iceland where they make up 69% of all vocational upper secondary graduates, above the OECD average (55%).
In Iceland, 68% of 18-24 year-olds are still in full- or part-time education or training at either upper secondary or tertiary level (significantly above the OECD average of 54%). A subset of these students (40% of 18-24 year-olds) combine their education or training with some form of employment in Iceland, compared to 17% on average across the OECD.
One significant difference across countries’ education systems is on whether or not vocational upper secondary programmes provide access to tertiary education. In 12 OECD countries and other participants, all vocational upper secondary graduates have direct access to tertiary education. In Iceland only 4% of graduates from vocational upper secondary programme have direct access to tertiary education. This was changed in Iceland in 2021, allowing all students completing programmes at European Qualification Framework level 4 direct access to tertiary education.
As is the case in all OECD countries, a majority of students enrolled at tertiary level in Iceland are bachelor’s students (68%). However, the next commonest enrolment level varies from country to country. In Iceland, master's students make up the second largest group of tertiary students at 25%. This is also the case in 25 other OECD countries, while in the remaining 14 countries with available data, short-cycle tertiary students form the second largest group.
At 19%, business, administration and law was the most popular field of study among new entrants into tertiary education in Iceland, which is the case in most OECD countries. Despite the growing need for digital skills and the good employment prospects of students with degrees in information and communication technologies (ICT), only a small fraction of entrants into tertiary education choose this field. In Iceland, 97% of 25-64 year-olds with a tertiary ICT qualification are employed, but ICT students make up only 4% of new entrants into tertiary education. This is below the OECD average of 6%.
All OECD countries devote a substantial share of national output to educational institutions. In 2019, OECD countries spent on average 4.9% of their gross domestic product (GDP) on primary to tertiary educational institutions. In Iceland, the corresponding share was 5.7%. Between 2008 and 2019, funding for educational institutions from all sources grew by 19% in Iceland. However, over the same period of time, the increase in GDP was higher with 22%. As a consequence, expenditure on educational institutions as a share of GDP fell by 0.1 percentage points over the same time period.
Public spending on primary to tertiary education was 13% of total government expenditure in Iceland (Figure 3), higher than the OECD average (10.6%). Also, relative to GDP, public spending on primary to tertiary education (5.6%) is higher than the OECD average (4.4%).
Spending on educational institutions as share of GDP or public budgets are important measures of the importance that countries place on education in their budgeting decisions. However, they do not show the total amount of funding per student because GDP levels, public budgets and student numbers vary from country to country. Across primary to tertiary education, OECD countries spend an average of USD 11 990 per student (in equivalent USD converted using PPPs for GDP) on educational institutions each year. In comparison, Iceland spent USD 15 107 per student in 2019. Its cumulative expenditure on educating a student from the age of 6 to 15 was USD 149 637, which was significantly above the OECD average of USD 105 502.
Across OECD countries, the provision of education at primary and secondary levels in terms of curricula, teaching styles and organisational management leads, on average, to similar patterns of expenditure per student from primary to post-secondary non-tertiary levels. OECD countries as a whole spend on average around USD 9 923 per student at primary and USD 11 400 per student at secondary level. In Iceland, the values are USD 14 304 at primary and USD 15 091 per student at secondary level, which are among the highest across OECD countries.
In contrast to lower levels of education, spending on tertiary education varies widely across OECD countries. Expenditure per student at tertiary level in Iceland is higher than at other levels of education, as is the case in almost all other OECD countries. It is below the OECD average, but similar to many other countries. The average expenditure per student in Iceland is USD 16 610 per year, which is about USD 2 300 higher than that of the primary level and USD 1 500 higher than that of the secondary level.
Public funding dominates non-tertiary education (primary, secondary and post-secondary non-tertiary) in all OECD countries, even after transfers to the private sector. On average across the OECD, private funding accounts for 10% of expenditure at primary, secondary and post-secondary non-tertiary levels, while this share was 3% in Iceland in 2019. In contrast, private expenditure at tertiary level was higher in all OECD countries. In Iceland, the share of private expenditure at tertiary level reached 8%, which was significantly below the OECD average of 31%.

1. Year of reference differs from 2019. Refer to the source table for more details.
2. Primary education includes pre-primary programmes.
Countries are ranked in descending order of total public expenditure on education as a percentage of total government expenditure.
Source: OECD/UIS/Eurostat (2022), Table C4.1. See Source section for more information and Annex 3 for notes (https://www.oecd.org/education/education-at-a-glance/EAG2022_X3-C.pdf).
The salaries of teachers and school heads are an important determinant of the attractiveness of the teaching profession, but they also represent the single largest expenditure item in formal education. In most OECD countries, the statutory salaries of teachers (and school heads) in public educational institutions increase with the level of education they teach, and also with experience. Actual salaries also increase with the level of education. On average across OECD countries, actual salaries range from USD 41 941 at the pre-primary level to USD 53 682 at the upper secondary level. In Iceland, actual salaries average USD 47 620 at pre-primary level and USD 65 753 at upper secondary level.
Among 25-64 year-olds in Iceland, bachelor's degrees are the most common tertiary attainment at 22% of the population followed by master's degrees with 16% and short-cycle tertiary qualifications with 4%. This is similar to the OECD average, where bachelor’s degrees are most common (19%), followed by master’s degrees (14%) and short cycle tertiary qualifications (7%). As in all OECD countries and other participants, only a small fraction of the population holds a doctoral degree: the share is 1% in Iceland.
On average, tertiary attainment generates a wide range of labour-market benefits, including high employment rates. Yet, there are significant differences depending on the field of study. In 2021, employment rates in Iceland were highest among tertiary-educated individuals who studied information and communication technologies with 97% and lowest among those who studied natural sciences, mathematics and statistics, arts and humanities, social sciences, journalism and information or education at 92%. However, these differences need to be put into perspective. Even among 25-64 year-olds with tertiary attainment in the field with the lowest employment rate, this was 11.6 percentage points higher than among those with upper secondary attainment (all fields combined).
Despite the labour market advantages of a tertiary degree, many tertiary students do not graduate on time or do not graduate at all. In Iceland, 39% of bachelor’s students graduate within the theoretical programme duration. Across the OECD, the completion rate within the theoretical programme duration ranges from 12% to 69%. Completion rates three years after the theoretical programme duration are significantly higher in most countries and the differences between OECD countries somewhat narrower. In Iceland, 69% of bachelor’s students have graduated within three years after the end of the theoretical programme duration, compared to 68% on average across the OECD.
In all OECD countries, tertiary completion rates are higher for women than for men. In Iceland, 73% of women graduated within three years after the end of the theoretical programme duration at bachelor’s level, compared to 64% of men. On average across the OECD, there is little systematic difference between the completion rates of public and private institutions, but the figures differ from country to country. In Iceland, 70% of bachelor's students graduate from public institutions within three years after the end of the theoretical programme duration, while the share is 68% for private institutions.
Enabling students to enrol on a part-time basis is an important way to facilitate access to tertiary education. Many part-time students would not be able to study full time, for example because they have child-care responsibilities or have to work to fund their studies. The share of part-time students at the tertiary level in Iceland is 31%, above the OECD average (22%). Compared to 2013, it has increased by 2 percentage points.
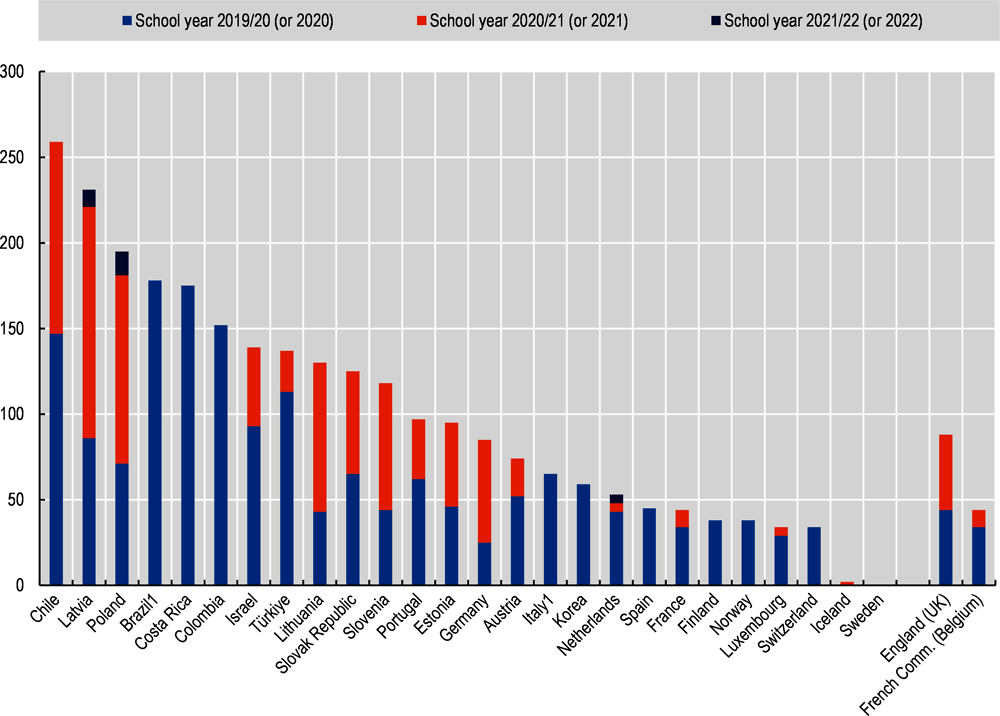
The COVID-19 pandemic disrupted traditional schooling in 2020 and the first half of 2021, leading to school closures across all OECD countries. While most shut down their premises entirely in the wake of the pandemic in 2020, by 2021 the situation had improved and returned to normal in most countries in 2022. In Iceland, primary and secondary schools stayed open during the school year 2019/20 and were entirely closed for 2 days in 2020/21 and stayed open in 2021/22 (Figure 4). Partial closures reached 33 days during the school year 2019/20 and up to 55 days in 2020/21.
Most countries conducted assessments of the impact of school closures on learning outcomes at various levels of education and along several dimensions. Iceland has conducted studies to evaluate the effects of the pandemic on the impact on primary, lower secondary, upper secondary general and vocational education. The assessments covered mathematics and reading. Like many other countries, Iceland also evaluated dimensions such as the mental health and well-being of students and teachers.
Note: The data underlying this report were produced through the Survey on Joint National Responses to COVID 19, a collaborative effort conducted by the United Nations Educational, Scientific and Cultural Organization (UNESCO), the United Nations Children’s Fund (UNICEF), the World Bank (WB), and the Organisation for Economic Co-operation and Development (OECD). Data for other levels of education are available at https://www.oecd.org/education/Results-4th-wave-COVID-Survey-OECD-database.xlsx.
1. Data for 2021 and 2022 are missing.
Countries and other participants are ranked in descending order of the total number of days lower secondary schools were fully closed during the school years 2019/20 (2020), 2020/21 (2021) and 2021/22 (2022).
Source: OECD/UIS/UNESCO/UNICEF/WB (2022).
In school year 2022, national programmes to support students affected by the pandemic were implemented in Iceland at, upper secondary general and vocational and tertiary level. At primary to upper secondary education, measures to address the effects of the COVID-19 pandemic included, community mobilisation campaigns to bring students back to school, automatic re-enrolment of students in school and additional water, sanitation and hygiene services. The government does not plan to assess the effectiveness of these programmes.
The challenges related to the COVID-19 pandemic have created additional costs for education systems. Preliminary budget estimates for 2021 suggest that, compared to 2020, the education budget at pre-primary level in Iceland remained nearly unchanged in nominal terms, while it increased slightly (by between 1% and 5%) at primary to upper secondary level and increased strongly (by more than 5%) at the tertiary level.
Young adults who are not in employment, education or training (NEET) for prolonged periods are at risk of adverse economic and social outcomes in both the short and the long term. After increasing during the COVID-19 pandemic in 2020, the share of 18-24 year-olds who are NEET in Iceland declined in 2021. The share of NEET among young adults was 8% in 2021, above pre-COVID levels.
References
OECD (2022), Education at a Glance 2022: OECD Indicators, OECD Publishing, Paris, https://dx.doi.org/10.1787/69096873-en.
OECD (2022), “Regional education”, OECD Regional Statistics (database), https://dx.doi.org/10.1787/213e806c-en.
For more information on Education at a Glance 2022 and to access the full set of Indicators, see: https://doi.org/10.1787/3197152b-en
For more information on the methodology used during the data collection for each indicator, the references to the sources and the specific notes for each country, See Annex 3 (https://www.oecd.org/education/education-at-a-glance/EAG2022_X3.pdf).
For general information on the methodology, please refer to the OECD Handbook for Internationally Comparative Education Statistics: Concepts, Standards, Definitions and Classifications (https://doi.org/10.1787/9789264304444-en).
Updated data can be found on line at https://doi.org/10.1787/eag-data-en and by following the StatLinks under the tables and charts in the publication.
Data on subnational regions for selected indicators are available in the OECD Regional Statistics (database) (OECD, 2022). When interpreting the results on subnational entities, readers should take into account that the population size of subnational entities can vary widely within countries. For example, regional variation in enrolment may be influenced by students attending school in a different region from their area of residence, particularly at higher levels of education. Also, regional disparities tend to be higher when more subnational entities are used in the analysis.
Explore, compare and visualise more data and analysis using the Education GPS:
https://gpseducation.oecd.org/
The data on educational responses during COVID-19 were collected and processed by the OECD based on the Joint Survey on National Responses to COVID-19 School Closures, a collaborative effort conducted by the United Nations Educational, Scientific and Cultural Organization (UNESCO); the UNESCO Institute for Statistics (UIS); the United Nations Children's Fund (UNICEF); the World Bank; and the OECD.