copy the linklink copied!Indicator A4. What are the earnings advantages from education?
-
On average across OECD countries, adults with a short-cycle tertiary degree earn 20% more than adults with upper secondary education. The earnings advantage increases to 44% for those with a bachelor’s degree and to 91% for those with a master’s or doctoral degree.
-
The gender gap in earnings persists across all levels of educational attainment, and the gap is wider among tertiary-educated adults. Women earn less than men do even with a tertiary degree in the same broad field of study.
-
The tertiary broad fields of study most often associated with the highest earnings are engineering, manufacturing and construction, and information and communication technologies (ICT).
1. Year of reference differs from 2017. Refer to the source table for details.
2. Earnings net of income tax.
3. Bachelor's or equivalent includes master's, doctoral or equivalent.
4. Index 100 refers to the combined ISCED levels 3 and 4 of the educational attainment levels in the ISCED 2011 classification.
5. Bachelor's, master's, doctoral or equivalent include short-cycle tertiary.
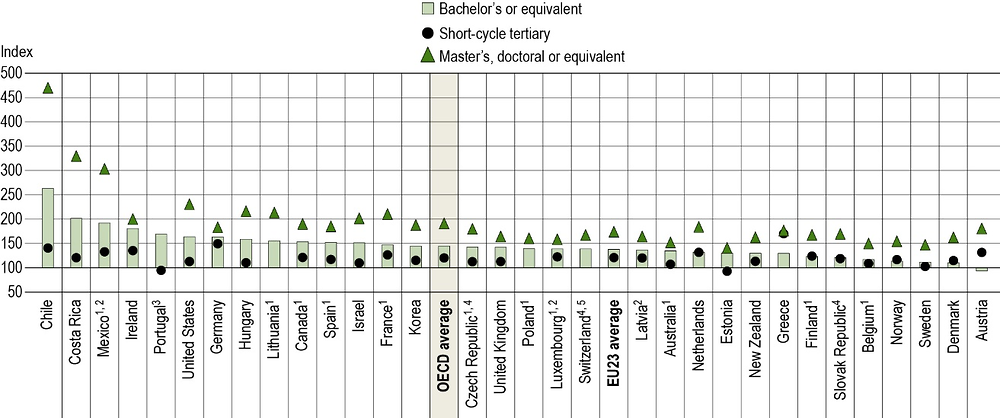
Countries are ranked in descending order of the relative earnings of 25-64 year-olds with a bachelor's or equivalent qualification.
Source: OECD (2019), Table A4.1. See Source section for more information and Annex 3 for notes (https://doi.org/10.1787/f8d7880d-en).
Context
Higher levels of education usually translate into better employment opportunities (see Indicator A3) and higher earnings. The potential to earn more and see those earnings increase over time, along with other social benefits, is an important incentive for individuals to pursue education and training.
In particular, the attainment of a tertiary degree is associated with higher earnings in all OECD countries. However, this advantage can vary according to age, gender, level of tertiary education and field of study. Individuals with higher qualifications and more experience are more likely to earn higher wages. However, in many countries, gender gaps in earnings persist regardless of age, level of education or field of study.
A number of factors other than education also play a role in individuals’ earnings, including the demand for skills in the labour market, the supply of workers and their skills, the minimum wage and other labour-market laws, and structures and practices (such as the strength of labour unions, the coverage of collective-bargaining agreements and the quality of working environments). These factors also contribute to differences in the distribution of earnings.
Other findings
-
Across countries, the likelihood of earning more than the median increases with educational attainment. On average across OECD countries, about two out of three tertiary-educated adults earn more than the median of all employed people, including both full-time and part-time earners, while only about one out of four adults without upper secondary education do so.
-
The earnings advantage for tertiary-educated workers increases with age. While young adults (25-34 year-olds) with tertiary education earn nearly 40% more than their peers with upper secondary education, older adults (45-54 year-olds) earn 70% more.
-
In most countries with available data, the gender gap in earnings is smaller for those with a degree in education or ICT, and larger for those with a degree in business, administration and law.
Note
This indicator presents two types of relative earnings. The first uses the earnings of adults whose highest level of educational attainment is upper secondary education as a baseline. The results reflect the difference in earnings between adults with upper secondary education and those with different levels of attainment. The second type, used to indicate gender disparities in earnings, uses men’s earnings as a baseline. In both cases, given the focus on relative earnings, any increase or decrease in the results could reflect a change in the interest group (numerator) or in the baseline group (denominator). For example, higher relative earnings for tertiary-educated individuals may reflect higher earnings among tertiary-educated individuals and/or lower earnings among those with upper secondary education.
Analysis
Relative earnings, by educational attainment
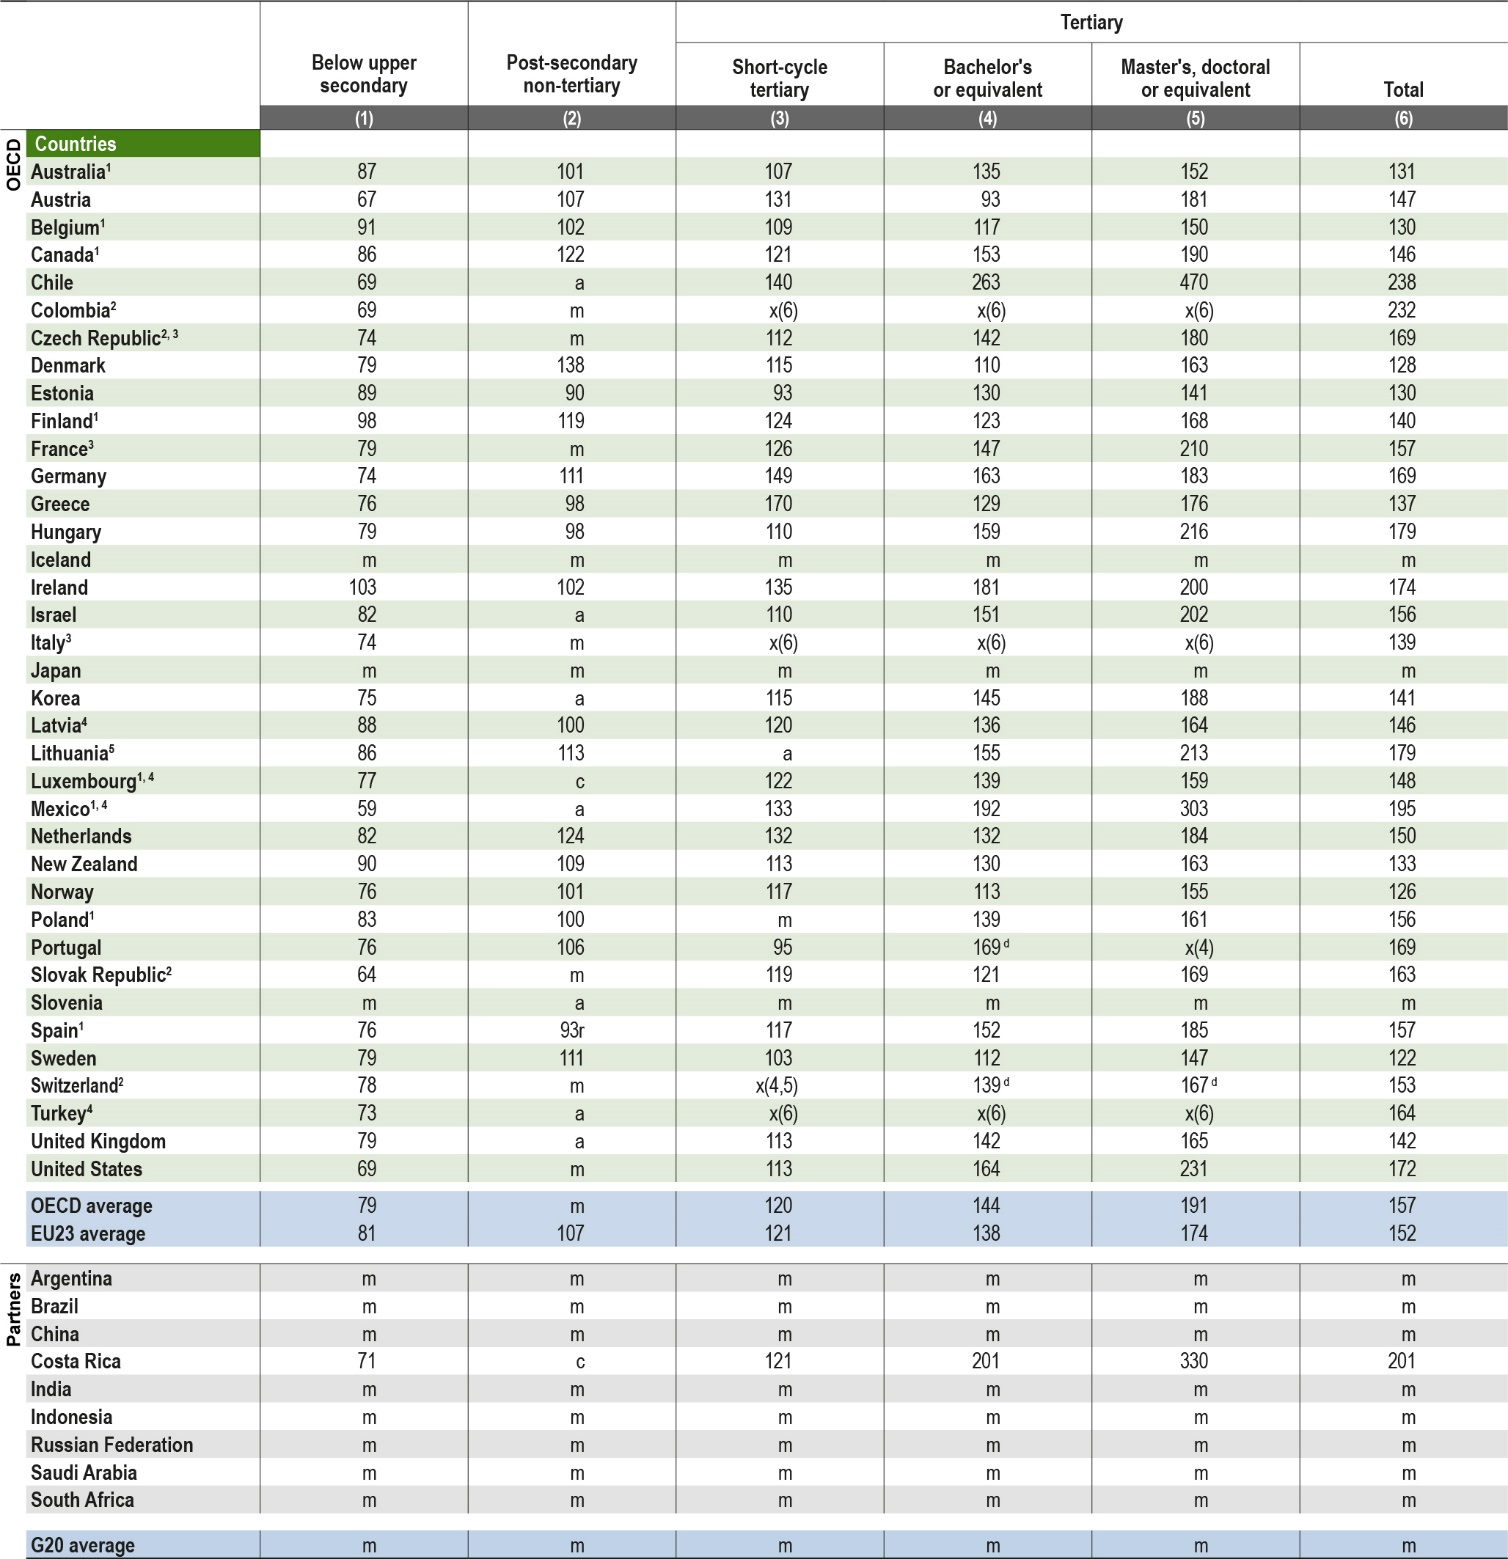
Earnings tend to increase with the level of educational attainment. On average across OECD countries, adults (aged 25-64) without upper secondary education earn about 21% less for part-time or full-time employment than those with upper secondary education, while those with a tertiary degree earn about 57% more (Table A4.1).
Indeed, having a tertiary degree carries a considerable earnings advantage in most OECD and partner countries. The relative earnings for full-time and part-time workers are highest in Chile, Colombia and Costa Rica, where adults with a tertiary education earn over twice as much as those with upper secondary education. In all of these countries, the share of adults with tertiary education is among the lowest in OECD and partner countries (less than 25%), which may partially explain the large earnings advantage of tertiary-educated workers (OECD, 2017[1]).
The earnings advantage of tertiary-educated workers, however, varies considerably by level of tertiary attainment. In most OECD member and partner countries, workers with a master’s or doctoral degree earn more than those with a bachelor’s degree, who in turn earn more than those with a short-cycle tertiary degree. On average across OECD countries, those with a short-cycle degree earn about 20% more than those with only an upper secondary education. The earnings advantage increases to 44% for those with a bachelor’s degree and to nearly 91% for those with a master’s or doctoral degree (Figure A4.1).
There are some important exceptions to this general pattern. In Estonia and Portugal, adults with a short-cycle degree earn less than those with an upper secondary education. In Austria, the same is true for those with a bachelor’s degree. In all three cases, however, these groups represent relatively small shares of the tertiary-educated population. Moreover, unlike in most countries, the earnings of workers with a short-cycle tertiary degree are higher than those of workers with a bachelor’s degree in Austria, Denmark, Finland and Norway. With the exception of Denmark, these countries have among the highest short-cycle tertiary attainment rates, with at least 10% of adults having attained this level (see Indicator A1).
Relative earnings of tertiary-educated workers, by age and through time
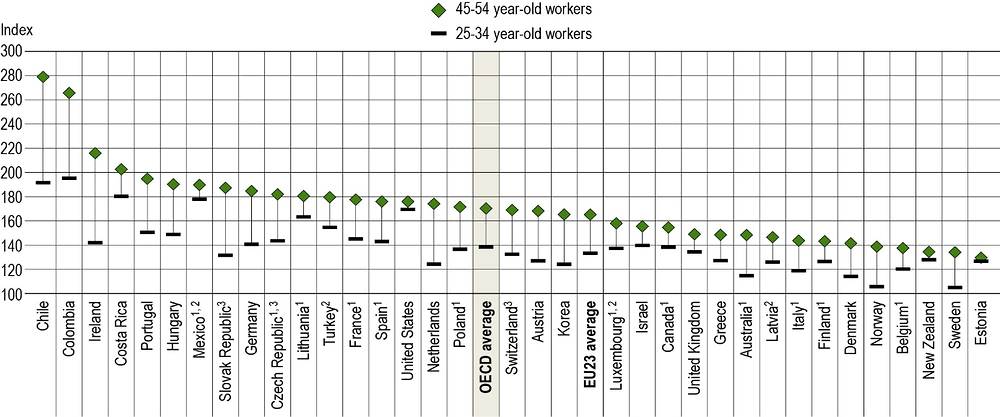
Higher educational attainment is associated with higher earnings throughout a person’s working life, and the advantage is particularly large for older workers. On average across OECD countries, young adults (25-34 year-olds) with tertiary education earn nearly 40% more than their peers with upper secondary education. Older adults (45-54 year-olds) earn 70% more. The earnings advantage increases with age in all OECD and partner countries, although the size of the difference varies considerably, from over 70 percentage points in Chile, Colombia and Ireland to less than 10 percentage points in Estonia, New Zealand and the United States (Figure A4.2).
A greater earnings advantage for older age groups could mean either that the earnings advantage increases with experience or that the earnings advantage has fallen for younger generations (or a combination of both effects). In the first case, age acts as a proxy for work experience and in the second case, age acts as a proxy for changes over time. Although it is not possible to determine the main driving force in each country for the results shown in Figure A4.2, it is possible to shed some light on the issue by analysing the trends in earnings advantages over the past decade.
In most OECD countries, the earnings advantage of tertiary-educated workers has not changed considerably between 2007 and 2017. In at least 20 OECD and partner countries, the difference in the earnings advantage of adults with tertiary education has changed by less than 10 percentage points during the last decade, and in many cases the difference is less than 5 percentage points. Although these results only cover one decade, they suggest that in many OECD countries, the higher earnings advantage of older workers is mostly the result of a positive relationship between relative earnings and work experience.
A possible explanation for the increase in the earnings advantage of tertiary workers as they progress in their careers is that people with higher levels of education are more likely to be and remain employed, and may have more opportunities to gain experience on the job.
1. Year of reference differs from 2017. Refer to the source table for details.
2. Earnings net of income tax.
3. Index 100 refers to the combined ISCED levels 3 and 4 of the educational attainment levels in the ISCED 2011 classification.
Countries are ranked in descending order of the relative earnings of 45-54 year-olds with tertiary education.
Source: OECD (2019), Education at a Glance Database, http://stats.oecd.org/. See Source section for more information and Annex 3 for notes (https://doi.org/10.1787/f8d7880d-en).
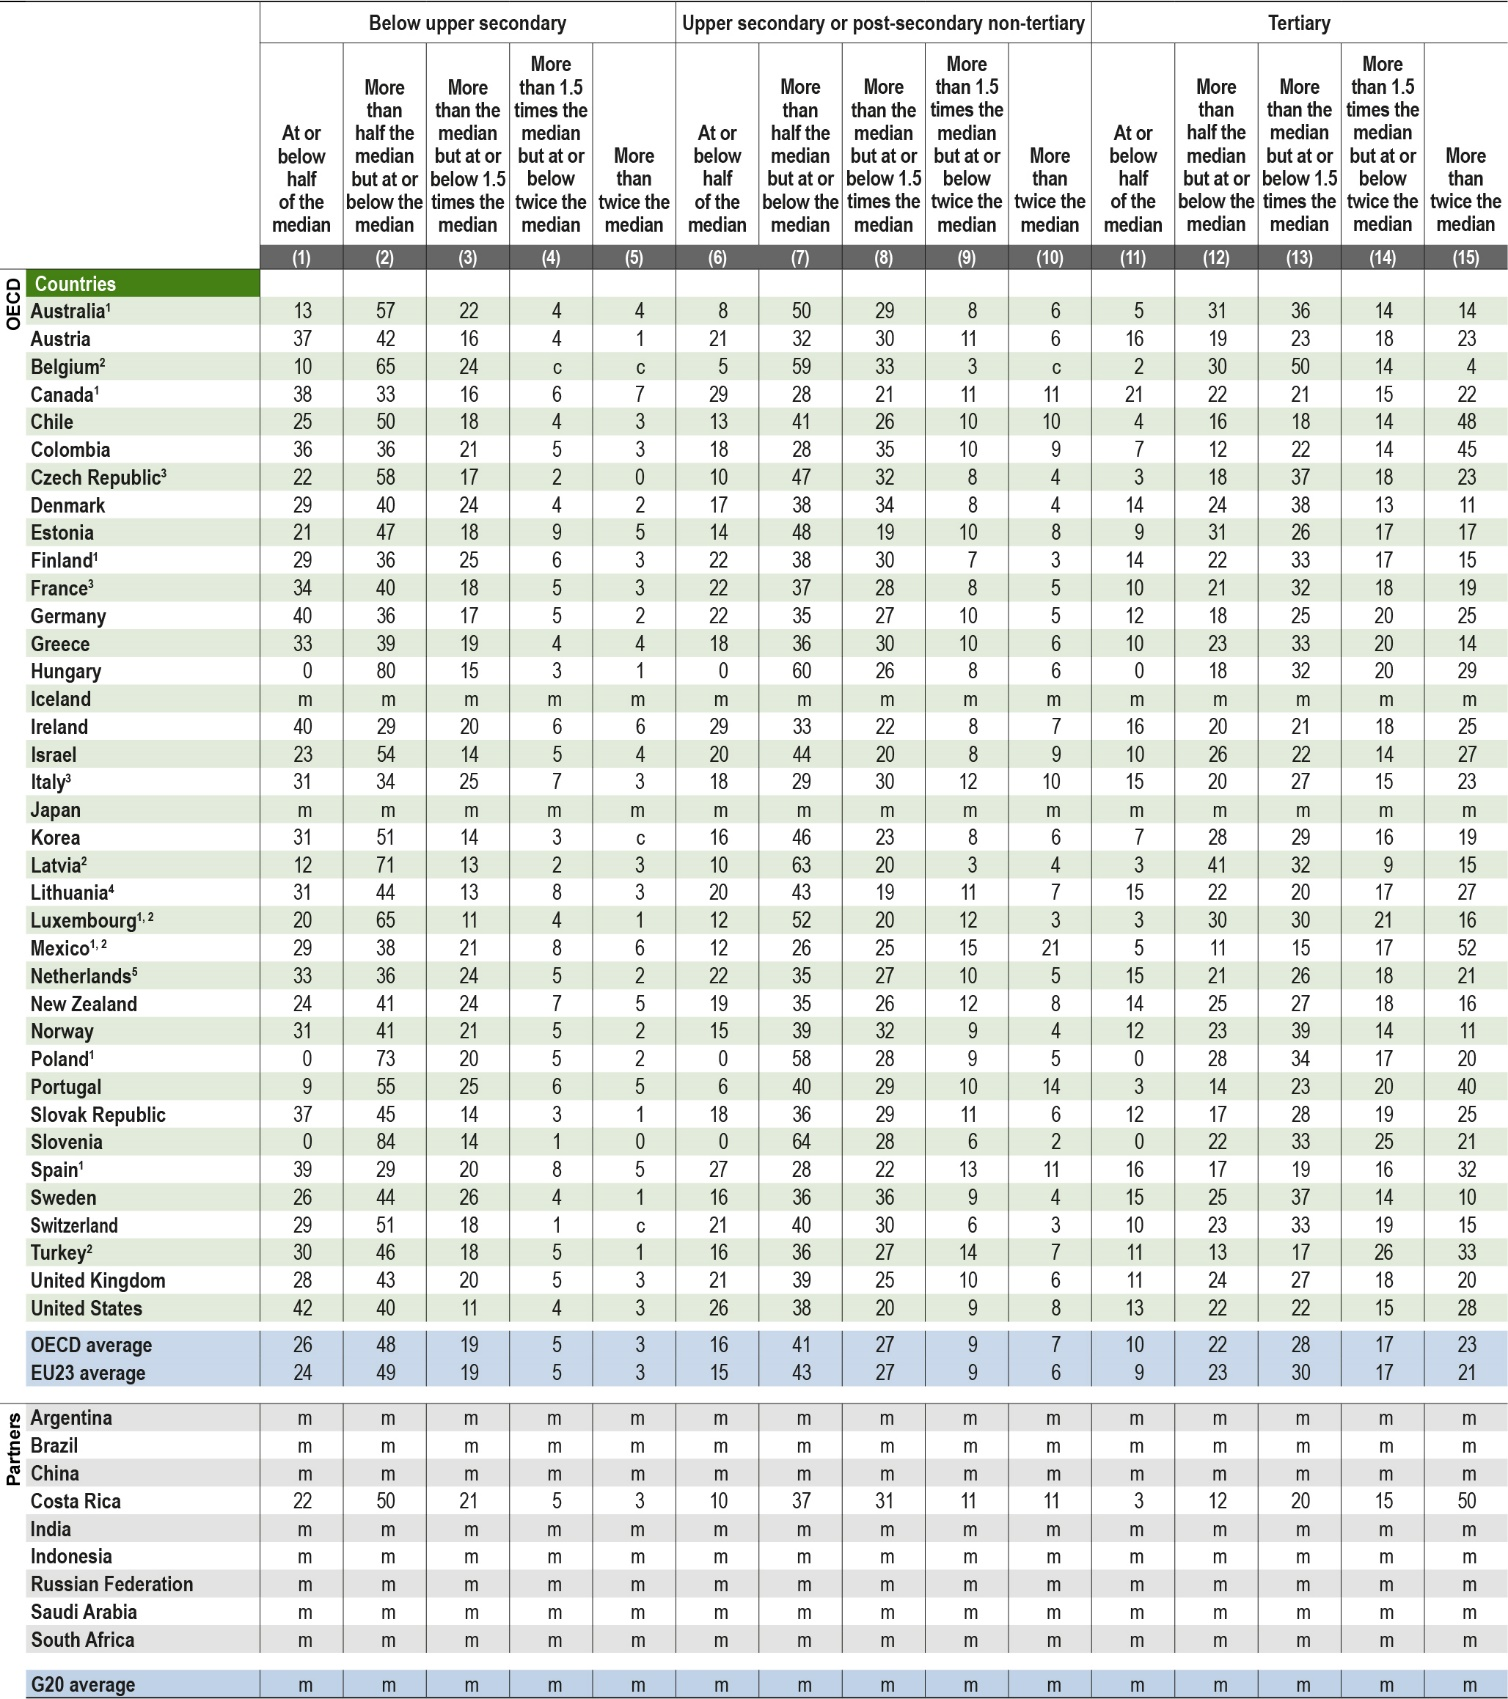
Distribution of earnings relative to the median
A strongly skewed earnings distribution signals income inequality, which may affect the social cohesion of communities and have a significant impact on economic growth. Data on the distribution of earnings among groups with different levels of education show the degree to which earnings centre around the country median. “Median earnings” refer to the earnings of all workers, without adjusting for differences in hours worked.
Across OECD and partner countries, the likelihood of earning more than the median increases with educational attainment. On average across OECD countries, 68% of tertiary-educated adults earn more than the median of all employed adults, including both full-time and part-time earners, while only 26% of adults without upper secondary education do so. The difference is even more striking when considering the share of adults earning more than twice the median. Across OECD countries, an average of 23% of tertiary-educated workers earn more than twice median earnings, compared to only 7% of those with upper secondary or post-secondary non-tertiary education and 3% for those without upper secondary education (Table A4.2).
In some countries, the earnings distribution is more skewed than in others. In Chile, Costa Rica, Colombia, Hungary, Mexico and Portugal, over 80% of tertiary-educated workers earn more than the median. Moreover, in Costa Rica and Mexico about half of tertiary-educated workers earn more than twice median earnings. Indeed, countries with relatively high levels of income inequality also tend to be those with the highest share of the population without tertiary or even upper secondary education (OECD, 2018[2]).
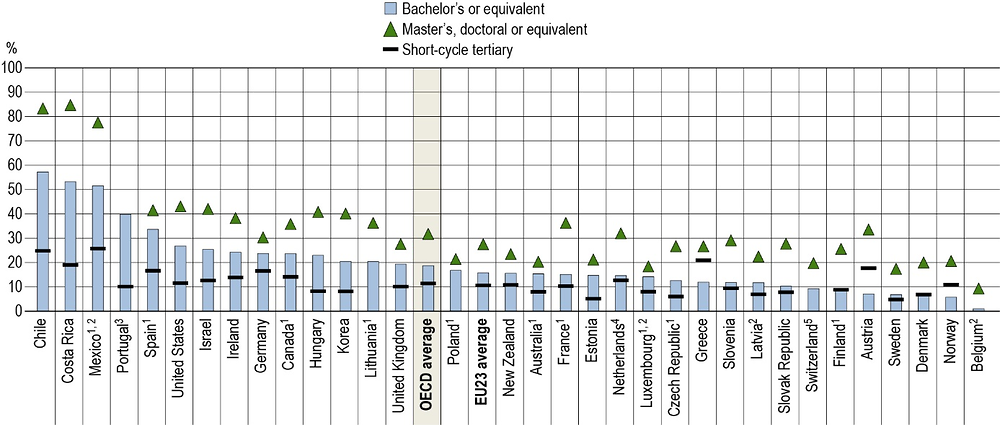
Among tertiary-educated workers, the distribution of earnings can vary considerably depending on the level of tertiary education attained. In nearly all OECD countries, the share of adults earning more than twice the median increases at each level from short-cycle tertiary, to bachelor’s and master’s or doctoral degrees. On average across OECD countries, 11% of workers with a short-cycle tertiary degree earn more than twice the median. The share increases to 19% among those with a bachelor’s degree and to 32% among those with a master’s or doctoral degree (Figure A4.3).
1. Year of reference differs from 2017. Refer to the source table for details.
2. Earnings net of income tax.
3. Bachelor's or equivalent includes master's, doctoral or equivalent.
4. Data refer to full-time, full-year earners only.
5. Bachelor’s, master’s, doctoral or equivalent include short-cycle tertiary.
Countries are ranked in descending order of the share of 25-64 year-olds with a bachelor's or equivalent qualification earning more than twice the median.
Source: OECD (2019), Education at a Glance Database, http://stats.oecd.org/. See Source section for more information and Annex 3 for notes (https://doi.org/10.1787/f8d7880d-en).
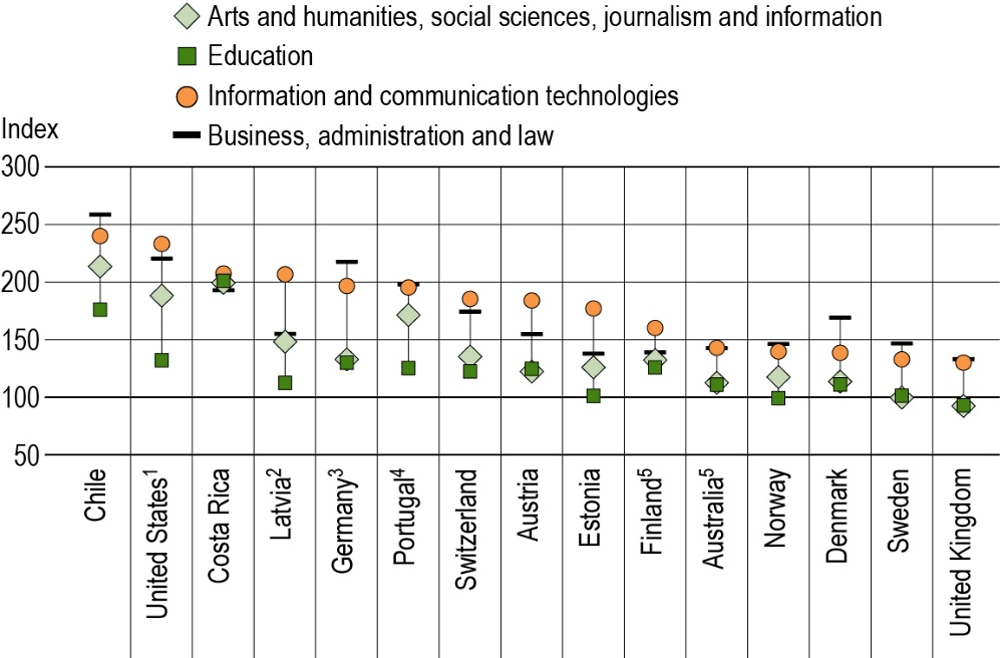
Relative earnings of tertiary-educated adults, by field of study
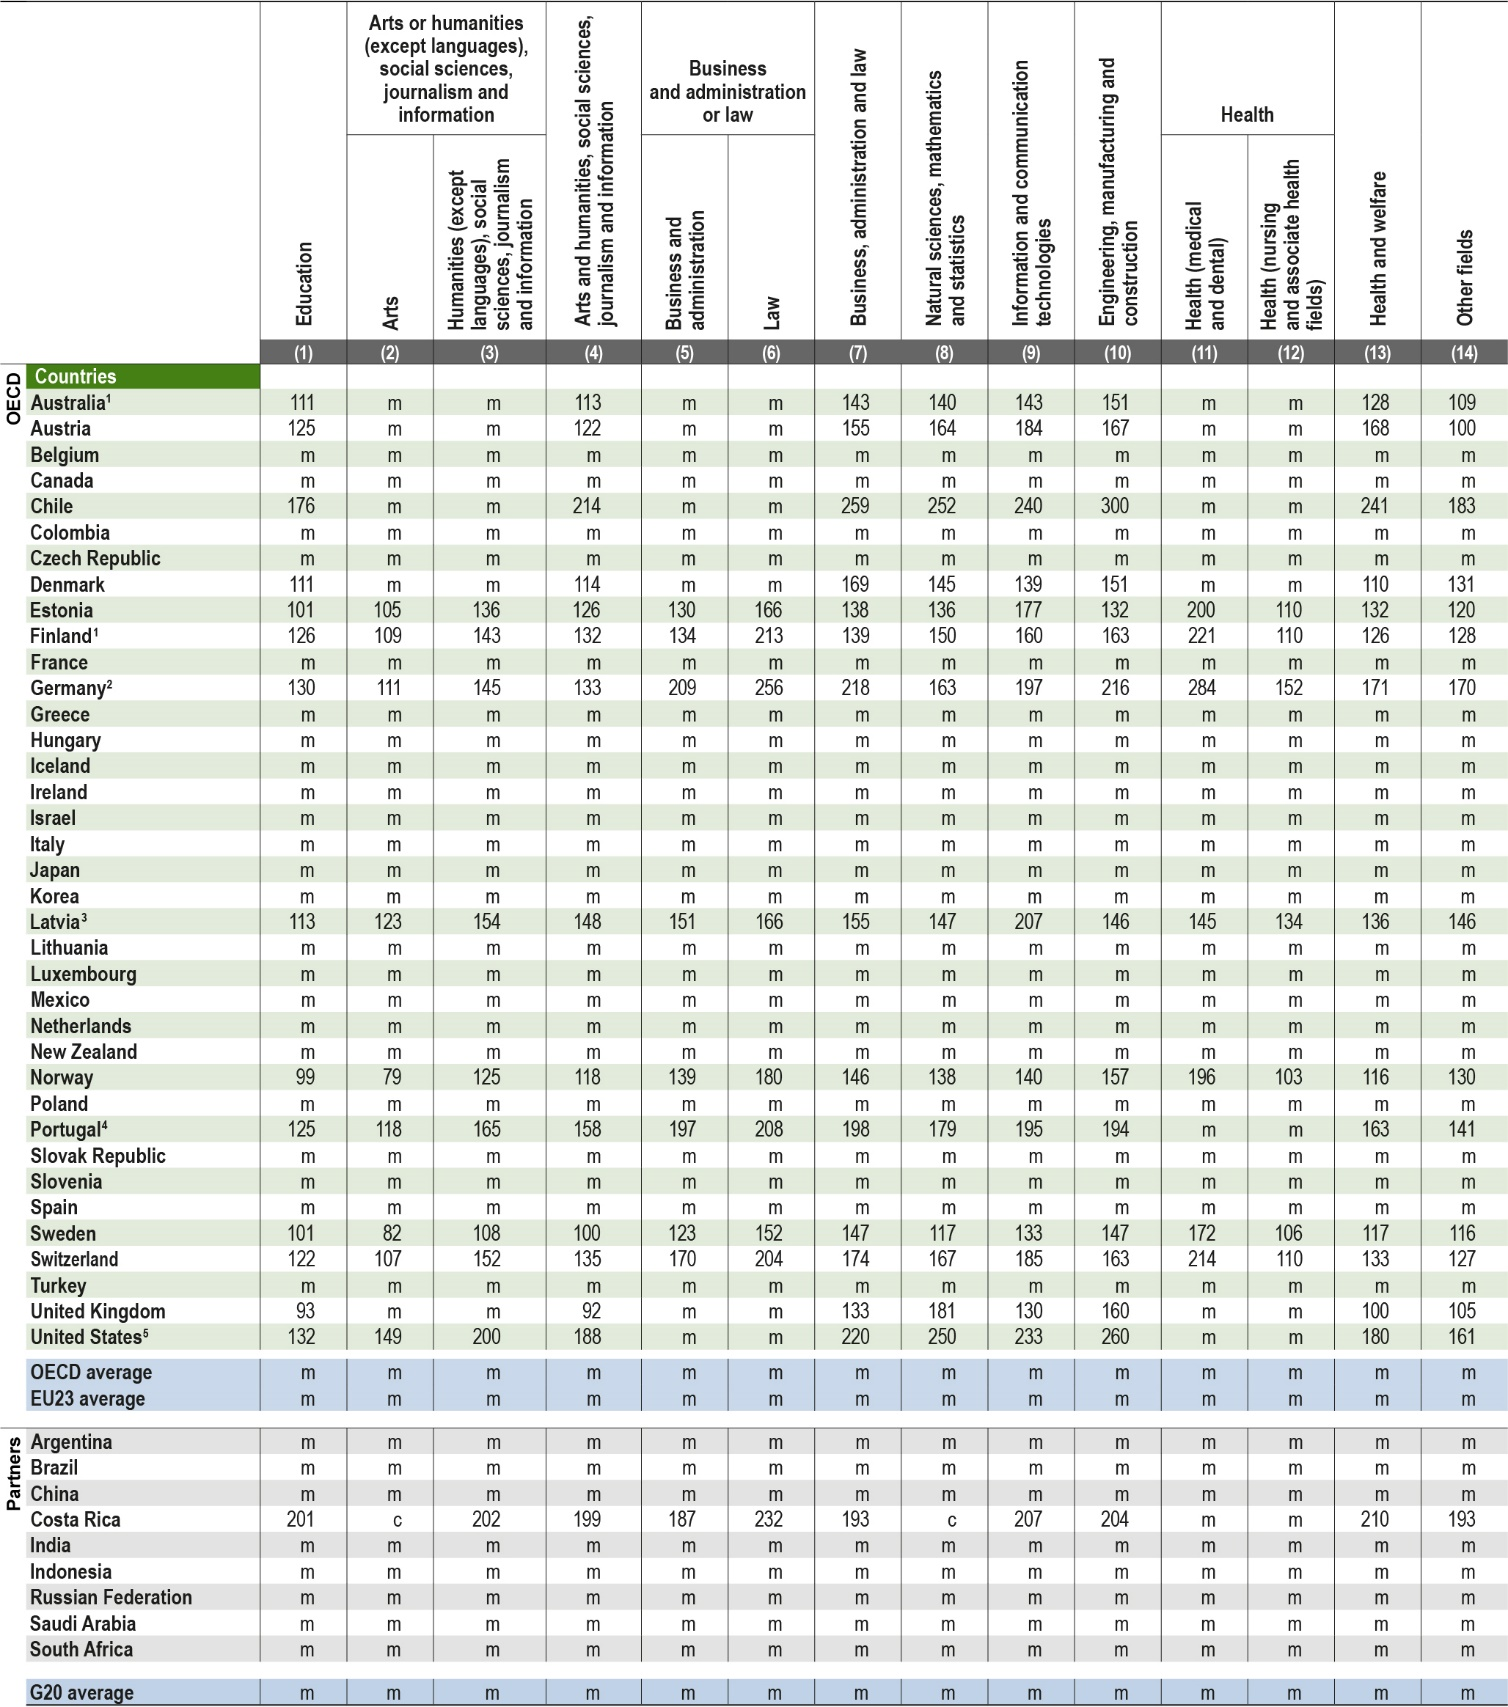
The earnings advantage for tertiary-educated adults also varies by their field of study. Among the 14 OECD countries with data available, the broad fields of study most commonly associated with the highest earnings are engineering, manufacturing and construction (six countries) and ICT (four countries). On average across OECD countries, only 14% of tertiary graduates in 2017 obtained a degree in engineering, manufacturing and construction and 4% obtained a degree in ICT. Using higher earnings as a proxy for market demand, these figures suggest a potential imbalance in some countries between the fields most in demand by the labour market and the current supply of graduates. Indeed, this imbalance may help explain the high earnings premium for these fields in some countries (see Box A1.1 in Indicator A1).
In some countries, the difference in earnings advantages across fields is relatively small. This is the case in Australia and Finland, where those with the highest-paying degree earn 30-40% more than those with the lowest-paying degree. In other countries, such as the United Kingdom and the United States, those with a degree in the highest-paying field of study earn nearly twice what those with a degree in the lowest-paying field of study earn (Table A4.4). Some of the differences in earnings across fields may be explained by different patterns of full-time versus part-time employment.
In some countries, there are tertiary fields of study that are actually associated with an earnings disadvantage when compared to adults with only upper secondary education. In the United Kingdom, for example, individuals with a tertiary degree in the broad fields of education or arts and humanities, social sciences, journalism and information earn less on average than adults who attained an upper secondary qualification. In the same country, adults with a tertiary degree in engineering manufacturing and construction and natural sciences, mathematics and statistics earn over 60% more than adults with upper secondary education (Figure A4.4).
Data from the few countries able to disaggregate earnings across narrower fields of study highlight the wide discrepancies that may exist within a broad field. For example, within the broad field of health, those with a medical or dental degree earn about twice as much as those with a degree in nursing or associated health field in nearly every country with available data (Table A4.4).
1. Data refer to the field of study at the bachelor's level.
2. Earnings net of income tax.
3. Earnings refer to academic programmes only.
4. Arts and humanities, social sciences, journalism and information does not include the subfield of Languages.
5. Year of reference differs from 2017. Refer to the source table for details.
Countries are ranked in descending order of the relative earnings of 25-64 year-olds with a tertiary degree in information and communication technologies.
Source: OECD (2019), Table A4.4. See Source section for more information and Annex 3 for notes (https://doi.org/10.1787/f8d7880d-en).
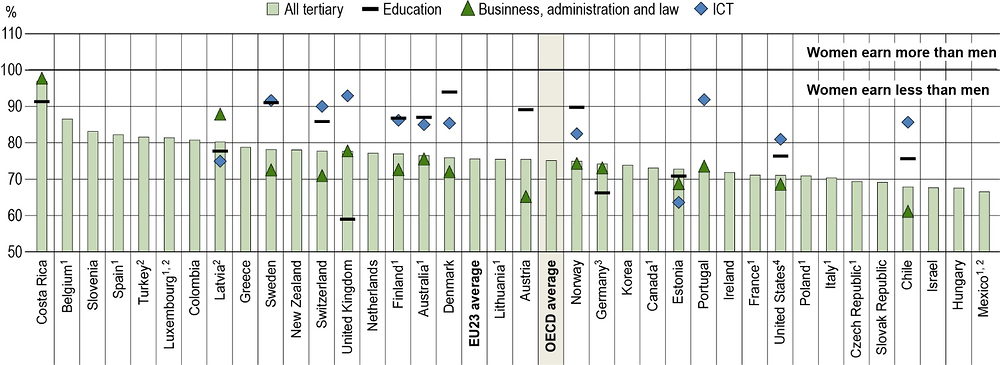
Differences in earnings between women and men, by educational attainment
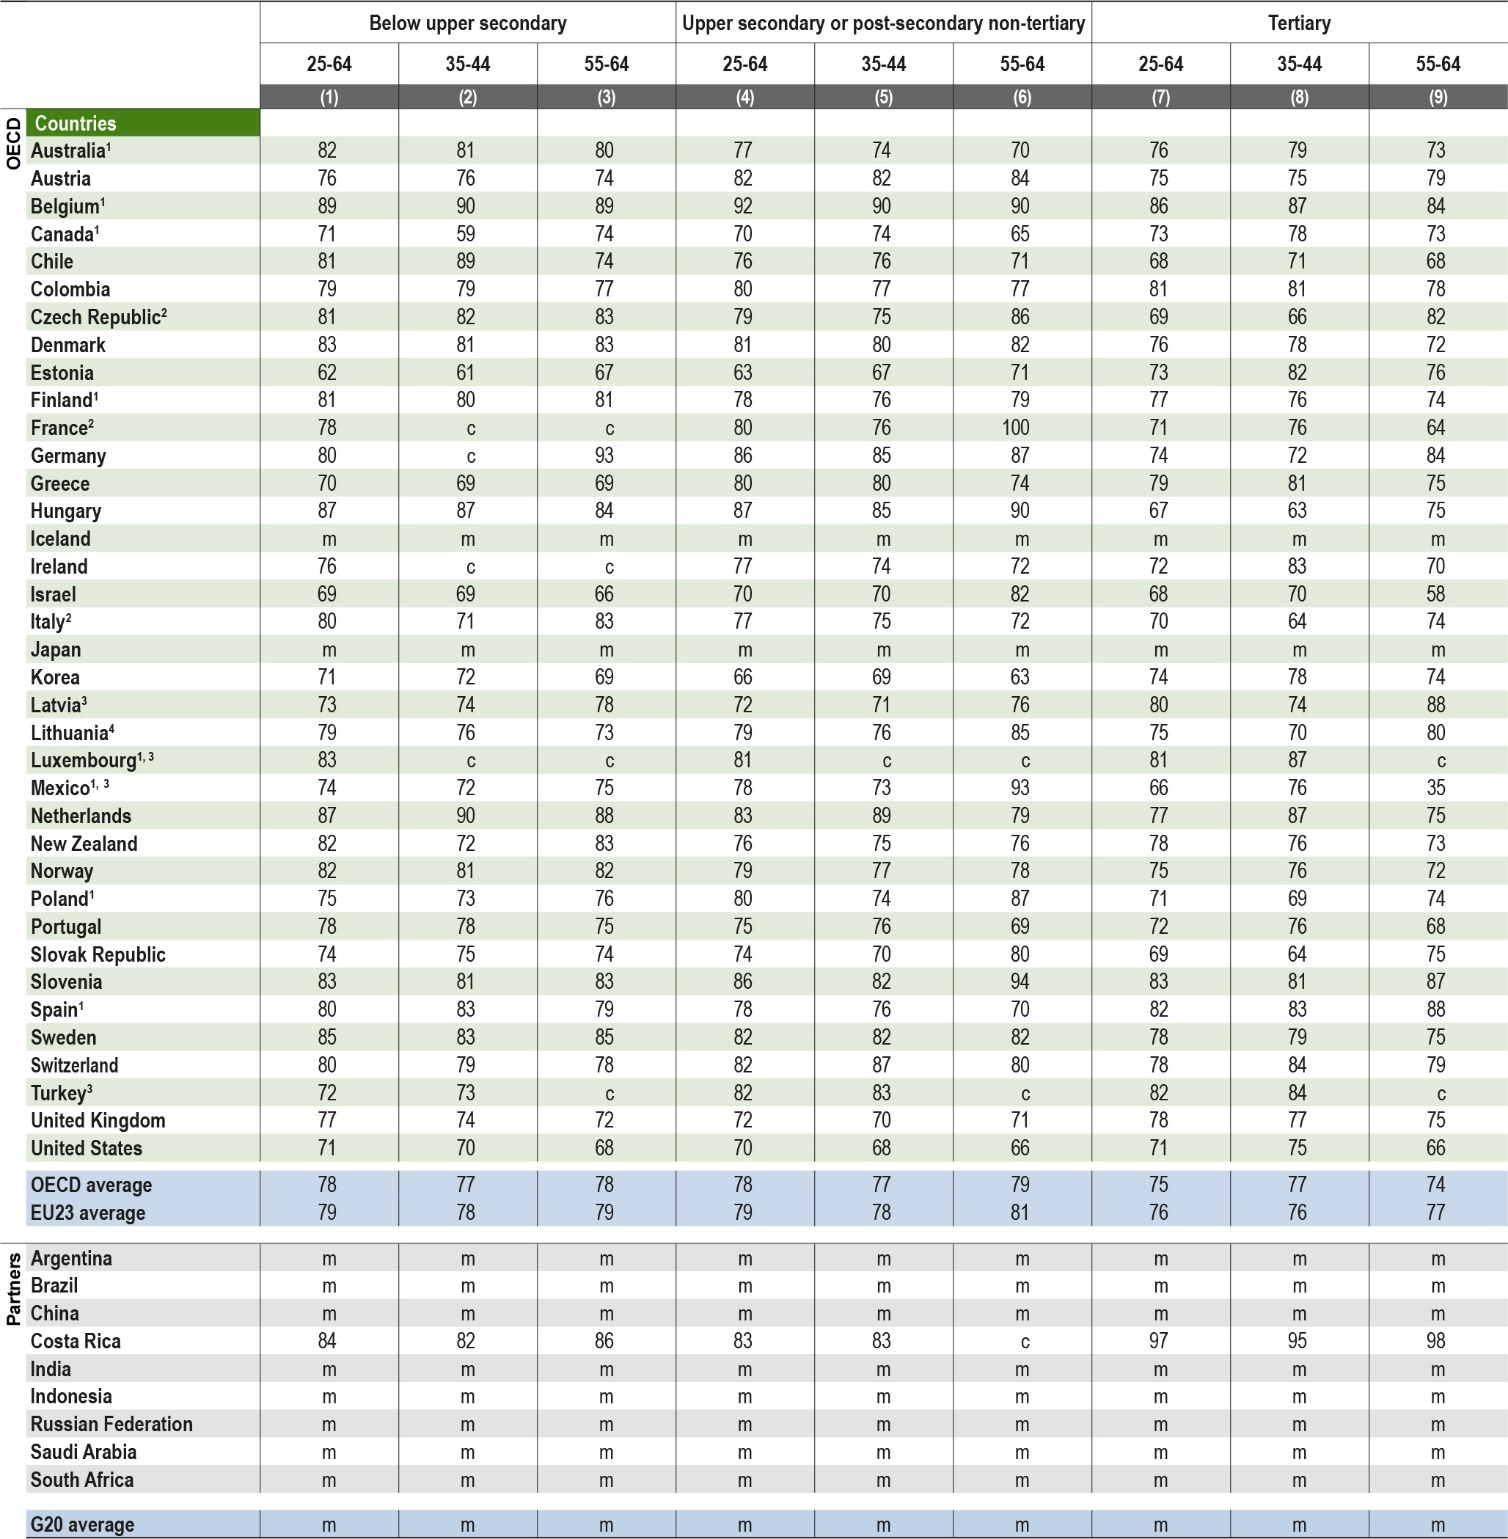
Women do not earn as much as men in any OECD or partner country. Across OECD countries, tertiary-educated women working full time earn only 75% of the earnings of tertiary-educated men. This 25% gap in the earnings of tertiary-educated women is slightly larger than the gap for women with below upper secondary education and for those with upper secondary or post-secondary non-tertiary education (both 22%) (Table A4.3).
As women are more likely to work part time than men, the gender gap in the average earnings of all workers (including full-time and part-time earners) is even larger. On average across OECD countries, tertiary-educated women in full-time or part-time work earn only 69% of the earnings of tertiary-educated men (OECD, 2019[3]).
The reasons for the gender gap in earnings include gender stereotyping, social conventions and discrimination against women (OECD, 2017[4]), but also differences between men and women in their choice of fields of study. Men are more likely than women to study in fields associated with higher earnings, such as engineering, manufacturing and construction or ICT, while a larger share of women enrol in fields associated with lower earnings, including education, and arts and humanities (see Indicator B4).
Nevertheless, Figure A4.5 highlights the fact that women earn less than men even with a degree in the same field of study. Indeed, women’s earnings do not surpass men’s in any field of study with available data – although some fields seem to have been more successful than others in reducing the gender pay gap. In most countries with available data, the gender gap is smaller for the fields of education and ICT and larger for the field of business, administration and the law when compared to the average gap across all fields of study. Additional factors which help explain the gender gap in earnings within the same field of study could include employment in different sectors within the field, career progression, types of occupation and types of contracts.
1. Year of reference differs from 2017. Refer to the source table for details.
2. Earnings net of income tax.
3. Earnings by field refer to academic programmes only.
4. Earnings by field refer to the field of study at the bachelor’s level.
Countries are ranked in descending order of women's earnings (all tertiary) as a percentage of men's earnings.
Source: OECD (2019), Education at a Glance Database, http://stats.oecd.org/. See Source section for more information and Annex 3 for notes (https://doi.org/10.1787/f8d7880d-en).
In recent years, awareness of the differences in pay between men and women has risen. Many countries have introduced new national policies to reduce disparities in earnings between men and women. Some countries have put in place concrete measures, such as pay transparency, to foster equity in pay between men and women (OECD, 2017[4]). In most of the countries with available data, the gender gap between the earnings of tertiary-educated men and women has narrowed between 2010 and 2017. On average across OECD countries with data available for both years, the gap fell by about 1.5 percentage points, reaching just over 5 percentage points in Austria, Estonia and Korea (OECD, 2019[3]).
Definitions
Adults refer to 25-64 year-olds.
Educational attainment refers to the highest level of education attained by a person.
Fields of study are categorised according to the ISCED Fields of Education and Training (ISCED-F 2013). See the Reader’s Guide for a full listing of the ISCED fields used in this report.
Levels of education: See the Reader’s Guide at the beginning of this publication for a presentation of all ISCED 2011 levels.
Methodology
The analysis of relative earnings of the population with specific educational attainment and of the distribution of earnings includes full-time and part-time workers. It does not control for hours worked, although the number of hours worked is likely to influence earnings in general and the distribution in particular. The analysis of differences in earnings between men and women include full-time workers only. For the definition of full-time earnings, countries were asked whether they had applied a self-designated full-time status or a threshold value for the typical number of hours worked per week.
Earnings data are based on an annual, monthly or weekly reference period, depending on the country. The length of the reference period for earnings also differs. Data on earnings are before income tax for most countries. Earnings of self-employed people are excluded for many countries and, in general, there is no simple and comparable method to separate earnings from employment and returns to capital invested in a business.
This indicator does not take into consideration the impact of effective income from free government services. Therefore, although incomes could be lower in some countries than in others, the state could be providing both free healthcare and free schooling, for example.
The total average for earnings (men plus women) is not the simple average of the earnings figures for men and women. Instead, it is the average based on earnings of the total population. This overall average weights the average earnings separately for men and women by the share of men and women with different levels of educational attainment.
Please see the OECD Handbook for Internationally Comparative Education Statistics 2018 (OECD, 2018[5]) for more information and Annex 3 for country-specific notes (https://doi.org/10.1787/f8d7880d-en).
Source
The indicator is based on the data collection on education and earnings by the OECD Labour Market and Social Outcomes of Learning Network (LSO Network). The data collection takes account of earnings for individuals working full time and full year, as well as part time or part year, during the reference period. This database contains data on dispersion of earnings from work and on student earnings versus non-student earnings. The source for most countries is national household surveys such as Labour Force Surveys (LFS), the European Union Statistics on Income and Living Conditions (EU-SILC) or other dedicated surveys collecting data on earnings. About one-quarter of countries use data from tax or other registers. Please see Annex 3 for country-specific notes on the national sources (https://doi.org/10.1787/f8d7880d-en).
Note regarding data from Israel
The statistical data for Israel are supplied by and are under the responsibility of the relevant Israeli authorities. The use of such data by the OECD is without prejudice to the status of the Golan Heights, East Jerusalem and Israeli settlements in the West Bank under the terms of international law.
References
[3] OECD (2019), Education at a Glance Database - Education and earnings, http://stats.oecd.org/Index.aspx?datasetcode=EAG_EARNINGS.
[2] OECD (2018), Education at a Glance 2018: OECD Indicators, OECD Publishing, Paris, https://dx.doi.org/10.1787/eag-2018-en.
[5] OECD (2018), OECD Handbook for Internationally Comparative Education Statistics 2018: Concepts, Standards, Definitions and Classifications, OECD Publishing, Paris, https://doi.org/10.1787/9789264304444-en.
[1] OECD (2017), Education at a Glance 2017: OECD Indicators, OECD Publishing, Paris, https://doi.org/10.1787/eag-2017-en.
[4] OECD (2017), The Pursuit of Gender Equality: An Uphill Battle, OECD Publishing, Paris, https://doi.org/10.1787/9789264281318-en.
Table A4.1 Relative earnings of workers, by educational attainment (2017)
Table A4.2 Level of earnings relative to median earnings, by educational attainment (2017)
Table A4.3 Differences in earnings between female and male full-time workers, by educational attainment and age group (2017)
Table A4.4 Relative earnings of tertiary-educated adults, by field of study (2017)
Cut-off date for the data: 19 July 2019. Any updates on data can be found on line at https://doi.org/10.1787/eag-data-en. More breakdowns can also be found at http://stats.oecd.org/, Education at a Glance Database.
StatLink: https://doi.org/10.1787/888933980849
|
Table A4.1. Relative earnings of workers, by educational attainment (2017)
|
|---|
|
25-64 year-olds with income from employment (full- and part-time workers); upper secondary education = 100
|
 |
|
Note: See Definitions and Methodology sections for more information. Data and more breakdowns available at http://stats.oecd.org/, Education at a Glance Database. |
|
1. Year of reference 2016. |
|
2. Index 100 refers to the combined ISCED levels 3 and 4 of the educational attainment levels in the ISCED 2011 classification. |
|
3. Year of reference 2015. |
|
4. Earnings net of income tax. |
|
5. Year of reference 2014. |
|
Source: OECD (2019). See Source section for more information and Annex 3 for notes (https://doi.org/10.1787/f8d7880d-en). |
|
Please refer to the Reader's Guide for information concerning symbols for missing data and abbreviations. |
|
Table A4.2. Level of earnings relative to median earnings, by educational attainment (2017)
|
|---|
|
Median earnings from work for 25-64 year-olds with earnings (full- and part-time workers) for all levels of education
|
 |
|
Note: See Definitions and Methodology sections for more information. Data and more breakdowns available at http://stats.oecd.org/, Education at a Glance Database. |
|
1. Year of reference 2016. |
|
2. Earnings net of income tax. |
|
3. Year of reference 2015. |
|
4. Year of reference 2014. |
|
5. Data refer to full-time, full-year earners only. |
|
Source: OECD (2019). See Source section for more information and Annex 3 for notes (https://doi.org/10.1787/f8d7880d-en). |
|
Please refer to the Reader's Guide for information concerning symbols for missing data and abbreviations. |
|
Table A4.3. Differences in earnings between female and male full-time workers, by educational attainment and age group (2017)
|
|---|
|
Adults with income from employment (full-time workers), average annual earnings of women as a percentage of men's earnings
|
 |
|
Note: See Definitions and Methodology sections for more information. Data and more breakdowns available at http://stats.oecd.org/, Education at a Glance Database. |
|
1. Year of reference 2016. |
|
2. Year of reference 2015. |
|
3. Earnings net of income tax. |
|
4. Year of reference 2014. |
|
Source: OECD (2019). See Source section for more information and Annex 3 for notes (https://doi.org/10.1787/f8d7880d-en). |
|
Please refer to the Reader's Guide for information concerning symbols for missing data and abbreviations. |
|
Table A4.4. Relative earnings of tertiary-educated adults, by field of study (2017)
|
|---|
|
25-64 year-olds with income from employment (full- and part-time workers); upper secondary education (all fields) = 100
|
 |
|
Note: See Definitions and Methodology sections for more information. Data and more breakdowns available at http://stats.oecd.org/, Education at a Glance Database. |
|
1. Year of reference 2016. |
|
2. Earnings refer to academic programmes only. |
|
3. Earnings net of income tax. |
|
4. Arts and humanities, social sciences, journalism and information does not include the subfield of Languages. |
|
5. Data refer to the field of study at the bachelor's level. |
|
Source: OECD (2019). See Source section for more information and Annex 3 for notes (https://doi.org/10.1787/f8d7880d-en). |
|
Please refer to the Reader's Guide for information concerning symbols for missing data and abbreviations. |
Metadata, Legal and Rights
https://doi.org/10.1787/f8d7880d-en
© OECD 2019
The use of this work, whether digital or print, is governed by the Terms and Conditions to be found at http://www.oecd.org/termsandconditions.