
4. Selecting and grouping students
This chapter describes how students are selected and sorted into different grade levels, schools, programmes and classes. It discusses the length and duration of schooling, attendance at pre-primary school and grade repetition. The chapter then examines the concentration of students in schools, the age at which students are first tracked into general or vocational programmes, and how they are grouped by ability, both between and within classes. These policies are then related to student performance, and to the equity of education systems.
For Australia*, Canada*, Denmark*, Hong Kong (China)*, Ireland*, Jamaica*, Latvia*, the Netherlands*, New Zealand*, Panama*, the United Kingdom* and the United States*, caution is advised when interpreting estimates because one or more PISA sampling standards were not met (see Reader’s Guide, Annexes A2 and A4).
Students with different abilities and interests are found in every grade and school. School systems address this diversity in different ways. In comprehensive systems, students are taught in mixed-ability classes and follow a similar path through education, regardless of their abilities, behaviour and interests. By minimising or delaying the use of grade repetition, tracking and ability grouping, these systems give students greater opportunities to share learning experiences with higher-achieving peers and, at the same time, give “late bloomers” more time to catch up academically. In vertically stratified systems, students of a similar age are enrolled in different grade levels, mainly as a result of grade repetition. In horizontally stratified systems, students of different abilities, behaviour or interests are separated into different schools, programmes and classes so that what is learned (content and difficulty) and how it is taught (pedagogy) can be tailored to better meet students’ needs. This sorting and grouping of students is generally termed educational stratification, which refers to the various ways that schools and education systems organise instruction for students with different abilities, behaviour, interests and pace of learning (Dupriez, Dumay and Vause, 2008[1]; Oakes, 1985[2]).
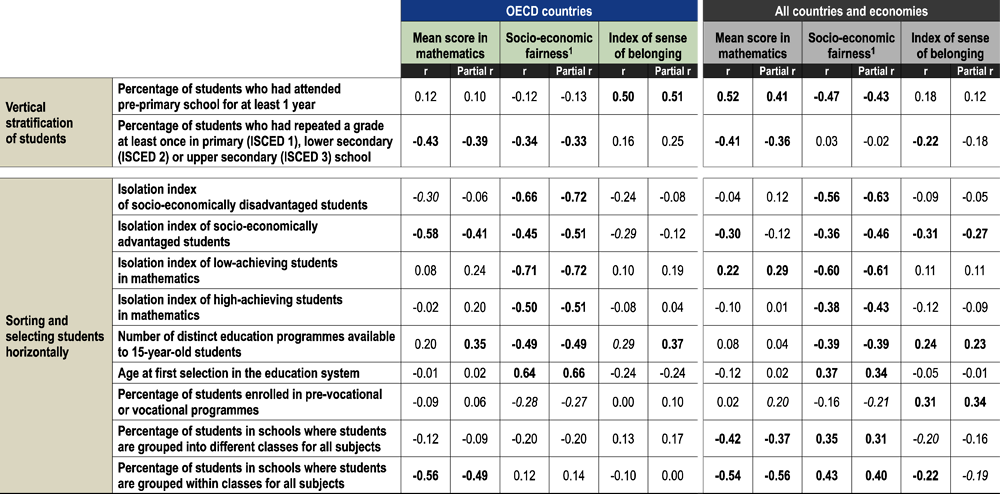
The more stratified an education system is, the more varied the pathways along which students progress through school, and the more likely it is that disadvantaged students are placed in the least academically oriented and demanding learning environments, potentially limiting their educational opportunities (Horn, Keller and Róbert, 2016[3]; Strello et al., 2021[4]; Triventi et al., 2020[5]; Van de Werfhorst and Mijs, 2010[6]). PISA 2022 data show that in OECD countries with more stratification policies in place, students’ socio-economic status was more strongly associated with mathematics performance (i.e. greater socio-economic unfairness), as illustrated in Table II.4.1. Of these stratification policies, some were also negatively associated with education systems’ average mathematics performance, even after accounting for per capita GDP. This was observed when considering grade repetition, the concentration of socio-economically advantaged students in schools and grouping students by ability within classes.
In countries with more stratification policies in place, students’ socio-economic status was more strongly associated with mathematics performance.
On average across OECD countries and in a majority of education systems, students who had attended pre-primary education for at least one year were considerably less likely to have repeated a grade than students who had never attended pre-primary education or who had attended for less than one year, even after accounting for socio-economic factors.
Iceland, Israel, Japan, Korea, Mexico, Norway and the United Kingdom promote students automatically to the next grade level in both primary and lower secondary school.
Early tracking and selective admissions procedures are related to the concentration of socio-economically advantaged and disadvantaged students in schools.
In equitable and high-performing education systems, almost all students had attended pre-primary school; few students had repeated a grade; socio-economically advantaged and disadvantaged students were not heavily concentrated in certain schools; students were tracked into different curricular programmes relatively late; and comparatively few students were grouped by ability between classes.
However, grouping students of similar abilities and interests together may enable teachers to tailor their instruction level and teaching strategies to students’ skills and interests, potentially benefitting low- and high-achieving students (Duflo, Dupas and Kremer, 2011[7]). In addition, well-resourced and attractive vocational programmes may improve the career prospects of low-achieving and disadvantaged teenagers, especially those at risk of leaving the school system early (Bartlett, 2009[8]).
The effect of stratification on student outcomes is the subject of ongoing debate; yet global trends show that, since the 1960s, education systems have shifted away from tracking practices towards more comprehensive approaches, especially at the lower secondary level (Furuta, 2020[9]). The COVID-19 pandemic may have further accelerated some of these “destratification” policies. Some education systems, for instance, eased the criteria for promoting students to the next grade level in the wake of school closures. But is there anything left of these emergency measures? And are education systems less stratified today than they were before COVID-19? Unfortunately, PISA data can only provide tentative answers to these questions because some of the questions on stratification, particularly those related to attendance at pre-primary school and grade repetition, refer to 15-year-old students’ academic pathways before the pandemic started. Despite these limitations, evidence in this chapter shows that the OECD education systems examined were somewhat less stratified in 2022 than they were in 2018, at least with regard to attendance at pre-primary school, grade repetition and ability grouping (Tables II.B1.4.4, II.B1.4.13, and II.B1.4.29).
This chapter starts by describing the length and duration of schooling, the patterns of attendance at pre-primary education, which has become a normal – and often compulsory – part of students’ trajectory through education, and grade repetition (Figure II.4.1). The second part of the chapter considers three types of horizontal stratification: that which occurs between schools, typically referred to as concentration of students in schools; that which occurs between instructional programmes, usually known as tracking; and that which occurs within schools, typically labelled ability grouping. The chapter also analyses how these stratification policies and practices are related to education outcomes, and how these relationships may have been altered during and since the COVID-19 pandemic.
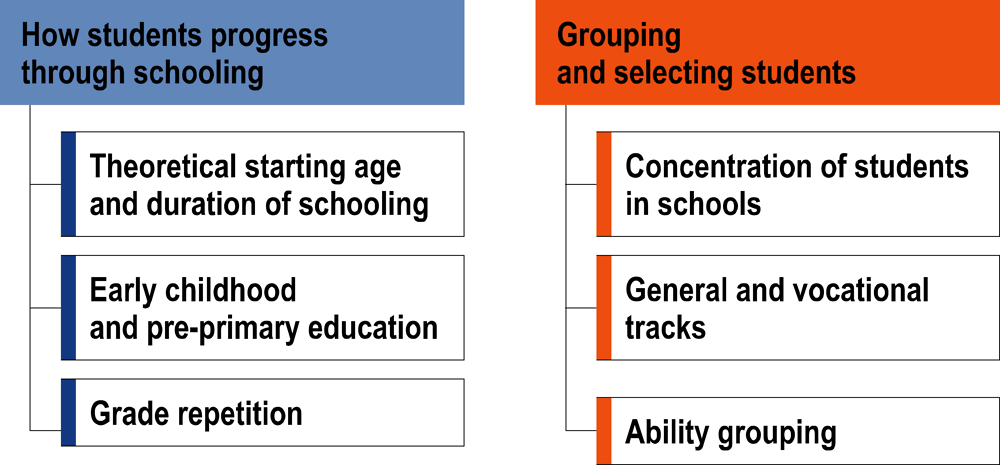
Figure II.4.2 classifies education systems according to three key stratification policies: how early students are selected into different curricular programmes (early tracking); the prevalence of grade repetition; and how common it is for schools to group students by ability between classes (for all subjects). Education systems are considered to resort to a particular stratification policy if the values are below (for age at selection) or above (for grade repetition and ability grouping) the OECD average.
According to this analysis, the largest group is composed of comprehensive education systems, that is, those that resorted to the three stratification policies less frequently than on average across OECD countries. The OECD countries in this group are: Denmark*, Estonia, Finland, Greece, Iceland, Ireland*, Japan, Korea, Latvia*, Mexico, New Zealand*, Norway, Poland, Slovenia, Sweden and the United Kingdom*. At the other end of the spectrum, seven education systems, including Costa Rica, the Netherlands* and Switzerland, resorted to all three stratification policies more frequently than on average across OECD countries. Some countries/economies relied mostly on one stratification policy. For instance, Chile, France, Portugal and Spain had a relatively high proportion of grade repeaters; Israel tended to sort students by ability between classes; and the Czech Republic, Hungary, Italy, Lithuania and Türkiye, all began tracking students relatively early in their education. The remaining education systems combined two of the stratification policies. For instance, the Slovak Republic stood out for tracking relatively early and grouping students by ability; Colombia for grouping students by ability and having a relatively high proportion of grade repeaters; and Austria, Belgium and Germany for tracking students early and having a high prevalence of grade repetition.
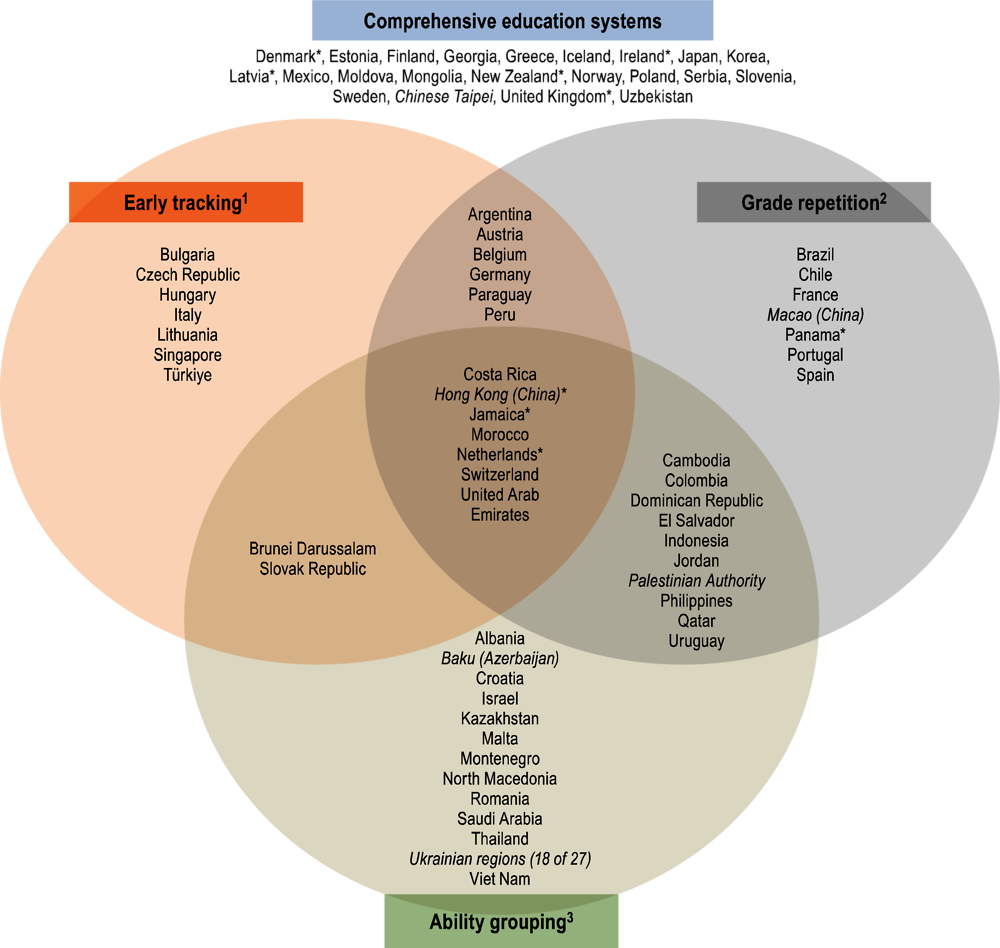
1. Education systems placed in the early tracking circle are those where students were selected into different curricular programmes at age 14 or earlier (OECD average is 14.3 years).
2. Education systems placed in the grade repetition circle are those where the percentage of students who had repeated a grade at least once in primary or secondary education was above the OECD average (9.0%).
3. Education systems placed in the ability grouping circle are those where the percentage of students enrolled in schools where students were grouped by ability between classes for all subjects was above the OECD average (6.7%).
Source: OECD, PISA 2022 Database, Annex B1, Chapter 4.
The vertical structure of an education system refers to the sequence of grades and levels of instruction that students must progress through in order to complete their schooling. This structure outlines the grades in which students are expected to be enrolled according to their age. But daily educational practice often results in students of a similar age being enrolled in different grade levels. This is typically known as vertical stratification. For example, many students enter pre-primary or primary school at an age that is different from the “theoretical” age at entry established in national legislation. Similarly, some students stay in primary or secondary school longer than others do, often because of grade repetition, while some drop out of school without completing their programme. System-level policies, school characteristics and practices, students’ family background and other outside-of-school experiences are associated with the odds of successfully progressing from one instructional grade or level to the next, and of entering higher education (Bai et al., 2021[10]; Horn, Keller and Róbert, 2016[3]; Shavit and Blossfeld, 1993[11]). Vertical stratification indicators are related mostly to the performance and fairness components of resilience (Table II.B1.4.31).
Pre-primary and upper secondary education are compulsory in some education systems
National laws and regulations formally define the sequence of grades and levels of instruction that students must progress through their schooling by establishing the age at which students are expected to enter different education levels, the duration of these levels of education, and the requirements for students’ entry and graduation. Through its system-level questionnaire, PISA 2022 asked countries to report the age, established by law and regulation, at which students enter pre-primary, primary, lower secondary and upper secondary education (the theoretical starting age), and the number of years of schooling a student is expected to complete before graduating from each of these levels (the theoretical duration or length). The system-level questionnaire also asked the ages between which students are legally required to attend school (compulsory education) at the time the data were collected. Figure II.4.3 summarises this information. The theoretical structure of education systems includes both compulsory schooling and the education levels or years of schooling in which students might enrol on a voluntary basis.
Students in the typical school system are expected to start pre-primary education at the age of 3, primary school at the age of 6, secondary education at the age of 12, upper secondary education at the age of 15, and at 18 they are expected to obtain their upper secondary degree (Figure II.4.3). However, students’ expected trajectories through schooling vary considerably across countries. Instead of starting at the age of 3, pre-primary education begins at the age of 2 in Iceland, Mongolia and Chinese Taipei; at the age of 4 in 14 school systems, and at the age of 5 in Guatemala, Indonesia and the Philippines. Upper secondary education for students in general programmes typically ends when students are 18 years old, but in 9 education systems students can complete this level of education at least one year earlier. In 26 education systems the earliest students in general programmes can complete their upper secondary education is after they turn 19.
In OECD countries, students are typically obliged to attend school between the ages of 6 and 16, whereas in partner countries and economies they are typically required to be schooled until they turn 15 (Figure II.4.3). In some education systems, including those in the Dominican Republic, Israel and Mexico, students are required to attend school for 15 years, from the age of 3 to 18. In Malaysia, by contrast, education is compulsory for only six years. Education systems also need to determine whether compulsory education should start before children are 6 years old, and whether it should be extended until the age of legal adulthood, which is typically set at 18 years. Of the 82 education systems with available data (includes subnational entities in Belgium and the United Kingdom), students in 27 of them are obliged to attend school before they turn 6; in the Dominican Republic, Israel, Mexico, Moldova and Peru school is compulsory for 3-year-olds. Around 1 in 3 school systems extend compulsory education until the age of 18; in Jamaica and North Macedonia teenagers are obliged to remain in school until the age of 19.
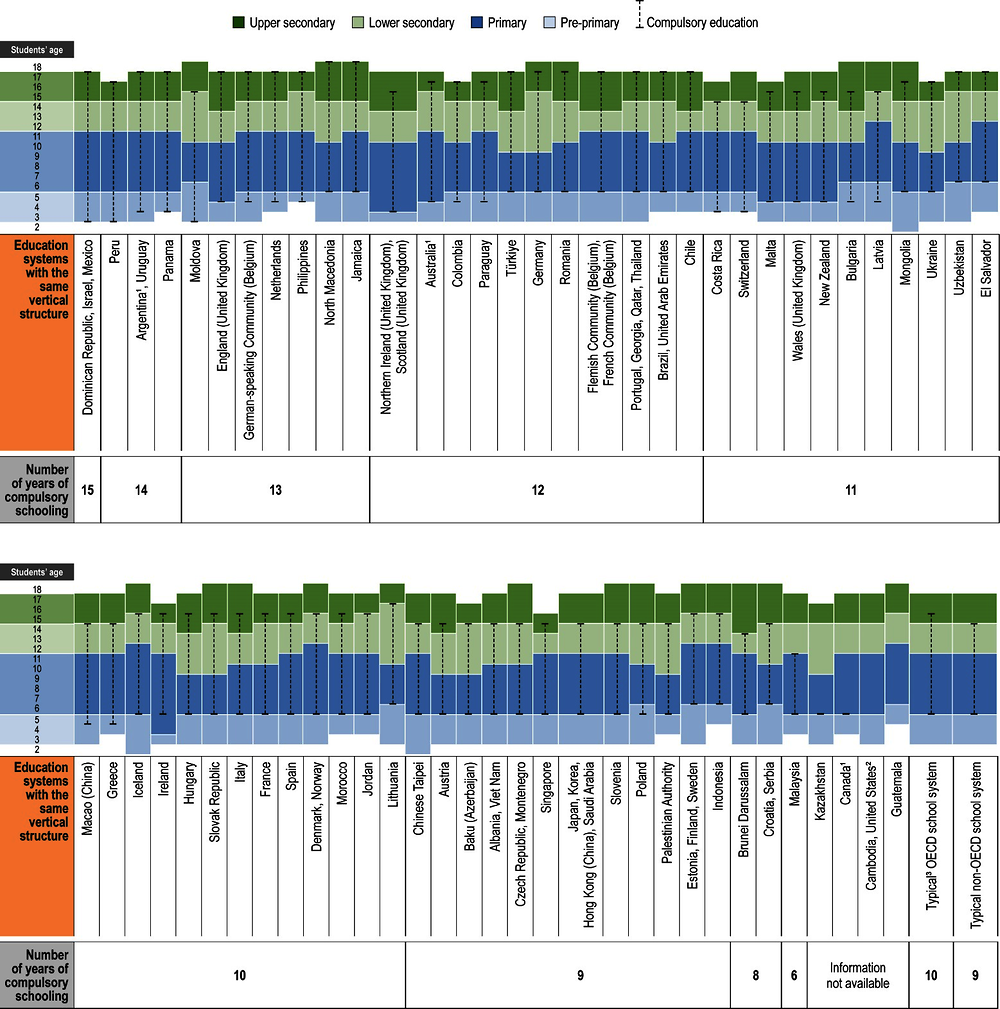
1. There is variation across jurisdictions in the country. Data refer to typical age across jurisdictions. 2. In the United States, official starting age for compulsory education ranges between 5 and 8 years; official end of compulsory education for full-time students in general programmes ranges from 16 to 19 years.
2. Typical is based on modal values across countries and economies. Note: Theoretical starting age is the age at which students are expected to enter an education level according to national law or regulation. The theoretical duration is the number of years of schooling a student is expected to complete before graduating from an education level according to law or regulation. Countries and economies are shown in descending order of the number of compulsory years of schooling. Among education systems with the same number of years of compulsory education, countries/economies are shown in ascending order of the starting age of compulsory education, followed by the age at entry into pre-primary education, primary education, lower secondary and upper secondary education, and duration of upper secondary education.
Source: OECD, PISA 2022 Database, Tables B3.1.1 and B3.1.2.
There are still wide gaps in pre-primary school attendance
As evidence about the importance of high-quality pre-primary education grows (Heckman, 2006[12]; OECD, 2018[13]), enrolment in pre-primary education has become more prevalent around the world (OECD, 2022[14]; UNESCO Institute for Statistics, 2012[15]). Research suggests that a variety of outcomes can be boosted by high-quality pre-primary education, including children’s cognitive development and well-being, later academic achievement and even adult earnings (Duncan et al., 2007[16]; Nordic Council of Ministers, 2012[17]). In this regard, a recent study by UNICEF estimates that the temporary closures of pre-primary schools during the COVID-19 pandemic may have significant adverse effects on the earnings, later in life, of the children whose schools were closed, especially if the learning loss cannot be fully compensated for during subsequent years of schooling (Nugroho et al., 2020[18]).
Attendance at pre-primary school has been shown to improve students’ behaviour, attention, effort and class participation in primary school (Berlinski, Galiani and Gertler, 2009[19]; Taniguchi, 2022[20]). In addition, early education programmes are cost-effective interventions with substantial economic returns to investment, particularly in low- and lower-middle-income countries (Heckman et al., 2010[21]; Richter et al., 2021[22]). The benefits of attendance at pre-primary education tend to be greater for socio-economically disadvantaged children (Suziedelyte and Zhu, 2015[23]). However, the benefits also depend on the quality of the early childhood education and care, as defined by positive staff-child interactions and more exposure to developmental activities, among other factors (Melhuish et al., 2015[24]).
Data from PISA 2022 show that most 15-year-old students reported that they had attended pre-primary education for 3 years or more (57% of students), 2 years (24%), or 1 year (14%), on average across OECD countries (Table II.B1.4.1). In 50 countries/economies, at least 90% of students had attended pre-primary education for at least one year. In Denmark*, Hong Kong (China)*, Hungary, Iceland, Japan, and Macao (China), attending pre-primary education for at least 2 years was virtually universal (more than 95% of students had done so). By contrast, at least 25% of students in Baku (Azerbaijan), Cambodia, the Dominican Republic, Kazakhstan, Kosovo, Morocco, North Macedonia, Saudi Arabia and Uzbekistan reported that they had not attended or that they had attended pre-primary education for less than a year.
Cross-national variations in participation in pre-primary education may be related to several factors. For example, some countries may have lower rates of pre-primary attendance due to longer parental leave, or because there is a culture where infants are cared for in the home. Other countries, such as the United Kingdom, may offer earlier access to primary education and therefore there is less time between birth and primary school for attendance at pre-primary education. However, the main source of cross-country variations is most likely related to the extent to which pre-primary education is available and affordable to all families. To improve the affordability of early childhood education, governments typically build and manage pre-primary schools directly, subsidise private school operators through public grants and tax relief, or support households through vouchers and tax credits (Boeskens, 2016[25]; Doorley et al., 2021[26]; Purcal and Fisher, 2006[27]).
The percentages of 15-year-old students who had attended pre-primary education remained fairly stable between 2018 and 2022, on average across OECD countries (Table II.B1.4.4). While in 2018 93.7% of 15-year-olds had attended pre-primary education for one year or longer, in 2022 the percentage had increased to 94.1%, a small but significant difference. In some education systems, including Baku (Azerbaijan), Indonesia, Kazakhstan, Montenegro, Saudi Arabia and Türkiye, attendance at pre-primary school for at least a year increased by at least five percentage points during the period. Particularly noteworthy is the increase in pre-primary school attendance in Saudi Arabia where the share of 15-year-olds who had attended pre-primary education for at least a year increased from 48% to 71% in the space of four years. By contrast, in Albania, the Dominican Republic and the Philippines there was an increase of at least 3 percentage points in the share of 15-year-olds who had not attended pre-primary education at all, or who had done so for less than a year.
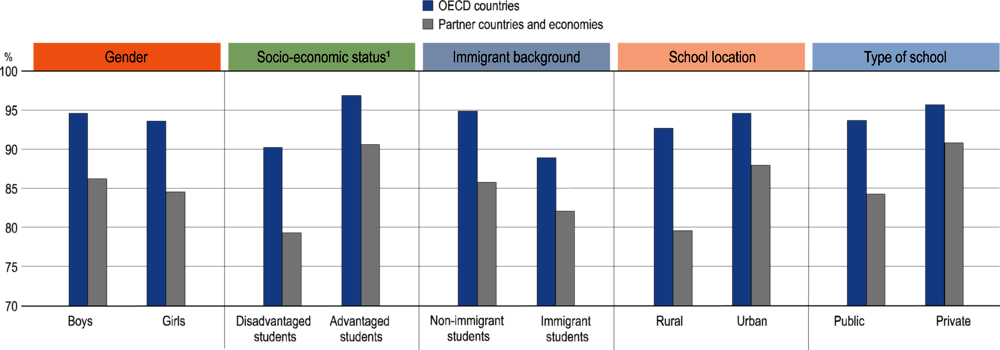
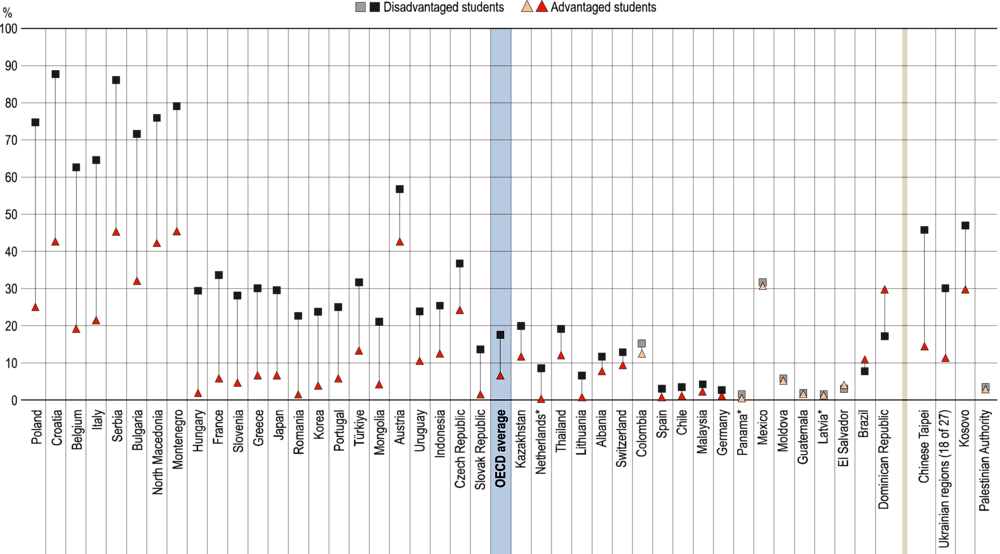
While the gender gap in access to pre-primary education was generally small or negligible in 2022, the socio-economic gap was sizeable (Figure II.4.4 and Table II.B1.4.2). In 66 out of 80 countries/economies for which there are comparable data, socio-economically advantaged students were more likely to have attended pre-primary education than disadvantaged students. In 12 education systems, the socio-economic gap in attendance amounted to more than 20 percentage points. In Türkiye, for instance, 93% of socio-economically advantaged students but only 60% of disadvantaged students had attended pre-primary education for at least one year. Students with an immigrant background were also less likely to have attended pre-primary education than students without an immigrant background, on average across OECD countries. The gap in pre-primary participation related to immigrant background was particularly large in Germany, Jamaica, Jordan, Kazakhstan, Malta, the Netherlands*, Norway, the Philippines, Slovenia, Sweden, Thailand and Türkiye. In Slovenia, for example, 95% of students without an immigrant background had attended pre-primary education for at least one year, compared to 69% of students with an immigrant background.
Access to early childhood education for rural children remains a challenge in many parts of the world, particularly in middle- and low-income countries (Choudhury, Joshi and Kumar, 2023[28]; Temple, 2009[29]; Zaw, Mizunoya and Yu, 2021[30]). PISA 2022 data confirm that fewer students in rural schools had attended pre-primary education than students in urban schools, especially in partner countries/economies (Table II.B1.4.3). In Brunei Darussalam, Cambodia, the Dominican Republic, Guatemala, North Macedonia, Panama*, Qatar and Saudi Arabia participation in pre-primary education was at least 10 percentage points higher among students enrolled in urban schools than among students enrolled in rural schools. In Georgia, Lithuania and Morocco the rural-urban gap surpassed 20 percentage points.
Students who had attended pre-primary education for longer scored better in mathematics than students who had not attended at all or who had attended for only a few months (Table II.B1.4.5). On average across OECD countries, the mathematics score attained by students who had attended pre-primary education for 1 year, 2 years or 3 years or more was higher (11, 17 and 16 score points higher, respectively) than the score attained by students who never attended or who had attended for less than one year, after accounting for socio-economic factors.
1. The socio-economic profile is measured by the PISA index of economic, social and cultural status (ESCS).
Source: OECD, PISA 2022 Database, Annex B1, Chapter 4.
Does attendance at pre-primary education make it less likely that students will repeat a grade?
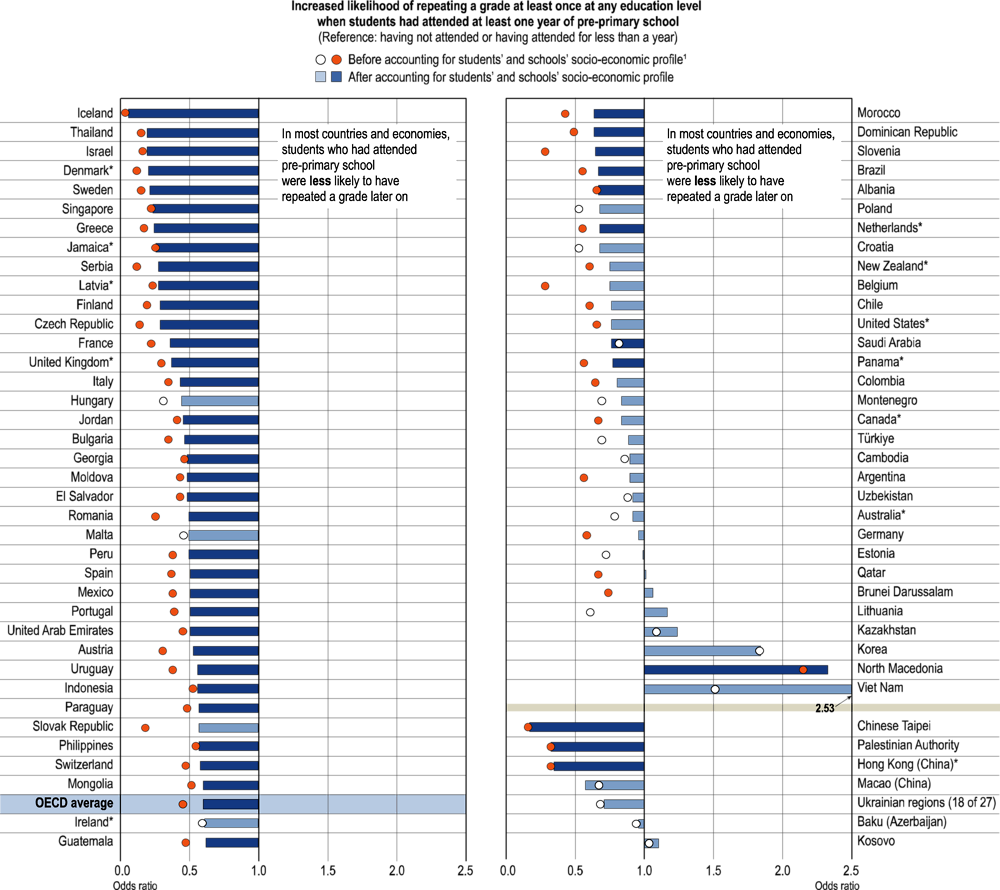
One of the reasons parents enrol their children in early childhood education is to prepare them for regular school, and to help them avoid academic and social problems later. Grade repetition is regarded as one of those problems. While the cross-sectional nature of PISA data cannot establish causality, PISA 2022 results clearly show that, on average across OECD countries and in a majority of education systems, students who had attended pre-primary education for at least one year were considerably less likely to have repeated a grade in any education level than students who had never attended pre-primary education or who had attended for less than one year, even after accounting for socio-economic factors (Figure II.4.5).
The education systems with the strongest negative association between attendance at early childhood education and grade repetition were Denmark*, Greece, Iceland, Israel, Malaysia, Singapore, Sweden, Chinese Taipei and Thailand; the only education system with a positive association was North Macedonia. In the case of Thailand, for instance, 15-year-old students who had not attended pre-primary education, or had done so for less than one year, were about 5 times more likely to have repeated a grade than students who had attended for one year or longer.
1. The socio-economic profile is measured by the PISA index of economic, social and cultural status (ESCS).
Note: Significant odds ratios are shown in a darker tone (see Annex A3).
Countries and economies are ranked in ascending order of the increased likelihood (odds ratio) of repeating a grade at least once at any education level when the student had attended pre-primary school for at least one year (ref: not having attended or having attended for less than a year), after accounting for students' and schools' socio-economic profile.
Source: OECD, PISA 2022 Database, Annex B1, Chapter 4.
Grade repetition: A vanishing practice
Grade repetition is the practice of requiring students to remain in the same grade level for an additional year, instead of promoting them to the next grade along with their peers of the same age. School leaders and teachers, sometimes in consultation with parents, are responsible for decisions on who will be promoted or retained, sometimes within guidelines or regulations coming from national or other levels of government (European Commission, 2011[31]). Students are typically required to repeat a grade when they do not perform well academically, but other factors, such as behaviour, fluency in the language of instruction and students’ background characteristics, may also play a role. In this regard, PISA 2015 data revealed that boys, socio-economically disadvantaged students, and students with an immigrant background were more likely to have repeated a grade, even after accounting for test performance and school-related attitudes and behaviours (OECD, 2016[32]).
The intended purpose of grade repetition is to give students a “second chance” to master the knowledge and skills appropriate for their grade level. If the curriculum is cumulative and further learning depends on a solid understanding of what had been previously learned, then promoting students regardless of their mastery of the content might put low-performing students in an increasingly difficult position at higher grades. For some of these students, repeating a grade may improve their academic achievement (Jacob and Lefgren, 2004[33]). Removing the “threat” of grade repetition may also have a negative impact on students’ willingness to put effort into their schoolwork (Zhang and Huang, 2022[34]).
However, previous studies have shown that this “threat” effect is far from universal (Cabrera-Hernandez, 2022[35]), and that any short-term gains in test scores associated with grade repetition tend to disappear in the long run (Alet, Bonnal and Favard, 2013[36]). Previous research has, in fact, found mostly negative effects of grade repetition on student outcomes. For instance, students who had repeated a grade tend to perform less well in school and hold more negative attitudes towards school at age 15 than students who had not repeated a grade in primary or in secondary education; they are also more likely to drop out of high school (Ikeda and García, 2014[37]; Manacorda, 2012[38]). In addition, grade repetition can be a costly policy, as it generally requires greater expenditure on education and delays students’ entry into the labour market (Education Endowment Foundation, 2023[39]; OECD, 2013[40]).
PISA uses a self-reported measure of grade repetition based on students’ responses to questions in the student questionnaire that ask at which education level (primary or secondary) and how often (never, once or more than once) they had repeated a grade. In interpreting the results, it is important to bear in mind that, since most of 15-year-olds’ school years took place before the pandemic, PISA 2022 results should only partially reflect the COVID-19 effect on grade repetition rates (if there is such an effect).
On average across OECD countries in 2022, 9% of students reported that they had repeated a grade at least once in either primary or secondary school (Figure II.4.6 and Table II.B1.4.10). In 36 countries/economies, 5% of students or less had repeated a grade. This group includes Japan and Norway, where the question was not asked to students, but where grade repetition is expected to be close to zero given that a policy of automatic promotion is in place at the primary and lower secondary levels and all, or virtually all, students were enrolled in the same grade level (Tables B3.4.2 and II.B1.4.7). In 14 countries, more than 20% of students had repeated a grade; in Colombia almost 40% of students had repeated a grade, and in Morocco around 46% of students had done so.
Consistent with the downward trend observed in earlier PISA assessments (OECD, 2020[41]), the share of 15-year-olds who had repeated a grade continued to decline between 2018 and 2022. While in 2018 about 11% of 15-year-olds had repeated a grade at least once, on average across OECD countries, in 2022, 9% of students had so done, a decline of almost 2 percentage points (Table II.B1.4.13). The largest drops, of at least six percentage points, were observed in Argentina, Brazil, Chile, Costa Rica, the Dominican Republic, Guatemala, Macao (China), Mexico, Panama*, Peru, Portugal, Spain and Uruguay. The drop in the percentage of students who had repeated a grade over the past two decades was particularly steep in France (see Box II.4.1). In 2003, about 40% of students had repeated a grade in France; by 2015 the percentage had dipped to 22%; and in 2022 only 11% of students had repeated a grade (Figure II.4.7). By contrast, in a few education systems, particularly Albania, the Netherlands*, the Philippines and the Slovak Republic, the proportion of students who had repeated a grade grew during the 2018-2022 period.
In almost all school systems, repeating a grade was more common among boys than among girls, and the gender gap was larger in those education systems with a higher incidence of grade repetition (Table II.B1.4.11). Furthermore, in 63 countries/economies disadvantaged students were more likely than advantaged students to have repeated a grade (Figure II.4.6). On average across OECD countries, a disadvantaged student was more than three times as likely as an advantaged student to have repeated a grade at least once. Students with an immigrant background were also more likely to have repeated a grade; this was observed in 47 education systems. In half of these education systems, students with an immigrant background were at least three times more likely to have repeated a grade. In Finland, for instance, only 2% of students without an immigrant background but 13% with an immigrant background had repeated a grade at least once.
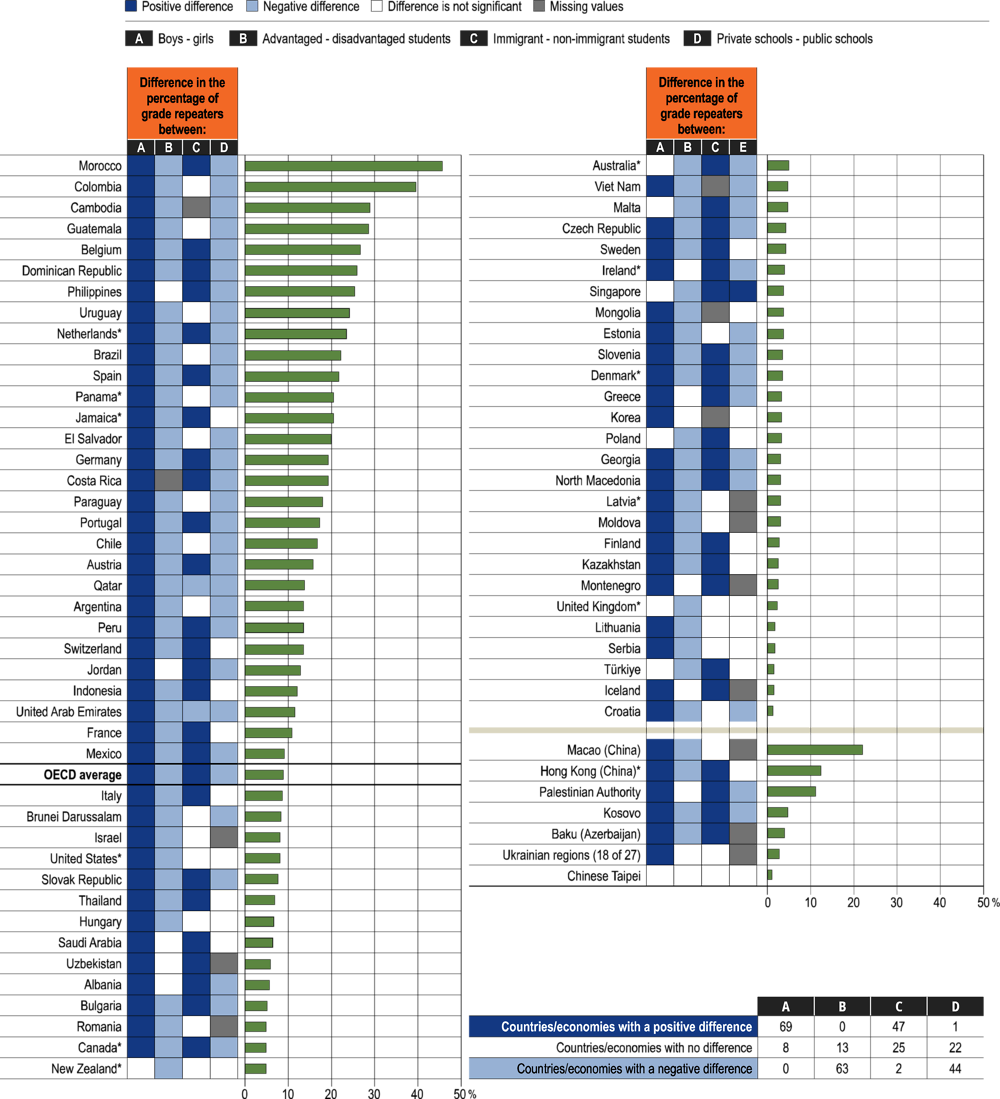
Note: Questions about the type of school were not asked in the Flemish-speaking Community of Belgium. Data for Belgium represent only the French-speaking and German-speaking Communities.
Countries and economies are ranked in descending order of the percentage of students who had repeated a grade at least once.
Source: OECD, PISA 2022 Database, Annex B1, Chapter 4.
The French education system has traditionally been characterised by an exceptionally high number of grade repeaters. Not anymore. In 2003, almost four in ten 15-year-old students in France had repeated a grade at least once; nearly two decades later, the proportion had dropped to just one in ten (Figure II.4.7a). While in 2009, France had the third-highest percentage of grade repeaters among all OECD countries, only behind Costa Rica and Luxembourg (OECD, 2016), in 2022 the share of grade repeaters in France was just slightly above the OECD average. As this most recent PISA test shows, grade repetition rates in France were lower than those in Austria, Belgium, Chile, Colombia, Costa Rica, Germany, the Netherlands, Portugal, Spain and Switzerland (Figure II.4.6). Interestingly, before the COVID-19 pandemic hit, this drop in grade repetition rates was not accompanied by a decline in mathematics performance (Figure II.4.7b), nor by an improvement in socio-economic fairness in France (Figure II.4.7c), at least when compared to other OECD countries.
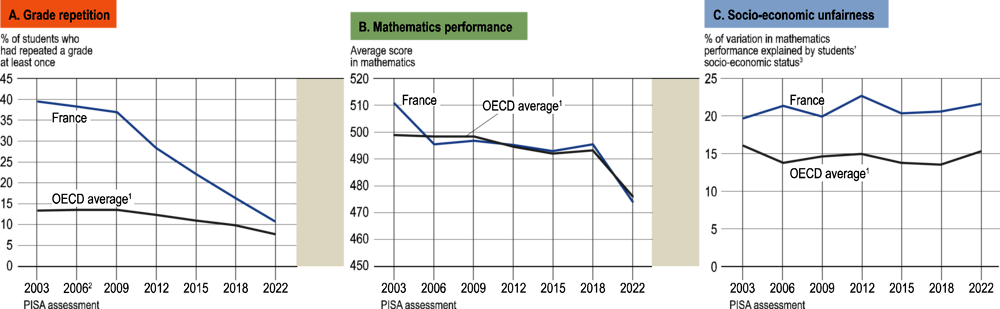
1. The OECD average includes 20 countries with results for all assessments since 2003.
2. The question on grade repetition was not asked in PISA 2006.
3. The socio-economic status of students is measured by the PISA index of economic, social and cultural status (ESCS).
Source: OECD, PISA 2022 Database.
Why did the incidence of grade repetition in France decline so sharply? While there may be many reasons, the main factor is probably related to changes in the regulations on grade repetition. In 2013, grade repetition was rendered an exceptional measure (LOI n° 2013-595 du 8 juillet 2013 d'orientation et de programmation pour la refondation de l'école de la République); one year later it was prohibited in pre-primary school, and only permitted in cases where students in primary or lower secondary school suffered serious disruptions to their learning, for instance because of long-term illness (Décret du 18 novembre sur le suivi et l´accompagnement pédagogique des élèves). More recently, the French government backtracked, clarifying that holding back a student who is facing difficulties is not prohibited (except in pre-primary school where pupils are still automatically promoted), and that the decision should be made by the Council of Teachers (in primary school) or by the school principal (in lower secondary school) (Décret n° 2018-119 du 20 février 2018 relatif au redoublement). However, repeating a grade should remain an exception and, when prescribed, should be accompanied by a programme that encourages individual academic success (Programme personnalisé de réussite educative).
Where this regulatory back-and-forth will take the French education system is still an open question. One thing seems clear: if grade repetition becomes the default policy again, the education system will need to dedicate more resources to cover all the additional school years that students are held back. To avoid the ballooning of costs associated with grade repetition (Benhenda and Grenet, 2015[42]), French schools will need to make the most of existing support programmes, such as Remise à niveau and Activités pédagogiques complémentaires in primary education and Devoirs faits in lower secondary education, to support struggling students before they are required to repeat a grade.
Remise à niveau are support programmes where low-achieving students in primary education learn French and mathematics in small groups during three separate holiday weeks. Activités pédagogiques complémentaires are differentiated instruction actions whereby struggling students in primary education are offered support activities to awaken and strengthen their desire for learning. Devoirs faits is a study-help programme offered in lower secondary schools to ensure that all students, especially those whose parents cannot support them academically, can complete homework assignments.
Some education systems promote all students to the next grade level
Through its system-level questionnaire, PISA 2022 asked countries to describe the regulations regarding grade repetition in primary and lower secondary education for students enrolled in both general and vocational programmes. Across countries and economies that participated in PISA 2022, the policy of automatic promotion (i.e. no grade repetition) was adopted by approximately 28% of education systems for primary education and by 24% of systems for lower secondary education. The school systems incorporating automatic promotion at both primary and lower secondary levels include Iceland, Israel, Japan, Korea, Mexico, Norway and the United Kingdom. Among the education systems that use grade repetition, approximately 55% impose some sort of restriction on its use, typically allowing it only in certain grades or limiting the times a student can repeat; 45% of these systems do not impose any limitation.
The prevalence of grade repetition, as reported by students, varies depending on how education systems regulate the practice (Figure II.4.8). In education systems with automatic promotion in primary education, 3.6% of students had repeated a grade at least once in primary education; 6.7% of students had repeated a grade at least once in the education systems that allow grade repetition with restrictions; and 7.6% of students had repeated a grade at least once in the education systems that allow grade repetition without restrictions. Similarly, in the education systems with automatic promotion at the lower secondary level, 3.1% of students had repeated a grade at least once in lower secondary education; 4.8% of students had repeated a grade at least once in those systems that allow grade repetition with restrictions; and 5.6% of students had repeated a grade at least once in the education systems that allow grade repetition without restrictions. These results suggest that education systems that aim to reduce the share of grade repeaters may reasonably expect to achieve their goal by imposing certain restrictions on grade repetition or eliminating the practice altogether. However, the results also indicate that other factors may be at play, such as cultural traditions and societal beliefs about the benefits of grade repetition or students falling sick for a long period, that may limit the effectiveness of the regulations. Also, some grade repeaters who emigrated recently may have repeated a grade in their previous education system, which may slightly overestimate the prevalence of grade repetition in education systems with automatic grade promotion.
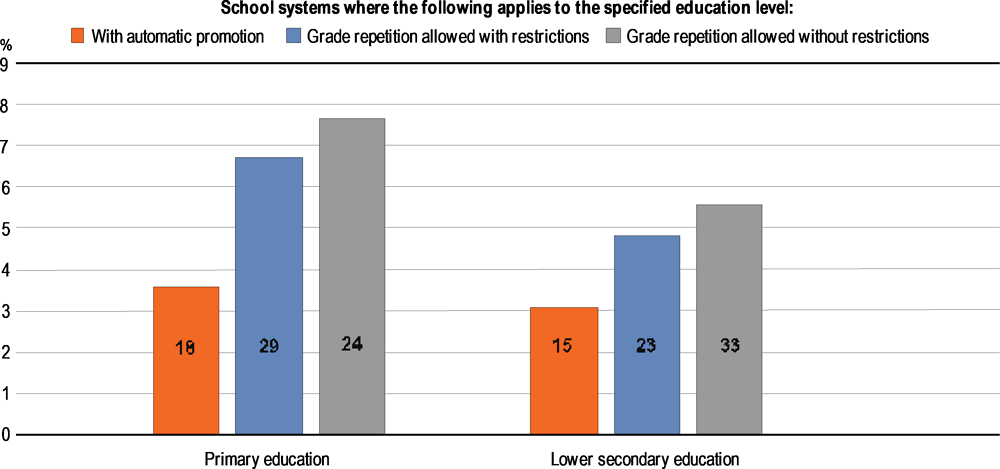
Notes: The number of education systems in each group is shown inside the columns.
For this analysis, the French-speaking and Flemish-speaking communities of Belgium are included as separate entities because they reported different regulations on grade repetition. The German-speaking community (Belgium) did not provide information.
Source: OECD, PISA 2022 Database, Annex B1, Chapter 4, and Tables B3.4.1 and B3.4.2.
Do teachers in education systems with automatic grade promotion provide greater support to students?
Policy makers, teachers and parents in education systems where grade repetition is allowed may wonder how education systems with automatic grade promotion handle students with inadequate knowledge and skills who would have been held back in their system. Education experts often argue that grade repetition should be replaced with additional and effective support to struggling students, following a more mastery-based approach to learning. According to this approach, students are expected to spend time on a task until they achieve full proficiency, receiving support from teachers when necessary. But do teachers in education systems with automatic grade promotion provide greater teacher support than teachers in education systems where grade retention is allowed?
Grade repetition does not only affect academically struggling students: PISA data have shown that the policy may also target students with negative behaviours and attitudes (OECD, 2016[32]). For this reason, all teachers, but especially those in education systems where grade repetition cannot be the “solution” for misbehaving students, should also consider the socio-emotional dimension of teaching by building positive and healthy relationships with their students. Do teachers in education systems with automatic promotion build healthy relationships with students?
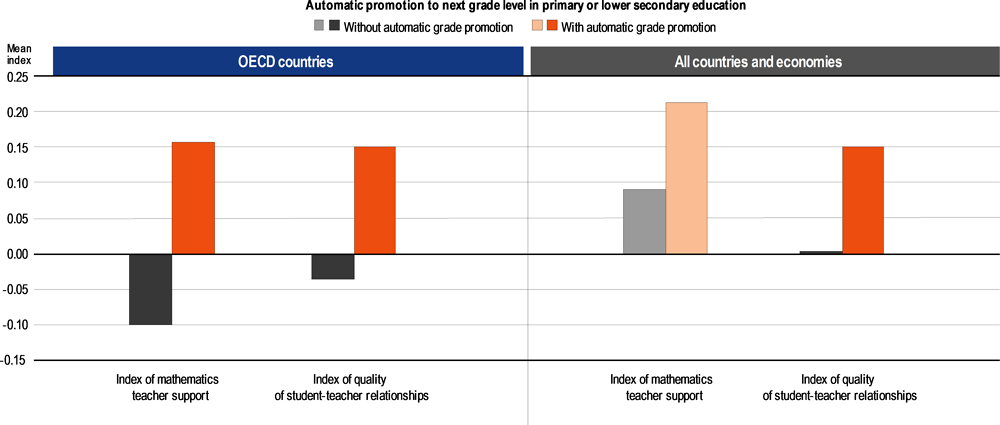
In order to answer these questions, the indices of mathematics teacher support and quality of student-teacher relationships were examined. The index of mathematics teacher support is based on students’ responses to such statements as “The teacher gives extra help when students need it” and “The teacher continues teaching until the students understand”. The index of quality of student-teacher relationships is built on students’ responses to such statements as “When my teachers ask how I am doing, they are really interested in my answer”, and “The teachers at my school are friendly towards me” (for more details on these indices, see Chapter 3).
Students in education systems with automatic grade promotion were more likely than students in education systems without automatic grade promotion to report that their mathematics teachers are supportive, and that they have good relationships with their teachers (when considering the former, the difference is significant only when comparing OECD countries) (Figure II.4.9). For instance, in OECD countries with automatic grade promotion the index of mathematics teacher support had a value of 0.16, which is significantly higher than the value of -0.10 found in OECD countries that practice grade retention.
Note: Statistically significant differences between education systems with and without automatic grade promotion are shown in a darker tone (see Annex A3).
Source: OECD, PISA 2022 Database, Annex B1, Chapter 4.
Students who have repeated a grade multiple times share certain characteristics
The PISA sample does not include students who have dropped out of the school system. However, it does include students who are at a clear risk of leaving school early, some of whom may be close to doing so. Students who skip school regularly tend to be at risk of dropping out entirely. PISA 2018 showed that students who had skipped a whole day of school five times or more in the two weeks prior to the PISA test (but not those who skipped some classes or arrived late for class) scored very low in the reading test (OECD, 2019[43]). Similarly, repeating a grade multiple times during compulsory education indicates that a student is socially, emotionally and academically disengaged from school life. To describe who these students are, the PISA questions on grade repetition in primary, lower secondary and upper secondary school were combined to classify students into three groups: those who had never repeated a grade, those who had repeated only once, and those who had repeated two or more times throughout their academic career.
On average across OECD countries, 91.1% of students had never repeated a grade, 7.2% had repeated a grade once, and 1.7% had repeated a grade more than once (Table II.B1.4.16). The education systems where at least 5% of students had repeated a grade multiple times were: Brazil, Cambodia, Colombia, the Dominican Republic, Guatemala, Jordan, Morocco, the Palestinian Authority, the Philippines, Qatar, the United Arab Emirates and Uruguay. Among OECD countries, Colombia (13% of students), Israel (4.1%), Belgium (4.1%), Portugal (3.9%), Spain (3.6%) and Chile (3.4%), in descending order, had the largest percentages of students who had repeated a grade more than once.
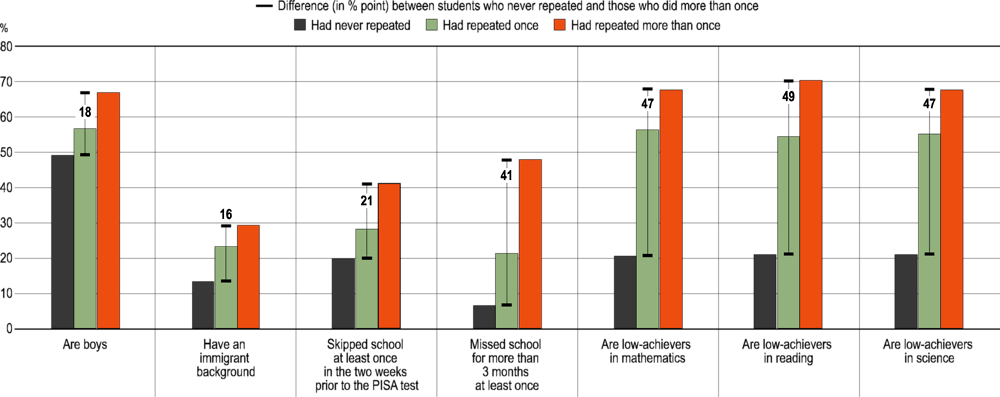
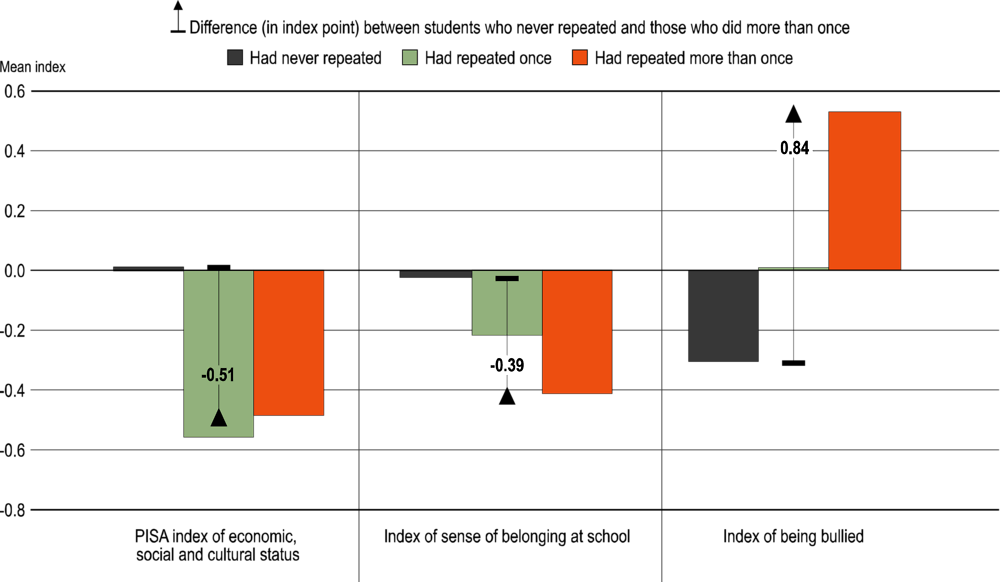
The findings in Figure II.4.10 and Figure II.4.11 clearly show that students who had repeated a grade multiple times display characteristics, attitudes and behaviours that set them apart from students who had never repeated a grade, and even from those who had repeated just once. The multiple repeaters were, in comparison to students who had never repeated a grade, more likely to be boys, socio-economically disadvantaged, with an immigrant background, and low-achievers in mathematics, reading and science. They were more likely to have skipped a whole day of school and missed school for at least three months. They also reported a weaker sense of belonging at school and, contrary to some stereotypes depicting these students as those who bully other students frequently, they reported being the victim of bullying much more frequently than students who had never repeated a grade, or who had repeated just once. While this finding does not mean that these students never bully other students, it does paint a more nuanced portrait of students who have repeated a grade multiple times during compulsory education.
The following results provide clear evidence of the characteristics of multiple repeaters:
About 67% of them were boys, compared to the percentage of boys (49%) among students who had never repeated a grade, and the percentage of boys (57%) among students who had repeated only once
Almost one in three had an immigrant background, compared to one in seven among those who had not repeated a grade
They were twice as likely to have skipped school at least once in the two weeks prior to the PISA test, and seven times more likely to have missed school for a long period, than students who had never repeated a grade
They were more than three times as likely to be low achievers in mathematics, reading and science as students who had always progressed to the next grade level
Their value in the index of being bullied was almost one standard deviation above that observed among students who had never repeated a grade
Keeping these students in school, and ensuring that they acquire the knowledge and skills necessary to lead a productive and satisfying life is an urgent challenge for policy makers, school leaders and teachers, particularly those in education systems with large shares of students who have repeated grades multiple times.
Note: All differences between students who never repeated and those who did more than once are statistically significant (see Annex A3).
Source: OECD, PISA 2022 Database, Annex B1, Chapter 4.
Note: All differences between students who never repeated and those who did more than once are statistically significant (see Annex A3).
Source: OECD, PISA 2022 Database, Annex B1, Chapter 4.
Horizontal stratification refers to the policies and practices used to select and sort students who are enrolled in the same grade or education level into different schools, instructional programmes or ability groups. As with vertical stratification practices, horizontal stratification policies aim to manage students’ heterogeneity in their interests and academic performance, allowing teachers and schools to work with students who have similar levels of knowledge, paces of learning or career prospects. However, research warns that horizontal stratification tends to exacerbate achievement gaps and socio-economic inequality with little effect on average academic performance (Gamoran, 2009[44]). Sorting and grouping processes tend to be not just academically but also socio-economically selective (Gerber and Cheung, 2008[45]; Glaesser and Cooper, 2011[46]; Van de Werfhorst, 2019[47]). Other studies show that early tracking may also hamper students’ civic and political engagement later in their lives, particularly among students not selected for academically oriented programmes (Witschge and van de Werfhorst, 2020[48]).
Three types of horizontal stratification are examined here, all of them related mostly to the fairness component of resilience (Table II.B1.4.31). Horizontal stratification between schools, typically referred as concentration of students in schools, is the extent to which two or more social groups attend the same schools. Horizontal stratification between instructional programmes, usually known as tracking, is the practice of sorting students into academically oriented programmes or vocational programmes. Horizontal stratification within schools or programmes, typically labelled as ability grouping, might occur in two ways: grouping students into different classes or grouping them within the same class.
Composing a student body
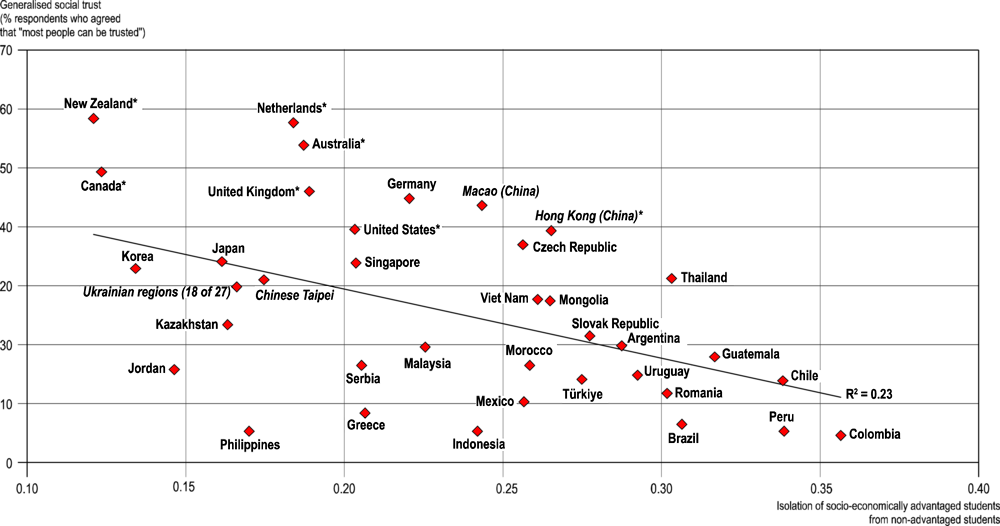
Schools can be places where students with different social backgrounds mingle, but they can also be places where students only, or mostly, meet other students with a similar background. The concentration of students in schools is the extent to which two or more social groups attend the same schools. There are multiple indices to measure school segregation (Frankel and Volij, 2011[49]), including the isolation index used in this section. These indices aim to gauge the opportunities for social interaction between different groups of students within a school. This is important because classmates and schoolmates can have a strong influence on one another (i.e. peer effects) – for better and for worse. They can motivate each other and help each other overcome learning difficulties; but they can also disrupt instruction, require disproportionate attention from teachers, and be a source of anxiety. Recent empirical evidence emphasises that, depending on their own level of ability and gender, some students are more sensitive than others to the composition of their classes (Burke and Sass, 2013[50]; Lavy, Silva and Weinhardt, 2012[51]; Mendolia, Paloyo and Walker, 2018[52]). Moreover, greater social mixing in schools may nurture tolerance towards others (Karsten, 2010[53]), and may thus benefit society as a whole. PISA 2022 data show, for instance, that generalised social trust (the extent to which individuals have trust in other members of society) was higher in countries/economies where socio-economically advantaged students were more likely to share school with less privileged students (Figure II.4.12). However, more social mixing also poses some challenges to teachers and school leaders and, in certain circumstances, may lead to social conflict (Loxbo, 2018[54]).
The concentration of students in schools can be affected by the level of residential segregation in a location, economic inequalities, school admissions and transfer policies (school selectivity), the degree of school competition, the criteria families use to choose a school, the size of the private education sector, and the share of students enrolled in vocational programmes (provided they do not share school premises with students in academically oriented programmes) (Bonal, Zancajo and Scandurra, 2019[55]; Kutscher, Nath and Urzúa, 2023[56]; Wilson and Bridge, 2019[57]). Some of these factors are directly linked to the school system (most of which are examined in Figure II.4.16 and Figure II.4.17), but others, such as the economic inequalities and the levels of residential segregation, are external to the education system.
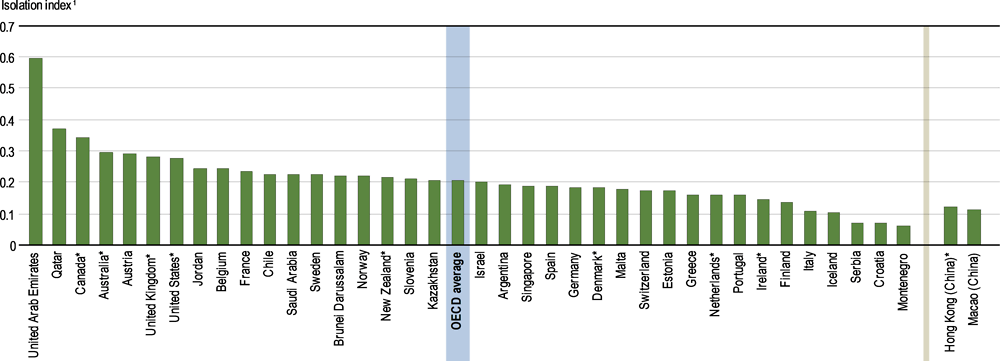
The degree of concentration of students in schools in an education system can be measured in different ways. In this section, the analysis is based on the isolation index, which measures the extent to which certain types of students (e.g. disadvantaged students) are isolated from all other types of students or from a specific group of students (e.g. advantaged students) based on the school they attend. The isolation index is based on the normalised exposure index (see Annex A3 for more details), and ranges from zero to one, where zero corresponds to full exposure and one to full isolation. For instance, if all students are boys in the school attended by the average boy, which would be the case in an education system where there are only single-sex schools, the isolation index for boys (and for girls) would be one. By contrast, if boys and girls were randomly allocated to schools, the isolation index would be zero, or very close to zero. The isolation index has the advantage of being (close to) scale-invariant and bounded (between 0 and 1) (Owens et al., 2022[58]). More importantly, the isolation index not only tells us how unequally distributed a particular group is across an education system, but it also tells us if a group of students is isolated from, or exposed to, other groups of students. When interpreting the findings, it is important to bear in mind that the isolation index is calculated for entire education systems, and not for smaller geographical areas, such as school districts and metropolitan areas, where students transfer from one school to another more frequently. This means that if a group of students is unequally distributed across the territory of a country/economy, their value in the isolation index will be higher. For instance, this might be the case for students with an immigrant background. If they are concentrated in urban areas, which is often the case, the isolation index of these students is likely to be higher when calculated for the entire country/economy.
Note: The isolation index measures the extent to which certain types of students (e.g. disadvantaged students) are isolated from other all other types of students, or from a specific group of students (e.g. advantaged students), based on the schools they attend. It ranges from 0 to 1 where 0 corresponds to full exposure and 1 to full isolation.
Sources: OECD, PISA 2022 Database, Annex B1, Chapter 4, and World Values Survey - Wave 7 (2017-22).
Concentration of socio-economically advantaged and disadvantaged students in schools
In most PISA-participating countries/economies, in 2022 socio-economically advantaged students were more isolated, or more concentrated, in certain schools than their disadvantaged peers (Figure II.4.13 and Table II.B1.4.17). The education systems where advantaged students were most concentrated into certain schools, relative to the concentration experienced by disadvantaged students, were Brazil, Chile, Colombia, Hong Kong (China)*, Morocco, Panama*, Paraguay, Thailand and Uruguay.
The degree to which socio-economically advantaged students were exposed to non-advantaged students, a group that includes both socio-economically average students and disadvantaged students, varied considerably across education systems. In many Latin American countries, such as Brazil, Chile, Colombia, El Salvador, Guatemala, Panama* and Peru, advantaged students were the least likely among their advantaged counterparts in the other PISA-participating countries/economies to encounter non-advantaged students in their school (Figure II.4.13 and Table II.B1.4.17). These countries are usually characterised by having high levels of income inequality and residential segregation, and a prevalence of private schools, which may explain why advantaged students are so often isolated in these education systems. At the other end of the spectrum, advantaged students were most likely to share the same school with non-advantaged students in Canada*, Denmark*, Finland, Iceland, Ireland*, Korea, New Zealand*, Norway, the Palestinian Authority and Uzbekistan.
The concentration of disadvantaged students in some schools followed somewhat different patterns. While the list of countries and economies with the highest levels of concentration of disadvantaged students included some Latin American countries, such as Colombia, El Salvador, Guatemala, Panama* and Peru, it also included the European countries Austria, Bulgaria, the Czech Republic, Hungary, Romania and the Slovak Republic, and Viet Nam (Table II.B1.4.17). Disadvantaged students were more likely to attend schools with non-disadvantaged students in Brunei Darussalam, Finland, Jamaica*, Kosovo, Malta, Montenegro, North Macedonia, Norway and Uzbekistan.
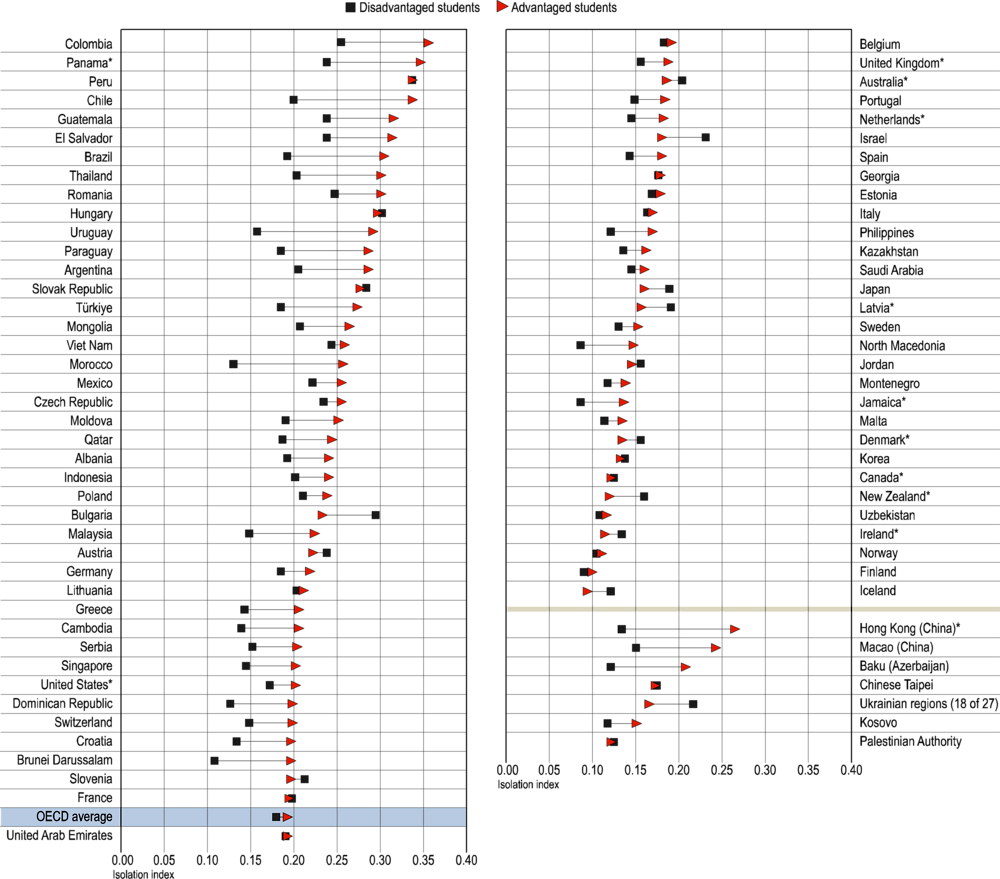
← 1. The isolation index measures the extent to which certain types of students (e.g. disadvantaged students) are isolated from other all other types of students, or from a specific group of students (e.g. advantaged students), based on the schools they attend. It ranges from 0 to 1 where 0 corresponds to full exposure and 1 to full isolation.
Countries and economies are ranked in descending order of the extent to which socio-economically advantaged students were isolated from all other students (i.e. non-advantaged students).
Source: OECD, PISA 2022 Database, Annex B1, Chapter 4.
Concentration of immigrants in schools
The concentration in schools of students with an immigrant background, and the effects that this may have on student outcomes for both native and immigrant students, is a hotly debated issue. Some scholars have shown that having a high concentration of immigrant students may hinder the academic performance of both native and immigrant students (Jensen and Rasmussen, 2011[59]), but others have observed no effects (Hardoy, Mastekaasa and Schøne, 2018[60]), or only effects among immigrants students (Pedraja-Chaparro, Santín and Simancas, 2016[61]; Schneeweis, 2015[62]). Examining the degree to which immigrant students are concentrated in certain schools is nonetheless relevant for policy makers, particularly in those education systems with large shares of immigrant students.
Among the PISA-participating countries/economies where at least 5% of students have an immigrant background (Table I.B1.7.1), the highest levels of concentration of immigrants in schools (values in the isolation index above 0.25) were found in Australia*, Austria, Canada*, Qatar, the United Arab Emirates, the United Kingdom* and the United States* (Figure II.4.14 and Table II.B1.4.17). All of these are education systems where immigrant students represented more than 20% of the student population. However, other education systems with similar proportions of immigrant students, such as Germany, Hong Kong (China)*, Macao (China), Singapore and Switzerland, displayed more moderate levels of concentration of immigrant students across schools. For instance, in Austria the isolation index of immigrant students was about 60% higher than that in Germany, despite having almost the same percentage of students with an immigrant background.
1. The isolation index measures the extent to which certain types of students (e.g. disadvantaged students) are isolated from other all other types of students, or from a specific group of students (e.g. advantaged students), based on the schools they attend. It ranges from 0 to 1 where 0 corresponds to full exposure and 1 to full isolation.
Notes: Only countries and economies where more than 5% of students have an immigrant background are examined.
Countries and economies are ranked in descending order of the extent to which students with an immigrant background were isolated from students without an immigrant background.
Source: OECD, PISA 2022 Database, Annex B1, Chapter 4.
Concentration of low- and high-achieving students in schools
Education systems differ greatly in the extent to which high-achieving and low-achieving students in mathematics share the same schools. Many European countries, such as Austria, Bulgaria, France, Germany, Hungary, the Netherlands*, Romania, the Slovak Republic, and Slovenia and Türkiye, and also Jamaica* and Japan, stood out for displaying high levels in the index of isolation of low- or high-achievers (Table II.B1.4.17). For example, with a value of 0.95 in the isolation index, in the Netherlands* it was virtually impossible for a low-achieving student in mathematics to be enrolled in the same school as a high-achieving student. By contrast, in Baku (Azerbaijan), Denmark*, Estonia, Finland, Iceland, Ireland*, Malta, Norway, Saudi Arabia, Spain, Sweden and Uzbekistan, low-achieving 15-year-olds were most likely to attend the same schools as high-achieving students.
Concentration of boys and girls in schools
Schools are often imagined as having similar numbers of boys and girls. Across OECD countries, the concentration of boys and girls is certainly less prevalent than that based on socio-economic status, immigrant background or academic performance, but it is observed (Table II.B1.4.17). For instance, in Jordan, the Palestinian Authority and Saudi Arabia (values in the isolation index above 0.9), boys were completely, or almost completely, isolated from girls in their schools. In Qatar and the United Arab Emirates (values in the isolation index above 0.5), many boys were isolated from girls in their schools, largely because most (or all) public schools are single-gender schools. Other education systems, such as Austria, Croatia, Ireland*, Israel, Korea, Malta, New Zealand* and Slovenia, also showed significant levels of concentration of boys and girls in certain schools. Single-gender schools are the main reason why gender imbalances across schools were observed, but the prevalence of vocational programmes, which tend to present greater gender disparities than academic programmes, also contributed to this imbalance (see Box III.3.1 in (OECD, 2019[43])). This may explain why, across OECD countries, 15-year-old boys in comprehensive systems like Estonia, Finland, Norway and Sweden were among the least isolated from girls. However, in some highly stratified systems, such as Costa Rica and the Netherlands*, boys and girls were also evenly distributed across schools.
Concentration of other types of students in schools
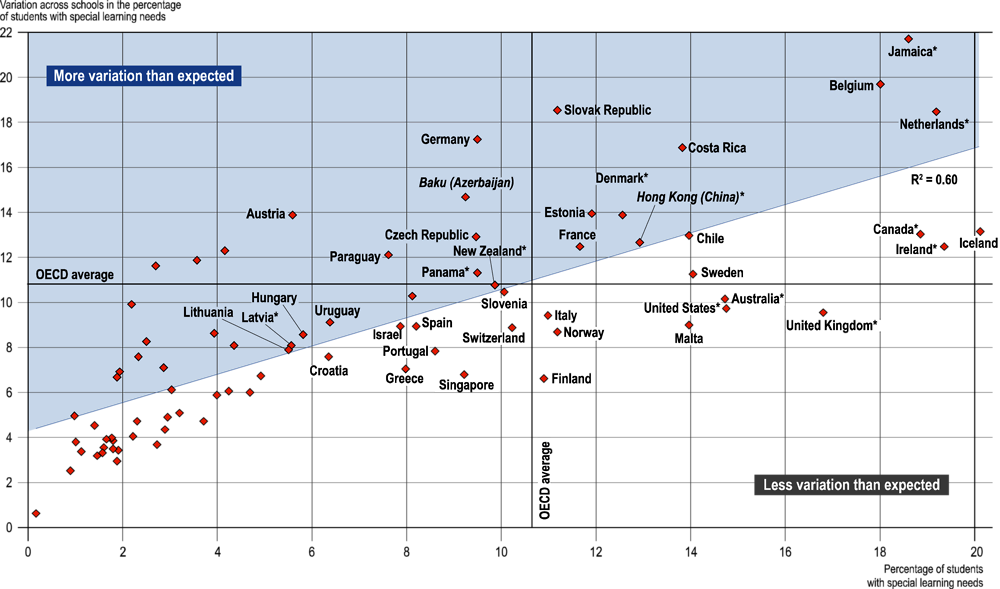
PISA 2022 asked school principals to estimate the percentage of students in their school who have the following characteristics: "Students whose heritage language is different from test language"; “students with special learning needs”; “students from socio-economically disadvantaged homes”; “students who are immigrants (not including refugees)”; “students who have parents who have immigrated”; and “students who are refugees”. Using principals’ answers to this question in a given country/economy, measured by the standard deviation, allows for an estimation of how much these characteristics vary among schools. When interpreting the findings (Table II.B1.4.18), it is important to consider that the standard deviation can describe how much certain student characteristics vary across schools; but this variation will depend on how many students with such characteristics are (identified) in the system. For instance, if an education system rarely labels students as having special learning needs, the variation across schools is likely to be small, at least compared to countries where more students are classified as having special learning needs.
The scatterplot in Figure II.4.15 shows that, according to school principals, some education systems classified few students as having special learning needs. This occurred mostly in middle-income countries/economies where the means to identify and support these students were probably limited. The graph also shows that students with special learning needs were more concentrated in certain schools in some education systems than in others, even if there were similar proportions of these students. For instance, Finland and the Slovak Republic had a similar share of students with special learning needs (11%), but the variation across schools was considerably larger in the Slovak Republic (19 percentage points) than in Finland (7 percentage points). Students with special learning needs were also more unevenly distributed across schools than expected in Austria, Baku (Azerbaijan), Germany and Jamaica*. Some education systems, such as Georgia, Mongolia, North Macedonia and Thailand, had relatively few students with special learning needs, but these students seemed to be concentrated in a limited number of schools. By contrast, some education systems distributed these students more evenly than expected across schools, probably because they favour a more inclusive approach towards students with special learning needs. Except for Finland, Iceland and Malta, this group largely consisted of English-speaking countries, such as Australia*, Canada*, Ireland*, the United Kingdom* and the United States*.
As for the other student characteristics considered, the countries with the largest variations across schools were:
Students whose heritage language is different from the test language: Georgia, Hong Kong (China)*, Indonesia, Qatar and the United Arab Emirates
Students from socio-economically disadvantaged homes: Chile, Colombia, the Dominican Republic, El Salvador and Guatemala
Students who are immigrants (not including refugees): Austria, Germany, Qatar, Singapore and Switzerland
Students who have parents who have immigrated: Australia*, Austria, Canada*, Germany and Qatar
Students who are refugees: Baku (Azerbaijan), Georgia, Hong Kong (China)*, Jordan and the Palestinian Authority.
Early tracking and selective admissions procedures are related to the concentration of socio-economically advantaged and disadvantaged students in schools
Figure II.4.16 and Figure II.4.17 reveal that the concentration of socio-economically advantaged and disadvantaged students in schools is related to some of the stratification and school-choice policies presented in this report, even after accounting for per capita GDP and income inequality in the particular country/economy. Comparing 61 education systems with data for all 13 explanatory variables, the three variables that were associated with the concentration of both socio-economically advantaged and disadvantaged students, measured by the isolation index described above, were the age at which students are first selected into different curricular programmes, the prevalence of ability grouping, and how selective schools are in the admissions process. The earlier students are selected into different academic programmes and the more selective schools are when admitting students, the greater the isolation of advantaged and disadvantaged students in the education system. Interestingly, there was less concentration of advantaged and disadvantaged students in schools in those education systems where students are frequently grouped by ability into different classes. This makes sense, because the need to place students with varying levels of knowledge, skills and interests into different programmes/schools, which typically results in greater separation of these students across schools, may not be as pressing when these differences are already addressed within schools.
Other policies are associated with the concentration of socio-economically advantaged students in certain schools, but not with the concentration of their disadvantaged peers. This is observed in the percentage of students enrolled in private schools and school transfer policies. The larger the share of students attending private schools, the more isolated advantaged students are in certain schools. Also, education systems where it is relatively common to transfer students to another school because they excel academically exhibited higher concentrations of socio-economically advantaged students in certain schools.
Some stratification policies that one would expect to be related to school segregation are not significantly associated with the isolation of advantaged or disadvantaged students when various policies were examined jointly. That is the case when considering the percentage of students in vocational programmes, the degree to which schools compete for students, the proportion of school funding that comes from parents in the form of school fees, and how likely it is for schools to transfer students because of poor performance.
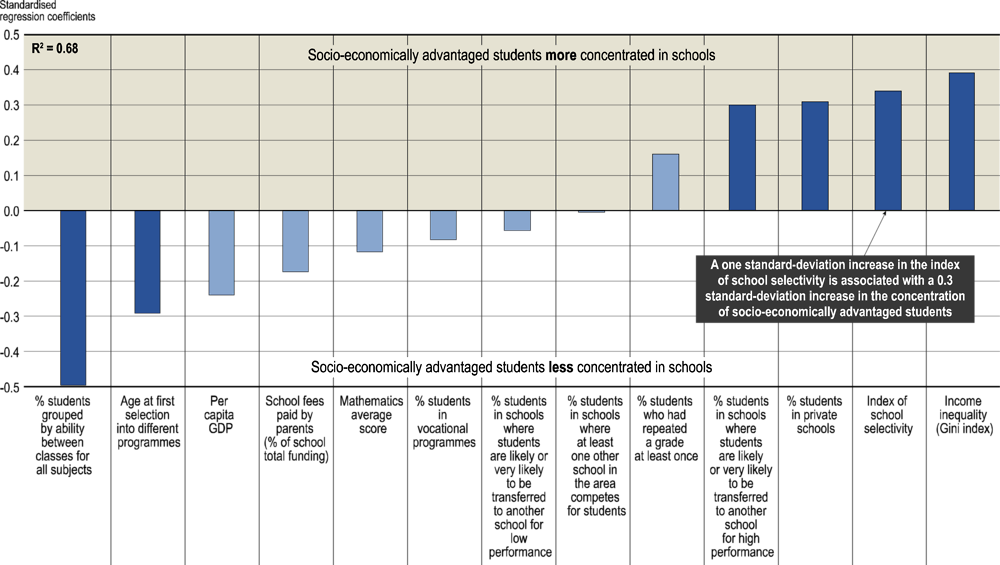
Notes: The explained variable is based on the isolation index, which measures the extent to which certain types of students (e.g. disadvantaged students) are isolated from other all other types of students, based on the schools they attend. It ranges from 0 to 1 where 0 corresponds to full exposure and 1 to full isolation. The analysis is based on a multivariate linear regression analysis of the 61 education systems with available data. All explanatory variables are examined jointly.
Statistically significant coefficients are shown in a darker tone (see Annex A3). Data for the Gini Index come from the World Development Indicators and the OECD database (only for Japan and New Zealand*). The most recent year was used, unless data originate before 2013, in which case they appear as missing.
Variables are ranked in ascending order of the standardised regression coefficient.
Source: OECD, PISA 2022 Database, Annex B1, Chapter 4, and World Development Indicators.
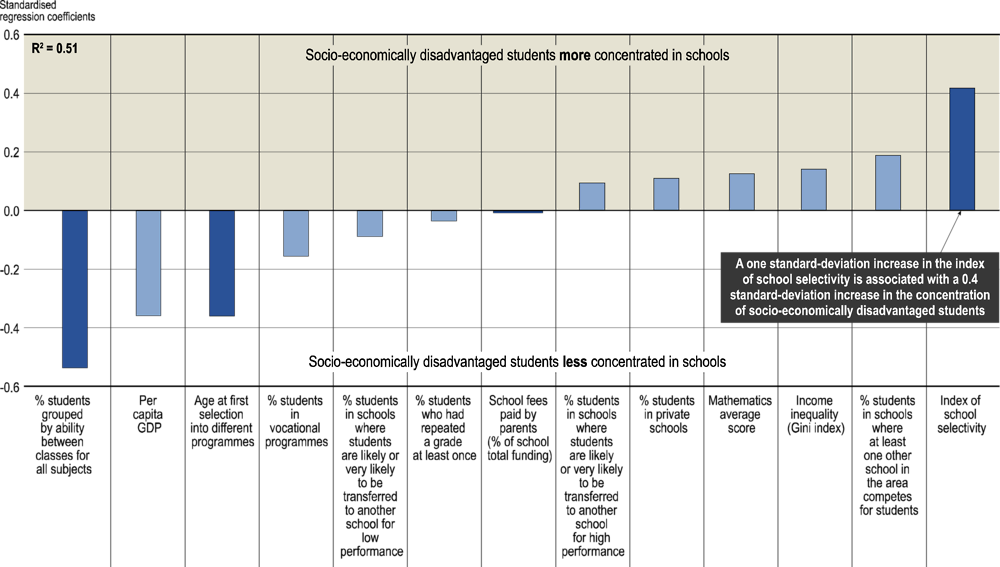
Notes: The explained variable is based on the isolation index, which measures the extent to which certain types of students (e.g. disadvantaged students) are isolated from other all other types of students, based on the schools they attend. It ranges from 0 to 1 where 0 corresponds to full exposure and 1 to full isolation.
The analysis is based on a multivariate linear regression analysis of the 61 education systems with data for all variables. All explanatory variables are examined jointly.
Statistically significant coefficients are shown in a darker tone (see Annex A3).
Data for the Gini Index come from the World Development Indicators and the OECD database (only for Japan and New Zealand*). The most recent year was used, unless data originate before 2013, in which case they appear as missing.
Variables are ranked in ascending order of the standardised regression coefficient.
Source: OECD, PISA 2022 Database, Annex B1, Chapter 4, and World Development Indicators.
In secondary education, the most common form of horizontal stratification between schools, typically known as instructional tracking, consists of sorting students into different education programmes. In education systems that use instructional tracking, some students choose or are selected into academically more demanding programmes, which focus on the general skills required for post-secondary education, while other students choose or are selected for vocational or technical programmes, which focus on the practical skills useful in the labour market (LeTendre, Hofer and Shimizu, 2003[63]; Oakes, 1985[2]; Perry and Southwell, 2014[64]). Often, among these vocational programmes there is a further distinction between those that allow students to access technical universities, which are typically longer in duration and combine academic and vocational subjects, and those channelling students directly into the labour market.
Differentiation among education programmes: Age at selection, and the number and types of study programmes
The age at which students are first tracked and the number of different instructional programmes available to students are among the features of tracking policies that have been shown to be related to students’ learning outcomes (Hanushek and W ößmann, 2006[65]; OECD, 2016[32]; Van de Werfhorst, 2019[47]).
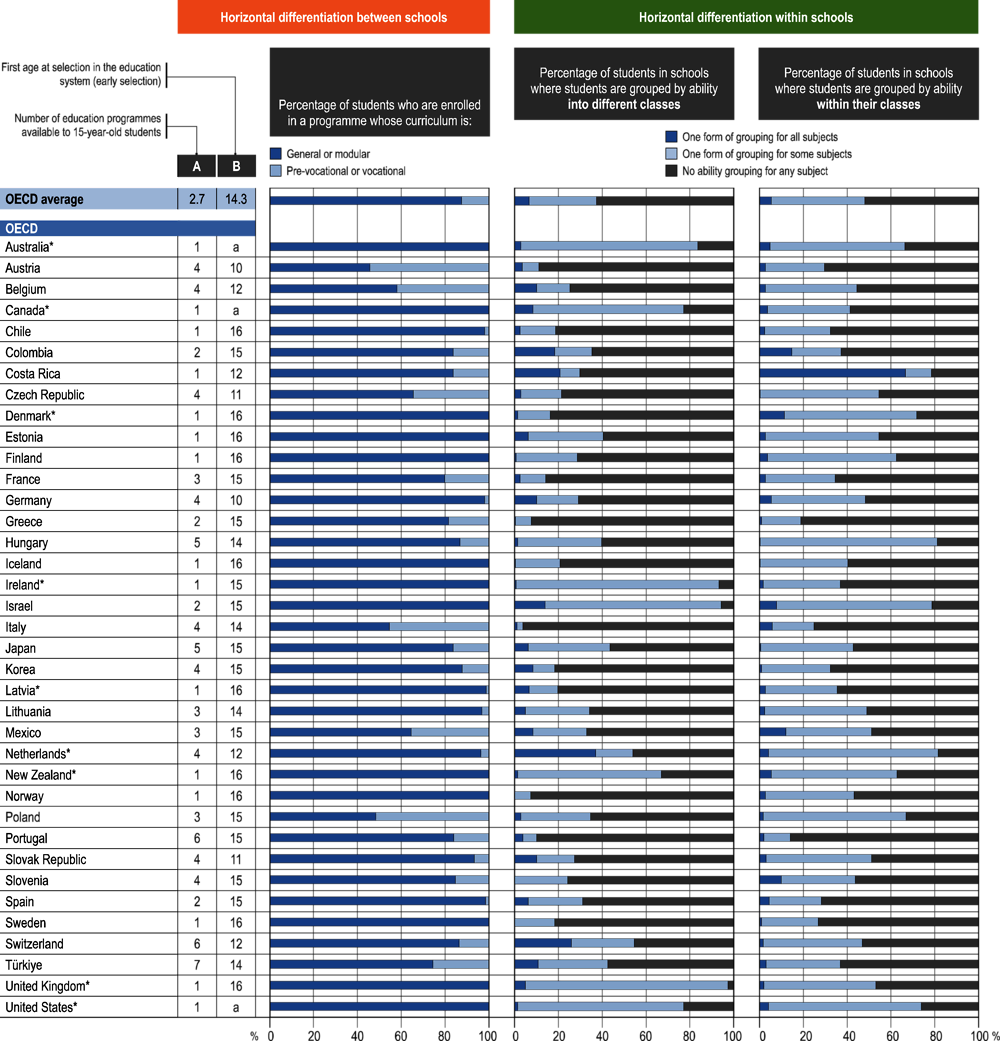
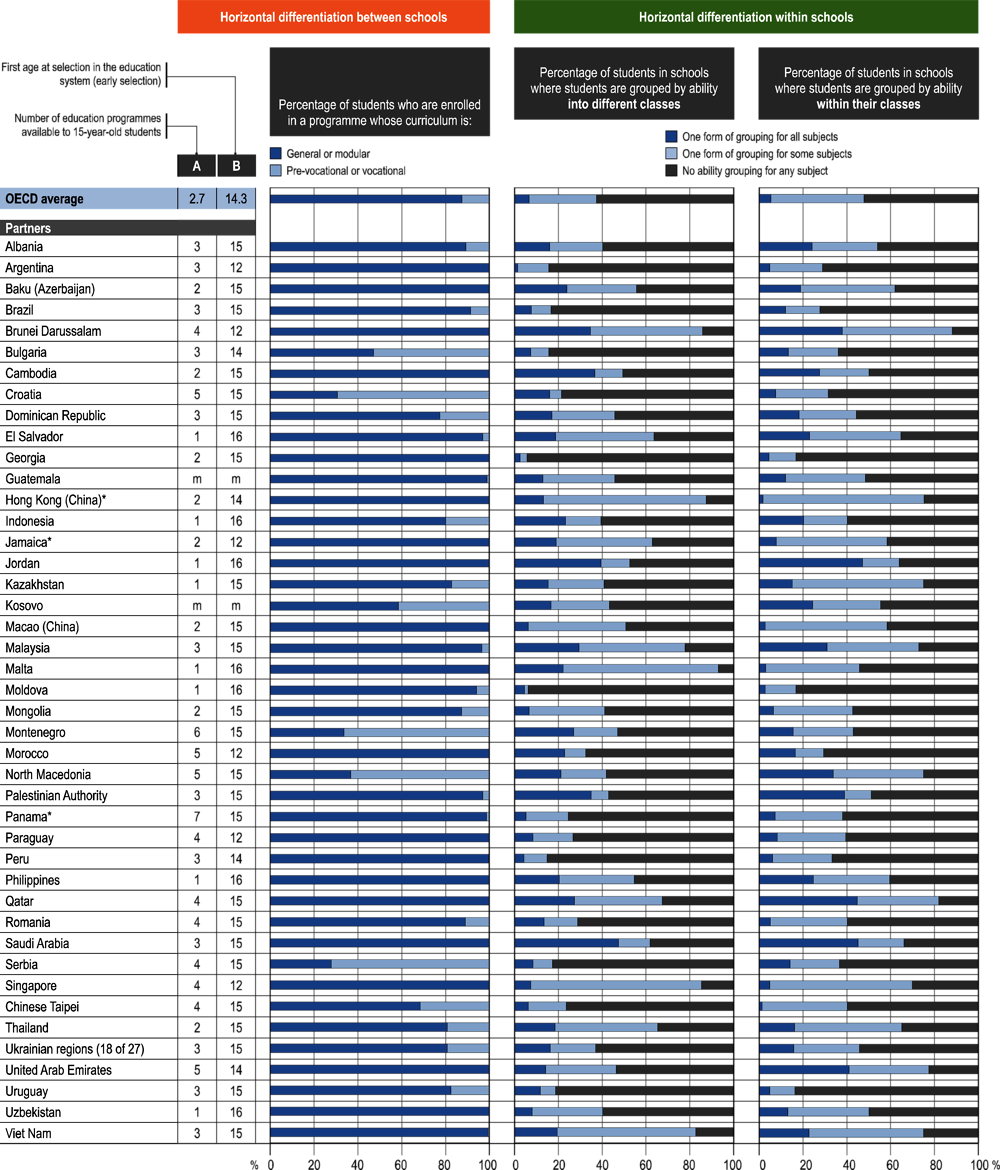
Through its system-level questionnaire, PISA 2022 asked countries to provide a list of the school types or distinct education programmes available to 15-year-old students. Across countries and economies that participated in PISA 2022, the number of distinct education programmes available to 15-year-old students ranged from a single programme (in 24 education systems) to 7 different programmes (in Panama and Türkiye) (Figure II.4.18 and Table B3.1.4). Many education systems offered 2 (13 countries/economies), 3 (16 countries/economies), or 4 (17 countries/economies) instructional programmes to their 15-year-old students. Students in a few school systems could also choose from 5 (7 countries/economies) or 6 (3 countries/economies) distinct instructional programmes.
On average across OECD countries, school systems began selecting students for different programmes at the age of 14.3 years (Table B3.1.4), roughly the same age as in previous PISA cycles (OECD, 2020[41]; OECD, 2016[32]; OECD, 2013[40]). Some school systems, including Austria and Germany, continued selecting students as early as age 10; but the most common age at selection was 15 (37 countries/economies), followed by 16 (18 countries/economies). Most experts agree that selecting students before the age of 14 should be considered “early” tracking. According to this metric, students are tracked early in their education pathways in 15 school systems, namely Austria and Germany (selection at age 10); the Czech Republic and the Slovak Republic (selection at age 11); and Argentina, the Flemish Community of Belgium, the German-speaking Community of Belgium, Brunei Darussalam, Costa Rica, Jamaica, Morocco, the Netherlands, Paraguay, Singapore and Switzerland (selection at age 12).
Source: OECD, PISA 2022 Database, see Tables in Annex B1, Chapter 4 and Table B3.1.4.
Enrolment in vocational programmes
PISA 2022 asked students to report the kind of programme in which they were enrolled. Students’ responses were then classified into two categories of programme orientation: general/modular or pre-vocational/vocational. On average across OECD countries, 87.4% of 15-year-old students were enrolled in a programme with a general/modular curriculum and 12.6% were enrolled in a programme with a pre-vocational or vocational curriculum (Table II.B1.4.19). In about a third of countries/economies, all 15-year-old students were enrolled in a general or modular programme; in about a third, some students were enrolled in pre-vocational or vocational programmes, but they represented less than 15% of the student population; and in the remaining third of school systems, at least 15% of students were enrolled in pre-vocational or vocational programmes. At least half of students in Austria, Bulgaria, Croatia, Montenegro, North Macedonia, Poland and Serbia were enrolled in these programmes.
Enrolment in vocational programmes remained roughly stable across OECD countries between 2018 and 2022. During the period, there was only a one percentage-point decrease in the share of students enrolled in pre-vocational or vocational programmes (Table II.B1.4.24). In some countries/economies, enrolment in vocational programmes shrunk considerably, especially in Albania, Argentina, the Netherlands*, Panama* and Slovenia, whereas in others, including the Dominican Republic and Poland, the opposite was observed.
In countries and economies with large enrolments in pre-vocational or vocational programmes, these enrolments vary markedly according to students’ profiles. In 27 of the 37 education systems where at least 5% of students were enrolled in pre-vocational or vocational programmes, boys were more likely than girls to participate in these programmes (Table II.B1.4.20). In Poland, for instance, roughly four in ten girls, but more than six in ten boys, were enrolled in pre-vocational or vocational programmes. These gender gaps in vocational enrolment may later be reflected in gender segregation in the labour market (Imdorf, Hegna and Reisel, 2015[66]). Furthermore, in about 80% of these 37 education systems socio-economically disadvantaged students were more likely than advantaged students to be enrolled in these programmes (Figure II.4.19). This gap was at least 30 percentage points wide in Belgium, Bulgaria, Croatia, Italy, Montenegro, North Macedonia Poland, Serbia and Chinese Taipei.
Students in rural schools are frequently offered fewer options when it comes to choosing courses and programmes, usually because there are insufficient numbers of interested students, or because there is a lack of qualified teachers and other necessary resources (Echazarra and Radinger, 2019[67]; Irvin et al., 2011[68]). These constraints generally limit the availability of vocational programmes, which often require teachers with specialised skills, and specific equipment and material (OECD, 2018[69]). PISA 2022 data show that, in about six out of ten education systems where at least 5% of students were enrolled in pre-vocational or vocational programmes, students in rural schools participated less frequently in vocational programmes than students in urban schools (Table II.B1.4.20). In the Czech Republic, for instance, about 3% of 15-year-old students in rural schools, but 36% of those in urban schools, were enrolled in vocational programmes. These findings do not necessary mean that rural students cannot access vocational programmes, but they may indicate that rural students need to commute long distances to participate in these programmes.
In a majority of countries and economies that offer both academic and vocational programmes to 15-year-old students, students in general programmes outperformed students in pre-vocational and vocational programmes in mathematics, after accounting for students’ and schools’ socio-economic profile (Table II.B1.4.25). The most extreme case is Spain, where almost 60 score points separate students in academic programmes from those in pre-vocational programmes. This is to be expected given that, in Spain, pre-vocational programmes were introduced as a way of keeping academically struggling students in school (this is not the case for the intermediate and advanced vocational programmes offered to older students). However, in some education systems, pre-vocational and vocational programmes have traditionally attracted students with good academic records. In 11 countries/economies, including Brazil, Colombia, the Dominican Republic, Guatemala, Japan, the Netherlands and Poland, students in vocational programmes scored higher in mathematics than those in general programmes, after accounting for socio-economic factors.
Notes: Education systems with less than 1% of students enrolled in pre-vocational or vocational programmes are not shown.
Statistically significant differences are shown in a darker tone (see Annex A3)
Countries and economies are ranked in descending order of the difference in the percentage of students enrolled in pre-vocational or vocational programmes between socio-economically disadvantaged and advantaged students.
Source: OECD, PISA 2022 Database, Annex B1, Chapter 4.
Ability grouping
Ability grouping in school involves placing students into different classrooms or in small instructional groups in a class based on the students’ initial achievement or skill levels (Steenbergen-Hu, Makel and Olszewski-Kubilius, 2016[70]). Some research has shown that ability grouping can have a positive impact on the achievement of elementary school pupils, especially when there is mobility and flexibility in group allocations and when such grouping involves only specific subjects (Matthews, Ritchotte and McBee, 2013[71]; Slavin, 1987[72]). Other evidence suggests that ability grouping might not be as beneficial for struggling students if instruction is not differentiated across ability groups, or if those students are less likely to learn from their higher-performing peers (Hong et al., 2012[73]; Lucas, 2001[74]). In addition, some scholars point out that ability grouping within schools and giving students a greater choice of subjects often exacerbate educational stratification along socio-economic lines, often in ways that are not immediately obvious (Triventi et al., 2020[5]). For instance, socio-economically disadvantaged students are typically under-represented in advanced science, mathematics and foreign language courses, potentially limiting their educational opportunities (Farges et al., 2016[75]; Gortazar and Taberner, 2020[76]; Rudolphi and Erikson, 2016[77]). In response, New Zealand recently introduced a plan, called Kōkirihia, to eliminate streaming in their schools so that Māori and Pacific students are not incorrectly placed in the lowest-performing groups and classes (Box II.4.2).
While sorting students within schools can take multiple forms (Gamoran and Berends, 1987[78]), this section focuses on the extent to which education systems place students into different classes, or into different groups within the same class, based on their ability. The analysis also considers whether these forms of ability grouping are used for all subjects or only for some.
In Aotearoa (the Māori name for New Zealand), the organisation Tokonoa te Raki uses social innovation to achieve equity in education, employment and income for all Māori. In 2019, the organisation published a research report, He Awa Ara Rau – A Journey of Many Paths, which tracked over 70 000 Māori youth on their way through education and into employment to better understand what propels them forward, the barriers to success they encounter, and the potential levers for change. One of the most significant barriers identified was the negative impacts of streaming.
Data from PISA and other international studies, such as TIMSS and PIRLS, have shown that the prevalence of grouping students by ability between classes, or ‘streaming’ (also known as tracking, banding or setting), has been consistently high over the years and much more common in Aotearoa than in most other countries (Davy, 2021[79]). In 2015, for instance, 90% of 15-year-olds students attended schools that used streaming for all or some subjects (OECD, 2016[32]).
In early 2021, representatives from te Tāhuhu o te Mātauranga (the Ministry of Education) and the Mātauranga Iwi Leaders Group came to Tokona te Raki, an organisation that focuses on the future of Māori, with a call to action: to bring together leaders across the education sector to design an action plan to put an end to streaming in Aotearoa. What resulted was an innovative approach to create systematic change. Kōkirihia developed a triple-A framework: growing awareness, showcasing alternatives to streaming, and asking organisations across the education sector to take action.
Coalition members, including education agencies, sector unions and associations, Initial Teacher Education Institutions, and School Boards and Principals, made commitments to move towards ending streaming by 2030.
For instance, Te Tāhuhu o te Mātauranga (the Ministry of Education) committed to making inclusive practices clear in the development of a Common Practice Model and a refreshed New Zealand Curriculum (Te Mātaiaho), and to monitor and report on progress. As part of the Literacy and Communications and Maths Strategy, the Common Practice Model outlines principles and evidence-based pedagogical approaches to teaching and learning for literacy, communication and mathematics. Te Mātaiaho, the refreshed NZ curriculum, is designed to give practical effect to Te Tiriti o Waitangi, be inclusive, and clearly outline what all Year 0 to 13 students will learn in eight learning areas across five phases. Te Mātaiaho is a progression-focused curriculum that describes what students should understand, know and do by the end of each phase.
PISA has played, and will continue to play, an important role in monitoring the shifts in practice that have already occurred. In 2022, 67% of 15-year-olds students attended schools where students were grouped by ability between classes for all or some subjects, a 23 percentage-point decline since 2015 (OECD, 2016[32]), and a 17 percentage-point decline since 2018 (Table II.B1.4.29) – the second-largest declines in the use of streaming, after those observed in Costa Rica, across OECD countries. Much more work is needed to end streaming by 2030, but the roadmap in Kōkirihia has clear milestones to guide schools in developing their own strategic goals, plans and professional development.
This initiative showcases how systemic change can be produced not with the typical policy levers of legislation and regulation, but with collaboration in pursuit of a common goal.
Ability grouping into different classes
On average across OECD countries in 2022, almost 4 in 10 students attended schools where students are grouped by ability into different classes for all subjects (7%) or some subjects (31%) (Table II.B1.4.26). The greatest incidence of this kind of grouping was observed in Ireland*, Israel, Malta and the United Kingdom*. In these countries/economies, at least nine in ten students attended a school that groups students into different classes for all or some subjects. By contrast, fewer than one in ten students in Georgia, Greece, Italy, Moldova and Norway were grouped by ability into different classes. The most consequential form of ability grouping, i.e. when used in all subjects, was more widespread in Saudi Arabia (47% of students attended such schools), Jordan (40%), Netherlands* (37%), Cambodia (37%), the Palestinian Authority (35%) and Brunei Darussalam (35%).
Grouping students by ability between classes, for all or some subjects, was observed less frequently in 2022 than in 2018, on average across OECD countries (a 5 percentage-point decrease) and in about half of PISA-participating countries/economies (Table II.B1.4.29). Grouping students by ability became less prevalent over the period in education systems such as Argentina, Bulgaria, Costa Rica, Kosovo, New Zealand*, North Macedonia, Romania and Serbia, while the practice became more widely used in Estonia, Hungary, Iceland and Malta.
Overall, the incidence of grouping students into different classes based on ability was not strongly associated with school characteristics (Table II.B1.4.27). On average across OECD countries, ability grouping was used to a similar degree in socio-economically advantaged and disadvantaged schools, and in public and private schools. However, it was somewhat more frequently observed in urban than in rural schools. Still, there were interesting results for certain education systems. In Hungary and Macao (China), for instance, ability grouping between classes was observed largely in socio-economically advantaged (and average) schools; in Germany and Jamaica* ability grouping was used mainly in socio-economically disadvantaged (and average) schools; and in Greece and Italy, it was practiced mostly in private schools.
Differences in mathematics performance between students who attended schools that practice and those that do not practice ability grouping into different classes (for some or all subjects) tended to be small, after accounting for the socio-economic profile of students and schools (Table II.B1.4.30). On average across OECD countries, this difference amounted to four score points in favour of schools with no ability grouping. In a further 14 countries/economies, students in schools that used ability grouping into different classes scored lower than students in schools that did not practice this type of ability grouping. These results are to be expected given that schools often consider using ability grouping when faced with large shares of struggling students and a wide range of skills in classes.
Ability grouping within classes
Grouping students by ability within classes was more common than ability grouping between classes. On average across OECD countries, about half of the students attended classes where there was ability grouping in at least one subject (Table II.B1.4.26). This comprises 42% of students who were grouped, within their classes, for some subjects, and 6% of students who were grouped for all subjects. Ability grouping within a class for some or all subjects was most prevalent in Brunei Darussalam, Hungary, the Netherlands* and Qatar where at least 80% of students were affected by this practice. By contrast, ability grouping within the same class occurred the least frequently in Georgia, Greece, Moldova, Portugal and Uruguay. Grouping students by ability within classes, for all or some subjects, was observed less frequently in 2022 than in 2018, on average across OECD countries (a 7 percentage-point decrease) and in about half of PISA-participating countries/economies (Table II.B1.4.29).
Ability grouping in classes was somewhat more common in socio-economically disadvantaged than in advantaged schools. On average across OECD countries, 51% of students in disadvantaged schools were grouped by ability in their classes, compared to 43% of students in advantaged schools (Table II.B1.4.28). Ability grouping within classes was used to a similar extent in rural and urban schools, and in public and private schools.
Differences in mathematics performance between students who attended schools that practice and those that do not practice ability grouping within the same class (for some or all subjects) tended to be small, in line with the results observed for ability grouping between classes (Table II.B1.4.30). On average across OECD countries, this difference amounted to three score points in favour of schools with no ability grouping, after accounting for socio-economic factors. In a further 11 countries/economies, students in schools that used ability grouping within classes scored lower than students in schools that did not practice this type of ability grouping.
Table II.4.2 provides an overview of the stratification policies in four groups of education systems, organised according to whether their mathematics performance and their ability to ensure that all students, regardless of their socio-economic background, can achieve at high levels (socio-economic fairness), were below or above the median value of all PISA-participating countries and economies. Based on this classification, the high-performing systems in which all students could flourish were, in many ways, different from the other three groups of education systems. These education systems had relatively few students who had attended pre-primary education for less than one year, and comparatively even fewer who had repeated a grade. Only 4.5% of students had repeated a grade in these education systems, considerably lower than the percentage observed in the other three groups.
As regards the sorting and grouping of students horizontally, both advantaged and disadvantaged students were less concentrated in certain schools in the group of equitable and high-performing education systems than they were in the other three groups of countries/economies. These systems also tracked students later into different curricular programmes. For instance, students in these systems were selected into different academic programmes at the age of 15.3, on average, whereas in the group of high-performing, but less equitable, education systems students were tracked at 13.8 years, on average. About 9% of students attended vocational programmes in the group of fair and high-performing education systems, a share lower but not significantly different from the other three groups. The fair and high-performing systems used ability grouping between classes for all subjects to a lesser extent than did low-performing systems, but to a similar extent as high-performing, but less fair, education systems.
The results presented in this section describe the stratification policies that were in place in the group of equitable and high-performing education systems. In themselves, they cannot explain why some countries/economies are more socio-economically fair or higher-performing than others. Making causal inferences is not advisable, given the cross-sectional nature of the PISA assessment, and the complexity of the relationships between stratification policies and student outcomes.
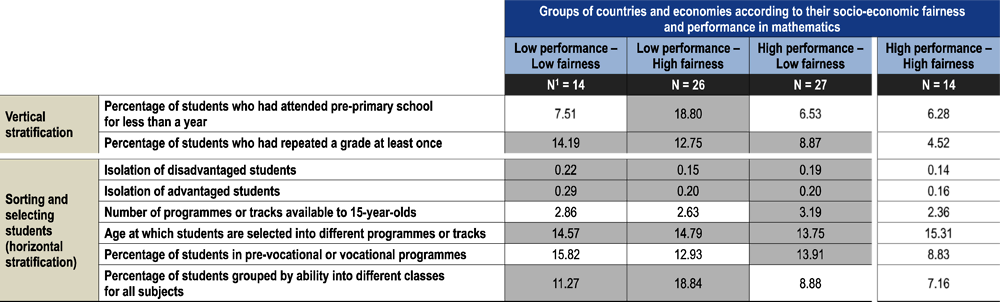
References
[36] Alet, É., L. Bonnal and P. Favard (2013), “Repetition: Medicine for a Short-run Remission”, Annals of Economics and Statistics 111/112, p. 227, https://doi.org/10.2307/23646332.
[10] Bai, Y. et al. (2021), “The long-term benefits of preschool education: Evidence from rural China”, International Conference of Agricultural Economists.
[8] Bartlett, W. (2009), “The effectiveness of vocational education in promoting equity and occupational mobility amongst young people”, Economic Annals, Vol. 54/180, pp. 7-39, https://doi.org/10.2298/EKA0980007B.
[42] Benhenda, A. and J. Grenet (2015), “How much does grade repetition in French Primary and Secondary Schools Cost?”, http://www.ipp.eu.
[19] Berlinski, S., S. Galiani and P. Gertler (2009), “The effect of pre-primary education on primary school performance”, Journal of Public Economics, Vol. 93/1-2, pp. 219-234, https://doi.org/10.1016/j.jpubeco.2008.09.002.
[25] Boeskens, L. (2016), “Regulating Publicly Funded Private Schools: A Literature Review on Equity and Effectiveness”, OECD Education Working Papers, No. 147, OECD Publishing, Paris.
[55] Bonal, X., A. Zancajo and R. Scandurra (2019), “Residential segregation and school segregation of foreign students in Barcelona”, Urban Studies, Vol. 56/15, pp. 3251-3273, https://doi.org/10.1177/0042098019863662.
[50] Burke, M. and T. Sass (2013), “Classroom Peer Effects and Student Achievement”, Journal of Labor Economics, Vol. 31/1, pp. 51-82, https://doi.org/10.1086/666653.
[35] Cabrera-Hernandez, F. (2022), “Leave them kids alone! The effects of abolishing grade repetition: evidence from a nationwide reform”, Education Economics, Vol. 30/4, pp. 339-355, https://doi.org/10.1080/09645292.2021.1978938.
[28] Choudhury, P., R. Joshi and A. Kumar (2023), “Regional and socioeconomic inequalities in access to pre-primary education in India: evidence from a recent household survey”, International Journal of Child Care and Education Policy, Vol. 17/1, p. 13, https://doi.org/10.1186/s40723-023-00117-4.
[79] Davy, A. (2021), Does streaming work? A review of the evidence, New Zealand Ministry of Education, Wellington.
[26] Doorley, K. et al. (2021), “Childcare in Ireland: usage, affordability and incentives to work”, ESRI, No. 708.
[7] Duflo, E., P. Dupas and M. Kremer (2011), “Peer Effects, Teacher Incentives, and the Impact of Tracking: Evidence from a Randomized Evaluation in Kenya”, American Economic Review, Vol. 101/5, pp. 1739-1774, https://doi.org/10.1257/aer.101.5.1739.
[16] Duncan, G. et al. (2007), “School readiness and later achievement”, Developmental Psychology, Vol. 43/6, pp. 1428-1446, https://doi.org/10.1037/0012-1649.43.6.1428.
[1] Dupriez, V., X. Dumay and A. Vause (2008), “How Do School Systems Manage Pupils’ Heterogeneity?”, https://doi.org/10.1086/528764, Vol. 52/2, pp. 245-273, https://doi.org/10.1086/528764.
[67] Echazarra, A. and T. Radinger (2019), “Learning in Rural Schools: Insights from PISA, TALIS and the Literature”, OECD Education Working Papers Series, No. 196, OECD, Paris, http://www.oecd.org/edu/workingpapers (accessed on 5 June 2019).
[39] Education Endowment Foundation (2023), Teaching and Learning Toolkit.
[31] European Commission (2011), Grade retention during compulsory education in Europe – Regulations and statistics, Publications Office.
[75] Farges, G. et al. (2016), “The long-term outcomes of early educational differentiation in France”, in Models of Secondary Education and Social Inequality, Edward Elgar Publishing, https://doi.org/10.4337/9781785367267.00029.
[49] Frankel, D. and O. Volij (2011), “Measuring school segregation”, Journal of Economic Theory, Vol. 146/1, pp. 1-38, https://doi.org/10.1016/j.jet.2010.10.008.
[9] Furuta, J. (2020), “Liberal Individualism and the Globalization of Education as a Human Right: The Worldwide Decline of Early Tracking, 1960–2010”, Sociology of Education, Vol. 93/1, pp. 1-19, https://doi.org/10.1177/0038040719873848.
[44] Gamoran, A. (2009), “Tracking and inequality: New directions for research and practice”, in The Routledge International Handbook of the Sociology of Education, Routledge.
[78] Gamoran, A. and M. Berends (1987), “The Effects of Stratification in Secondary Schools: Synthesis of Survey and Ethnographic Research”, Review of Educational Research, Vol. 57/4, pp. 415-435, https://doi.org/10.3102/00346543057004415.
[45] Gerber, T. and S. Cheung (2008), “Horizontal Stratification in Postsecondary Education: Forms, Explanations, and Implications”, Annual Review of Sociology, Vol. 34/1, pp. 299-318, https://doi.org/10.1146/annurev.soc.34.040507.134604.
[46] Glaesser, J. and B. Cooper (2011), “Selectivity and Flexibility in the German Secondary School System: A Configurational Analysis of Recent Data from the German Socio-Economic Panel”, European Sociological Review, Vol. 27/5, pp. 570-585, https://doi.org/10.1093/esr/jcq026.
[76] Gortazar, L. and P. Taberner (2020), “La Incidencia del Programa Bilingüe en la Segregación Escolar por Origen Socioeconómico en la Comunidad Autónoma de Madrid: Evidencia a partir de PISA”, REICE. Revista Iberoamericana sobre Calidad, Eficacia y Cambio en Educación, Vol. 18/4, pp. 219-239, https://doi.org/10.15366/reice2020.18.4.009.
[65] Hanushek, E. and L. W ößmann (2006), “Does Educational Tracking Affect Performance and Inequality? Differences‐ in‐Differences Evidence Across Countries”, The Economic Journal, Vol. 116/510, pp. C63-C76, https://doi.org/10.1111/j.1468-0297.2006.01076.x.
[60] Hardoy, I., A. Mastekaasa and P. Schøne (2018), “Immigrant concentration and student outcomes in upper secondary schools: Norwegian evidence”, European Societies, Vol. 20/2, pp. 301-321, https://doi.org/10.1080/14616696.2017.1402120.
[12] Heckman, J. (2006), “Skill formation and the economics of investing in disadvantaged children”, Science, Vol. 312/5782, pp. 1900-1902.
[21] Heckman, J. et al. (2010), “The rate of return to the HighScope Perry Preschool Program”, Journal of Public Economics, Vol. 94/1-2, pp. 114-128, https://doi.org/10.1016/j.jpubeco.2009.11.001.
[73] Hong, G. et al. (2012), “Differential Effects of Literacy Instruction Time and Homogeneous Ability Grouping in Kindergarten Classrooms”, Educational Evaluation and Policy Analysis, Vol. 34/1, pp. 69-88, https://doi.org/10.3102/0162373711424206.
[3] Horn, D., T. Keller and P. Róbert (2016), “Early tracking and competition–A recipe for major inequalities in Hungary”, in Blossfeld, H. et al. (eds.), Models of Secondary Education and Social Inequality, Edward Elgar Publishing, https://doi.org/10.4337/9781785367267.
[37] Ikeda, M. and E. García (2014), “Grade repetition: A comparative study of academic and non-academic consequences”, OECD Journal: Economic Studies.
[66] Imdorf, C., K. Hegna and L. Reisel (eds.) (2015), Gender Segregation in Vocational Education, Emerald Group Publishing Limited, Bingley, https://doi.org/10.1108/S0195-6310201531.
[68] Irvin, M. et al. (2011), “Relationship of School Context to Rural Youth’s Educational Achievement and Aspirations”, Journal of Youth and Adolescence, Vol. 40/9, pp. 1225-1242, https://doi.org/10.1007/s10964-011-9628-8.
[33] Jacob, B. and L. Lefgren (2004), “Remedial Education and Student Achievement: A Regression-Discontinuity Analysis”, Review of Economics and Statistics, Vol. 86/1, pp. 226-244, https://doi.org/10.1162/003465304323023778.
[59] Jensen, P. and A. Rasmussen (2011), “The effect of immigrant concentration in schools on native and immigrant children’s reading and math skills”, Economics of Education Review, Vol. 30/6, pp. 1503-1515, https://doi.org/10.1016/j.econedurev.2011.08.002.
[53] Karsten, S. (2010), “School Segregation”, in Equal Opportunities?: The Labour Market Integration of the Children of Immigrants, OECD Publishing, Paris.
[56] Kutscher, M., S. Nath and S. Urzúa (2023), “Centralized admission systems and school segregation: Evidence from a national reform”, Journal of Public Economics, Vol. 221, p. 104863, https://doi.org/10.1016/j.jpubeco.2023.104863.
[51] Lavy, V., O. Silva and F. Weinhardt (2012), “The Good, the Bad, and the Average: Evidence on Ability Peer Effects in Schools”, Journal of Labor Economics, Vol. 30/2, pp. 367-414, https://doi.org/10.1086/663592.
[63] LeTendre, G., B. Hofer and H. Shimizu (2003), “What Is Tracking? Cultural Expectations in the United States, Germany, and Japan”, American Educational Research Journal, Vol. 40/1, pp. 43-89, https://doi.org/10.3102/00028312040001043.
[54] Loxbo, K. (2018), “Ethnic diversity, out-group contacts and social trust in a high-trust society”, Acta Sociologica, Vol. 61/2, pp. 182-201, https://doi.org/10.1177/0001699317721615.
[74] Lucas, S. (2001), “Effectively Maintained Inequality: Education Transitions, Track Mobility, and Social Background Effects”, American Journal of Sociology, Vol. 106/6, pp. 1642-1690, https://doi.org/10.1086/321300.
[38] Manacorda, M. (2012), “The Cost of Grade Retention”, Review of Economics and Statistics, Vol. 94/2, pp. 596-606, https://doi.org/10.1162/REST_a_00165.
[71] Matthews, M., J. Ritchotte and M. McBee (2013), “Effects of schoolwide cluster grouping and within-class ability grouping on elementary school students’ academic achievement growth”, High Ability Studies, Vol. 24/2, pp. 81-97, https://doi.org/10.1080/13598139.2013.846251.
[24] Melhuish, E. et al. (2015), A review of research on the effects of early childhood Education and Care (ECEC) upon child development. CARE project, Curriculum Quality Analysis and Impact Review of European Early Childhood Education and Care (ECEC).
[52] Mendolia, S., A. Paloyo and I. Walker (2018), “Heterogeneous effects of high school peers on educational outcomes”, Oxford Economic Papers, Vol. 70/3, pp. 613-634, https://doi.org/10.1093/oep/gpy008.
[17] Nordic Council of Ministers (2012), Long-term effects of early childhood care and education, Nordic Council of Ministers, Copenhagen.
[18] Nugroho, D. et al. (2020), “COVID-19: Trends, Promising Practices and Gaps in Remote Learning for Pre-Primary Education”, Innocenti Research Brief, No. 36, UNICEF.
[2] Oakes, J. (1985), Keeping track: How schools structure inequality, Yale University Press, New Haven.
[14] OECD (2022), Education at a Glance 2022: OECD Indicators, OECD Publishing, Paris, https://doi.org/10.1787/3197152b-en.
[41] OECD (2020), PISA 2018 Results (Volume V): Effective Policies, Successful Schools, PISA, OECD Publishing, Paris, https://doi.org/10.1787/ca768d40-en.
[43] OECD (2019), PISA 2018 Results (Volume III): What School Life Means for Students’ Lives, PISA, OECD Publishing, Paris, https://doi.org/10.1787/acd78851-en.
[13] OECD (2018), Engaging Young Children: Lessons from Research about Quality in Early Childhood Education and Care, Starting Strong, OECD Publishing, Paris, https://doi.org/10.1787/9789264085145-en.
[69] OECD (2018), Responsive School Systems: Connecting Facilities, Sectors and Programmes for Student Success, OECD Reviews of School Resources, OECD Publishing, Paris, https://doi.org/10.1787/9789264306707-en.
[32] OECD (2016), PISA 2015 Results (Volume II): Policies and Practices for Successful Schools, PISA, OECD Publishing, Paris, https://doi.org/10.1787/9789264267510-en.
[40] OECD (2013), PISA 2012 Results: What Makes Schools Successful (Volume IV): Resources, Policies and Practices, PISA, OECD Publishing, Paris, https://doi.org/10.1787/9789264201156-en.
[58] Owens, A. et al. (2022), “Measuring Segregation with the Normalized Exposure Index”, The Segregation Index, Research Brief.
[61] Pedraja-Chaparro, F., D. Santín and R. Simancas (2016), “The impact of immigrant concentration in schools on grade retention in Spain: a difference-in-differences approach”, Applied Economics, Vol. 48/21, pp. 1978-1990, https://doi.org/10.1080/00036846.2015.1111989.
[64] Perry, L. and L. Southwell (2014), “Access to academic curriculum in Australian secondary schools: a case study of a highly marketised education system”, https://doi.org/10.1080/02680939.2013.846414, Vol. 29/4, pp. 467-485, https://doi.org/10.1080/02680939.2013.846414.
[27] Purcal, C. and K. Fisher (2006), “Affordability Funding Models for Early Childhood Services”, Australasian Journal of Early Childhood, Vol. 31/4, pp. 49-58, https://doi.org/10.1177/183693910603100408.
[22] Richter, L. et al. (2021), “Measuring and forecasting progress in education: what about early childhood?”, Science of Learning, Vol. 6/1, p. 27, https://doi.org/10.1038/s41539-021-00106-7.
[77] Rudolphi, F. and R. Erikson (2016), “Social selection in formal and informal tracking in Sweden”, in Models of Secondary Education and Social Inequality, Edward Elgar Publishing, https://doi.org/10.4337/9781785367267.00020.
[62] Schneeweis, N. (2015), “Immigrant concentration in schools: Consequences for native and migrant students”, Labour Economics, Vol. 35, pp. 63-76, https://doi.org/10.1016/j.labeco.2015.03.004.
[11] Shavit, Y. and H. Blossfeld (1993), Persistent Inequality: Changing Educational Attainment In Thirteen Countries, Westview Press, Boulder.
[72] Slavin, R. (1987), “Ability Grouping and Student Achievement in Elementary Schools: A Best-Evidence Synthesis”, Review of Educational Research, Vol. 57/3, pp. 293-336, https://doi.org/10.3102/00346543057003293.
[70] Steenbergen-Hu, S., M. Makel and P. Olszewski-Kubilius (2016), “What One Hundred Years of Research Says About the Effects of Ability Grouping and Acceleration on K–12 Students’ Academic Achievement”, Review of Educational Research, Vol. 86/4, pp. 849-899, https://doi.org/10.3102/0034654316675417.
[4] Strello, A. et al. (2021), “Early tracking and different types of inequalities in achievement: difference-in-differences evidence from 20 years of large-scale assessments”, Educational Assessment, Evaluation and Accountability, Vol. 33/1, pp. 139-167, https://doi.org/10.1007/S11092-020-09346-4/TABLES/6.
[23] Suziedelyte, A. and A. Zhu (2015), “Does early schooling narrow outcome gaps for advantaged and disadvantaged children?”, Economics of Education Review, Vol. 45, pp. 76-88, https://doi.org/10.1016/j.econedurev.2015.02.001.
[20] Taniguchi, K. (2022), “The impact of pre-primary education on primary student achievement: evidence from SACMEQ III”, International Journal of Early Years Education, pp. 1-19, https://doi.org/10.1080/09669760.2022.2137783.
[29] Temple, J. (2009), “Rural Gaps in Participation in Early Childhood Education”, Journal of Agricultural and Applied Economics, Vol. 41/2, pp. 403-410, https://doi.org/10.1017/S107407080000287X.
[5] Triventi, M. et al. (2020), “Advantage ‘Finds Its Way’: How Privileged Families Exploit Opportunities in Different Systems of Secondary Education”, Sociology, Vol. 54/2, pp. 237-257, https://doi.org/10.1177/0038038519874984.
[15] UNESCO Institute for Statistics (2012), International Standard Classification of Education ISCED 2011.
[47] Van de Werfhorst, H. (2019), “Early Tracking and Social Inequality in Educational Attainment: Educational Reforms in 21 European Countries”, American Journal of Education, Vol. 126/1, pp. 65-99, https://doi.org/10.1086/705500.
[6] Van de Werfhorst, H. and J. Mijs (2010), “Achievement Inequality and the Institutional Structure of Educational Systems: A Comparative Perspective”, Annual Review of Sociology, Vol. 36/1, pp. 407-428, https://doi.org/10.1146/annurev.soc.012809.102538.
[57] Wilson, D. and G. Bridge (2019), “School choice and the city: Geographies of allocation and segregation”, Urban Studies, Vol. 56/15, pp. 3198-3215, https://doi.org/10.1177/0042098019843481.
[48] Witschge, J. and H. van de Werfhorst (2020), “Curricular tracking and civic and political engagement: Comparing adolescents and young adults across education systems”, Acta Sociologica, Vol. 63/3, pp. 284-302, https://doi.org/10.1177/0001699318818650.
[30] Zaw, H., S. Mizunoya and X. Yu (2021), “An Equity Analysis of Pre-primary Education in the Developing World”, International Journal of Educational Research, Vol. 109, p. 101806, https://doi.org/10.1016/j.ijer.2021.101806.
[34] Zhang, S. and A. Huang (2022), “The long-term effects of automatic grade promotion on child development”, China Economic Review, Vol. 74, p. 101824, https://doi.org/10.1016/j.chieco.2022.101824.