
2. Economic trends and the role of investment
Uruguay is a relatively small, high-income and fast-growing economy. Policy-makers have worked toward the objective of gradually integrating Uruguay into the global economy, strengthening and cementing democratic institutions and improving the overall well-being of the local population. This policy coupled with lack of formal restrictions on activities of foreign enterprises have led to high levels of foreign direct investment (FDI) in the economy. This chapter presents Uruguay’s situation in terms of its overall economic performance and FDI trends over the past two decades to provide key insights on the role – and evolution – of foreign investment in the Uruguayan economy.
Uruguay is a relatively small, high-income and fast-growing economy. With a fast-aging population of 3.4 million (projected to fall to 3.2 million in 2100), it is South America’s smallest country (except for Suriname and the two Guyanas) and the most urbanised – 40 % of Uruguayans live in the capital city of Montevideo alone (INE, 2011). Since the late 1980s, Uruguay has made a successful transition to a stable market economy and achieved notable progress on institutional and policy reforms. Policy-makers have worked toward the objective of gradually inserting and integrating Uruguay into the global economy, with a profound impact on the institutional framework, not least in the area of investment policies. Democratic institutions have also taken progressively deeper roots, removing any legacy of the 1970s dictatorship.
This chapter presents Uruguay’s situation in terms of its overall economic performance and FDI trends over the past two decades to provide key insights on the role – and evolution – of foreign investment in the Uruguayan economy.
From an economic standpoint, Uruguay suffered from the 1982 debt crisis, lived tumultuous times in the 1980s (the so-called “lost decade”) and only partially recovered in the 1990s. In the aftermath of the 2001-02 recession, ignited by the severe crisis in neighbouring Argentina, GDP per capita grew at a dynamic pace, of around 5.4% per annum between 2004 and 2014, twice as fast as in the 1990s. This expansion was somewhat stymied by the 2008-09 global financial and economic crisis, but resumed with renewed vigour, supported by an appropriate policy mix (IMF, 2017). Year-on-year GDP growth in the second quarter of 2019 was 0.3% (BCU, 2019b).
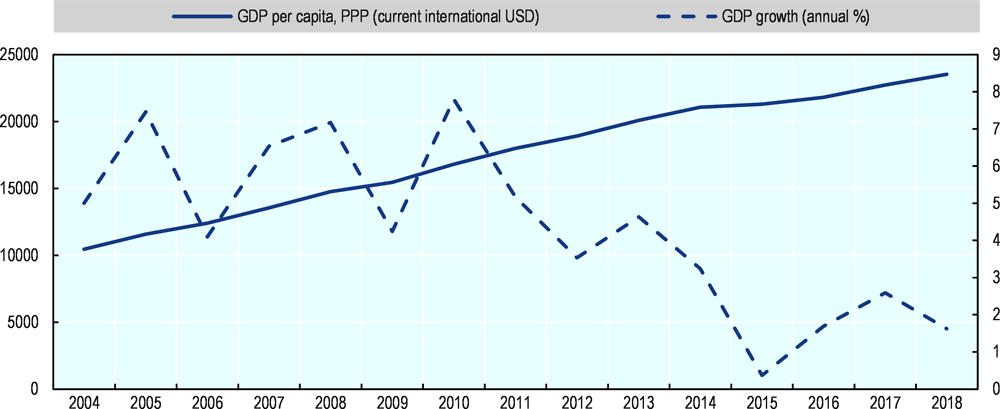
Source: World Bank’s World Development Indicators
Macroeconomics growth has been characterised by substantial improvements in several dimensions of material and human well-being. In PPP terms (current international USD), GDP per capita more than doubled, from USD 10 4471 in 2004 to USD 23 572 in 2018 and in the process went from about 36% of the OECD average level to 52%. Most Millennium Development Goals were reached by 2015 (Presidency of the Republic of Uruguay, 2017). Life expectancy at birth, a key well-being indicator, reached 70 years in 1980, 75 in 2001 and 77 in 2018. Labour market conditions, however, have worsened in the most recent past: unemployment has slightly edged up (although it remains lower than in Argentina and Brazil), youth finds fewer job opportunities (especially in the private sector), and weekly hours worked have also declined (Bafico and Michelin, 2019).
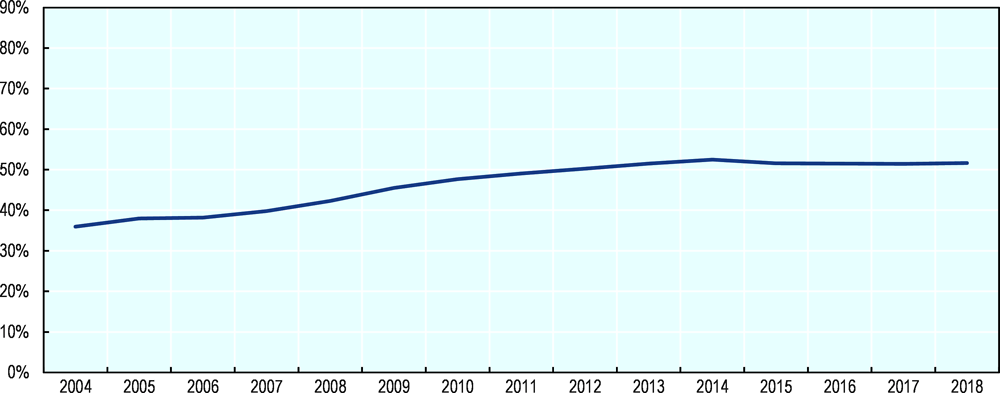
Source: World Bank’s World Development Indicators
There has also been signs of some, albeit modest, structural transformation. The composition of GDP has changed between 1997 and 2018, with the share of the primary sector (agriculture and mining) dropping from 9% of GDP to 7% and that of manufacturing from 16% to 14%, and that of services increasing from 74% to 79%, according to the data by the Central Bank of Uruguay (2019).
The acceleration of investment outlays has been a crucial feature of the recent boom. As a percentage of GDP, gross fixed capital formation (GFCF) in 2006 was at roughly the same level (19.5%) prevailing in the 1970s, when the previous record was set. It grew to 23% in 2008, fell during the global recession before hitting a new peak in 2012. Nonetheless, since 2012 there has seen a worrisome decline in GFCF that has brought the indicator back to 16.5% of GDP in 2018, i.e. the level prevailing during the “lost decade”. In terms of composition of investment by institutional sector, over the 2006-2017 period the private sector has accounted for the bulk and the state for one fifth, according to the Central Bank of Uruguay. The major exceptions were the years 2008 and 2009, which saw the public sector increase its contribution in an anti-cyclical fashion. From the perspective of the type of assets, buildings are slightly more important than capital goods, with no clear trend emerging.
The unprecedented 14-year expansion resulted in a considerable reduction in external risks. The central government debt was trimmed from 73% of GDP in 2005 to 51% in the first quarter of 2019, with the share corresponding to foreign-denominated instruments going down from 88% to 55% and the average time to maturity extending from 7.9 years to 13.8 years (MEF, 2019d). At February 2019, Uruguay was rated BBB (with stable outlook) by S&P and Baa2 (with stable outlook) by Moody’s. In addition, following a period of high inflation, culminating at 28.5% in March 2003, inflation has overall been declining to a minimum of 3.4% in August 2005; it then begun rising until May 2016 and has subsequently fluctuated between 5.2% and 8.3%; in December 2019, the rate was 8.8%, according to the Central Bank of Uruguay.
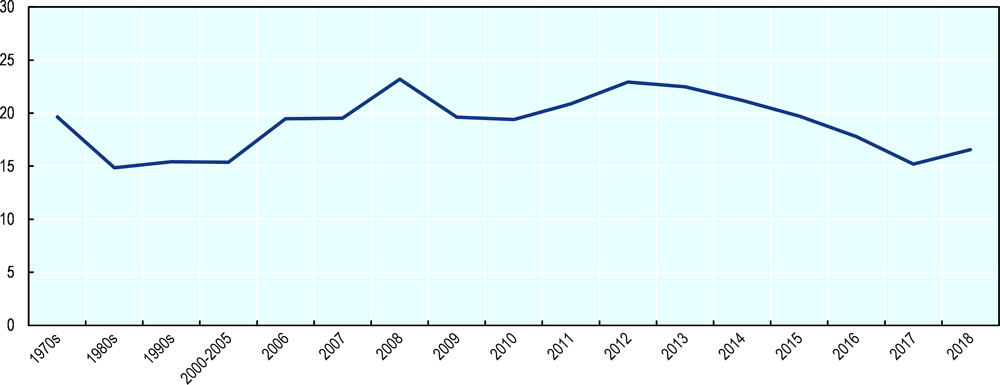
Note: Gross capital formation consists of outlays on additions to the fixed assets of the economy plus net changes in the level of inventories. Fixed assets include land improvements (fences, ditches, drains, and so on); plant, machinery, and equipment purchases; and the construction of roads, railways, and the like, including schools, offices, hospitals, private residential dwellings, and commercial and industrial buildings. Inventories are stocks of goods held by firms to meet temporary or unexpected fluctuations in production or sales, and "work in progress." Net acquisitions of valuables are also considered capital formation.
Source: World Bank’s World Development Indicators
Near-term prospects are favourable overall, unexpected events notwithstanding. Although the IMF and the World Bank project growth to slow to 0.4% in 2019, mainly reflecting weakness in demand from both global and regional partners, GDP is projected to recover in 2020 to more than 2% (IMF, 2019 and World Bank, 2019). Nonetheless, the relatively low level of investment and indications from business surveys (CIU, 2019) suggest that the economy is operating close to potential at the current level of economic structure. Despite prudent debt management, pre-financing of external financing needs, lower banking sector vulnerabilities, and ample reserves, in the medium run there is a risk of growth deceleration unless long-standing structural constraints – and in particular insufficient education achievements – are not addressed. The external environment for trade and finance is also becoming less supportive.
Foreign trade has followed broad trends consistent with Uruguay’s WTO membership (of which it was a founding member), its web of preferential trade agreements signed over the years, and the updating of trade-related legislation to maintain it in line with global norms. The simple average MFN tariff has fallen from 13.3% in 2000 to 10.3% in 2018 (Figure 2.5). While the degree of openness of the economy (measured as the ratio of merchandise trade to GDP) rose between 2000 and 2009, it has been on a downward slope since then, reaching 28% in 2018. The trade balance for goods has been negative since 2012 (when a change occurred in the balance of payments methodology); while exports of services have registered dynamic growth, and the balance has been positive most of the time. This period has also seen commercial services gaining a conspicuous place in Uruguay’s export basket. All in all, the trade balance has improved, registering a surplus in 2017 and a small deficit in 2018.
Uruguay’s integration intro regional and global value chains (GVC) has also evolved. As shown in OECD (2016), Uruguay’s GVC participation takes place predominantly through strong backward linkages, i.e. the use of foreign value added in country’s exports. In 2011, foreign value added accounted for 28% of total value added, up from 11% in 1995, signalling growing GVC integration The more recent indicators confirm that while backward integration has increased particularly intensely in the early 2000s, coinciding with the commodities boom, it has been tamed since then (see Casella, et al., 2019). In addition, if the metrics of GVC participation accounted for the origin of the capital of exporting firms, the share of foreign value-added in Uruguayan exports could be even higher, given the important contribution of foreign-owned firms in the country’s exports In particular, while in 2003 foreign-owned firms accounted for 24 of goods trade in Uruguay, this figure reached 70% by 2018 (Uruguay XX, 2019a).
In terms of product structure, well over half of Uruguayan exports are raw materials – more than in Chile and almost twice as high as in Costa Rica – while the share of capital goods is negligible (Table A.C.1 in Annex C). While there has been some churning, agri-business, in particular cellulose, meat, dairy, soya beans, remain the top export products. Meanwhile, the geographical make-up of Uruguay’s trade basket has changed dramatically. The falling share of exports to Latin America, including MERCOSUR, was accompanied by an explosion of trade with Asia, which almost tripled from 8% of the total in 1999 to 22% in 2017 (see Table A.C.2 in Annex C). In fact, in 2013 China became the single largest export destination for Uruguay, absorbing 30% of exports in 2019, followed by the European Union (17%); while Latin America remains the main source of imports (Uruguay XXI, 2019b).

Source: WITS data, OECD National Accounts data, World Bank national accounts
FDI plays an important role in Uruguay’s economy…
As discussed in Chapter 4, Uruguay has very few de iure restrictions to foreign direct investment (FDI). Meanwhile, reduced barriers to FDI are, on average, associated with higher levels of inward FDI stocks (Mistura and Roulet, 2019).1 In this context, and considering the government’s continued effort to attract investment, it is not surprising that FDI plays a prominent role in the Uruguayan economy: FDI liabilities reached USD 48.8 billion (about 82% of GDP) and FDI assets USD26.7 billion (45% of GDP) in 2018.2 FDI liabilities have increased progressively over the years, outpacing the growth in FDI assets (Figure 2.5).3 Overall, locally established foreign-owned firms continue playing a relatively more important role in the local economy than Uruguayan firms established abroad, as reflected in the fact that FDI liabilities continue to be greater than assets.

Note: In 2012, the Central Bank of Uruguay changed its methodology for compiling FDI statistics, aligning it with the sixth edition of the Balance of Payments and International Investment Position Manual (BPM6) and improving the coverage. As such, data for prior periods are not directly comparable.
Source: Central Bank of Uruguay (BCU)
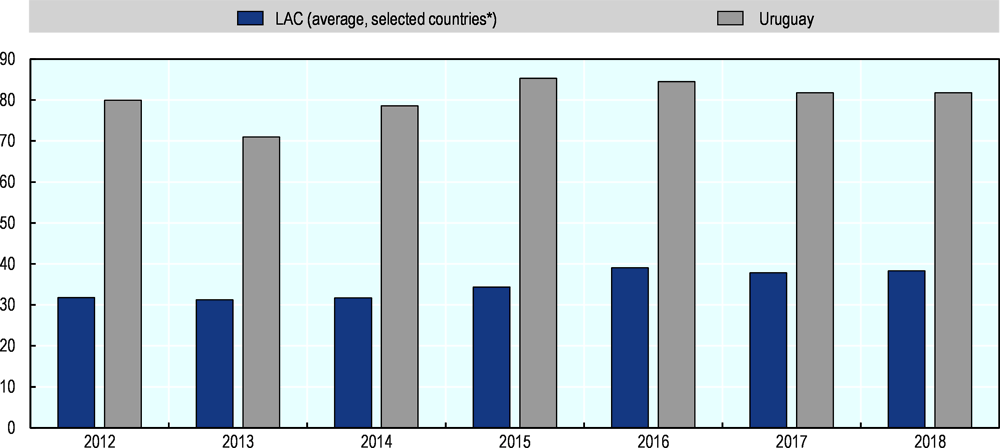
In relative terms, Uruguay is one of the most open economies in the LAC region, as measured by the share of FDI liabilities in GDP, and has sustained such openness for a number of years (Figures 2.6-8). The share of FDI assets to GDP is lower, and according to the statistics provided by the Central Bank of Uruguay, 20 firms account for the majority of the country’s FDI assets, 98% of which is generated by resident foreign-owned firms.4 From this perspective, Uruguay has a potential of further increasing internationalisation of domestic-owned firms; building on several examples of Uruguayan companies operating abroad (see Box 2.1).
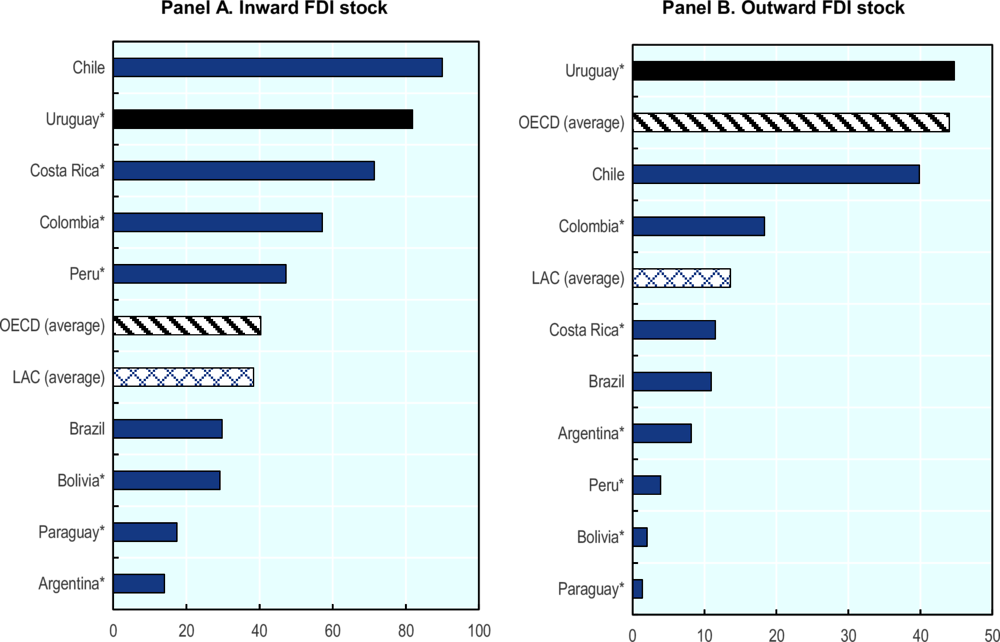
Note: *Countries using asset/liability method of compilation of FDI statistics. Data is for 2018 or the latest available year.
Source: OECD International Direct Investment Statistics and IMF Balance of Payment databases
In addition, complementary business statistics show that foreign-owned firms play an important role in the economy terms of their contribution to exports and other socio-economic metrics. For example, according to data of the National Statistical Office (INE), majority-foreign owned firms accounted for one third of total value added and of gross fixed capital formation.5 Existing studies for Uruguay also show that FDI has contributed to increases in productivity and wages in the period 1997–2005, in particular for skilled labour (Peluffo, 2015). Most recently, it has also been shown that selling to a local MNE increases export probability of domestic firms (Carballo, Marra de Artiñano and Volpe Martincus, 2019). Coupled with other business support and trade and investment promotion programmes, such linkages can, hence, facilitate internationalisation of local firms.
Note: *LAC average presented above covers the following countries: Argentina, Bolivia Brazil, Chile, Colombia, Costa Rica, Paraguay, Peru, and Uruguay. All LAC countries covered in the calculation of the average (besides Chile and Brazil), including Uruguay, report the data using asset/liability method of compilation of FDI statistics.
Source: OECD International Direct Investment Statistics and IMF Balance of Payment databases
… and FDI inflows have been strong overall
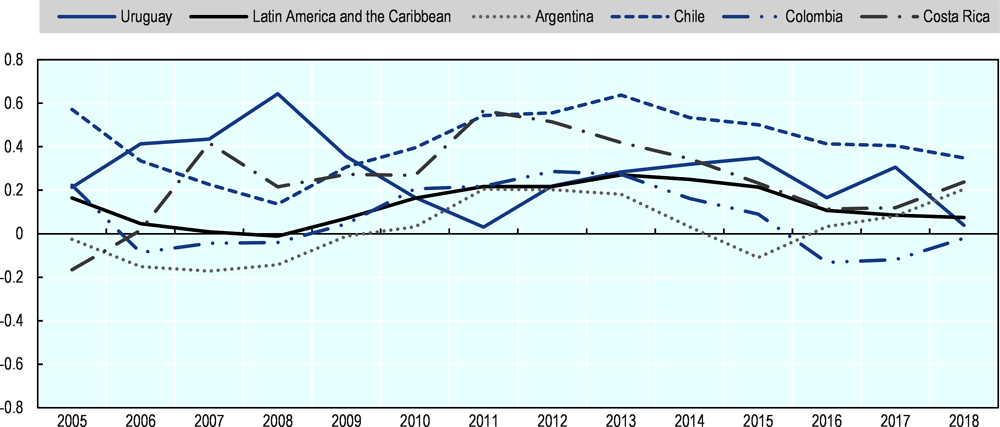
The general attractiveness of Uruguay as a location for foreign investment is also reflected in relatively strong FDI inflows. On average, inward FDI flows have been equal to 4.4% of GDP since 2012 and have generally been above the LAC average, except 2013 and 2016 (Figure 2.8). Yet, Uruguay has performed below Costa Rica and Chile, while fairing ahead of some other regional peers (Figure 2.9). More generally, from a historical perspective, the total amount of FDI and its share in the country’s GDP increased significantly in the 1990s and 2000s, and both indicators are among the highest seen in the country in the last fifty years (Uruguay XXI, 2019; de Castillo and García, 2012). The question remains, however, as to whether this dynamism can be sustained in the future, in particular in the context of decreasing FDI flows worldwide and instability in the LAC region, including in one of the important source of the country’s FDI – Argentina.
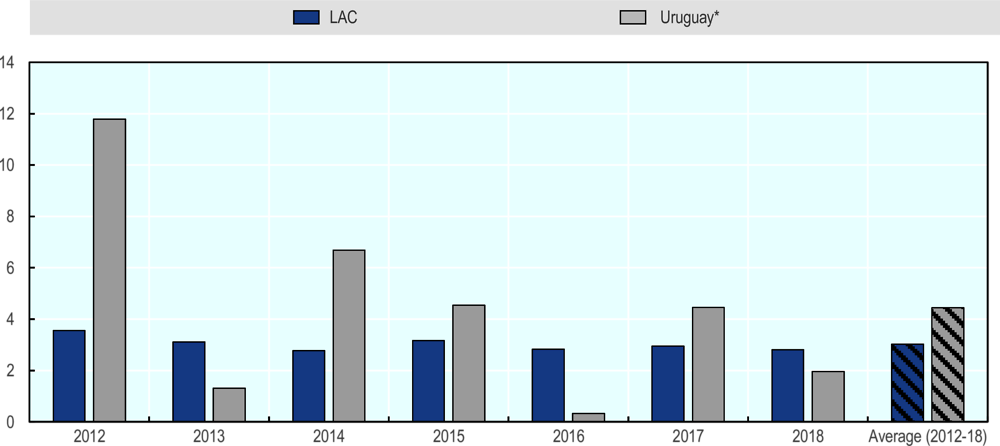
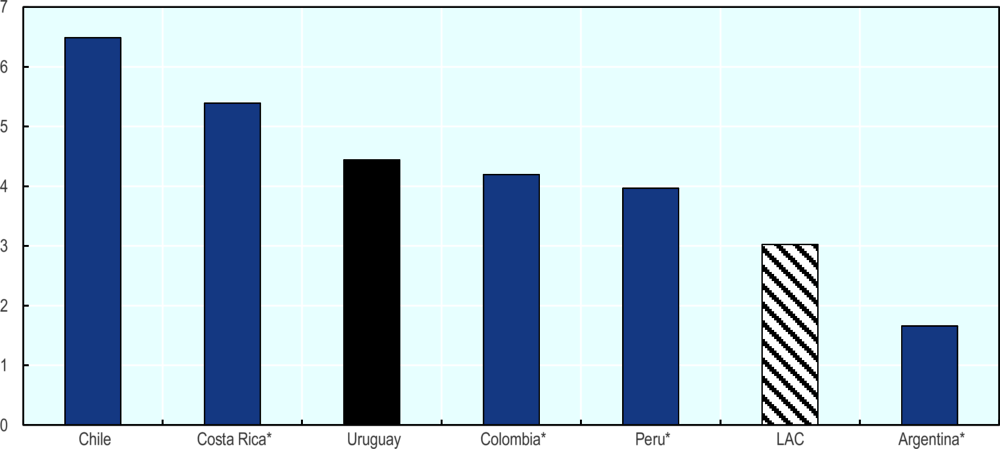
Note: *Countries using asset/liability basis method of compilation of FDI statistics. Uruguay uses a directional method of compilation of statistics on FDI flows.
Source: OECD International Direct Investment Statistics and IMF Balance of Payment databases
…but may require monitoring in the future.
Indeed, FDI inflows appear to have been decreasing in recent years, while FDI outflows have shown the opposite trend (Figure 2.10). In particular, quarterly data reveal that FDI inflows in the first quarter of 2019 were lower than the corresponding figures in 2017 and 2018 (Figure 2.11), at levels similar to the lowest point in 2016. Still, the recent decision (announced in July 2019)6 by the Finnish-owned forest industry company UPM – the largest foreign investor in the country – to construct a USD 2.7 billion pulp mill in central Uruguay, as well as invest in port operations in Montevideo and local facilities in Paso de los Toros, may help in stimulating investment in the economy, and may contribute to increases in inward FDI in the future, including through its potential signalling effect.


Equity share of FDI flows has remained positive…
It is worth noting that the decrease in FDI inflows in Uruguay has been mostly driven by debt – one element of FDI in the official statistics (see Box 2.1) – and specifically increases in lending by local affiliates to foreign parents, resulting in negative debt in 2013 and 2016 (Figure 2.12). The equity portion of FDI inflows has been more stable but also decreased in 2017 and 2018, suggesting that new capital injections have been a challenge. Still, Uruguay has not experienced any divestments thus far – the equity portion of FDI inflows has remained positive since 2012. The FDI outflows, meanwhile, are mostly comprised of debt, potentially pointing to financial considerations. These trends are also confirmed by the most recent data for the second quarter of 2019 (BCU, 2019).
Definition of FDI: Direct investment is a category of cross-border investment made by a resident in one economy (the direct investor or parent) with the objective of establishing a lasting interest in an enterprise (the direct investment enterprise or affiliate) that is resident in an economy other than that of the direct investor. This lasting interest is evidenced when the direct investor owns at least 10% of the voting power of the direct investment enterprise (a threshold applied in FDI statistics). The objectives of direct investment are different from those of portfolio investment whereby investors do not generally expect to influence the management of the enterprise. Direct investment statistics cover all cross-border transactions and positions between enterprises which are in a foreign direct investment relationship.
Equity includes common and preferred shares (exclusive of non-participating preference shares which should be included under debt), reserves, capital contributions and reinvestment of earnings. Dividends, distributed branch earnings, reinvested earnings and undistributed branch earnings are components of FDI income on equity.
Debt instruments include marketable securities such as bonds, debentures, commercial paper, promissory notes, non-participating preference shares and other tradable non-equity securities as well as loans, deposits, trade credit and other accounts payable/receivable. The interest returns on these instruments are included in FDI income on debt.
FDI financial transactions may be negative for three reasons. First, if there is disinvestment in assets— that is, the direct investor sells its interest in a direct investment enterprise to a third party or back to the direct investment enterprise. Second, if the parent borrowed money from its affiliate or if the affiliate paid off a loan from its direct investor. Third, if reinvested earnings are negative. Reinvested earnings are negative if the affiliate loses money or if the dividends paid out to the direct investor are greater than the income recorded in that period. Negative FDI positions largely result when the loans from the affiliate to its parent exceed the loans and equity capital given by the parent to the affiliate. This is most likely to occur when FDI statistics are presented by partner country.
Source: OECD (2008)

… and both greenfield and brownfield activity have been important.
In terms of mode of entry, greenfield FDI (i.e. construction of a new facilities) and brownfield FDI (i.e. mergers and acquisitions, M&As) appear to be equally attractive to investors when entering the Uruguayan market. While greenfield FDI was a predominant mode of entry in the 1980s and earlier periods, M&As have gained in importance over time. For example, while greenfield FDI accounted for 60% of the entries by foreign-owned exporting firms in the 1980s, the share fell to 40% in the 2010s (Figure 2.13). In addition, according to the Greenfield FDI Performance Index, which captures countries’ relative attractiveness for greenfield investment, Uruguay has seen a larger number of announced greenfield FDI projects than predicted by the size of its economy (Figure 2.14). In addition, Uruguay hovered above the LAC average through most of the period for which data is available, being outperformed only by Costa Rica and Chile among its peers.
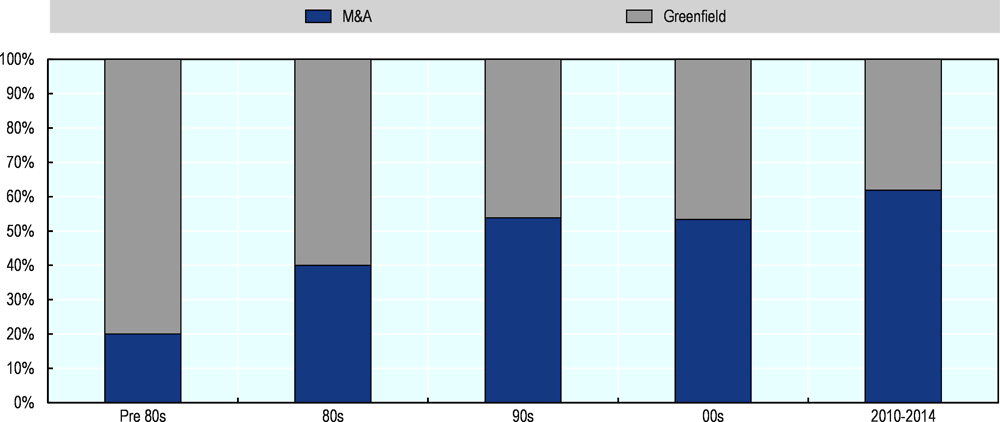
Source: Uruguay XXI
The recent announcement of the construction of a new plant in Uruguay by UPM (a greenfield project of about 3 bln USD), a company that has initially entered the market through an acquisition of an existing firm, also shows that the two modes of entry can be complementary and can result in employment creation and increases in productive capacity over time, in particular if the investor remains in the economy and expands. This also highlights the importance of retention assistance and aftercare services provided to investors by the government (see Chapter 7).
Note: The figure shows three-year moving average. The Index is calculated as a share of the value of greenfield FDI projects announced in the country to the world’s total value of greenfield FDI projects divided by the share of country’s GDP in the world’s GDP (normalised around 0). A value > 0 means that a country attracts more FDI than suggested by the size of its GDP.
Source: OECD calculations based on UNCTAD, using on information from the Financial Times Ltd, fDi Markets (www.fDimarkets.com).
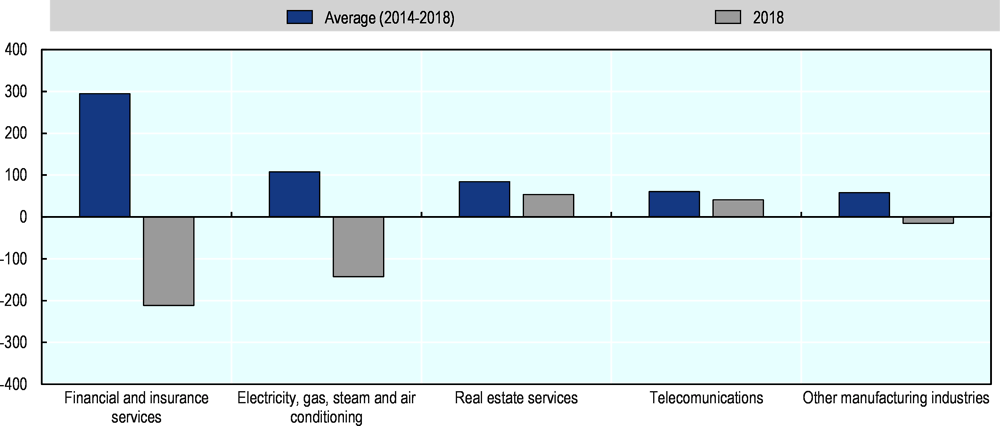
…but has primarily focused in services sectors, notably financial services…
There is still scope for further diversification of FDI in Uruguay. In particular, financial and insurance services have dominated Uruguay’s inward FDI inflows, accounting for the largest share of inward FDI flows in the last five years (Figure 2.15), even after recent decreases. Considering the importance of financial sector for FDI activities in Uruguay, the authorities could consider collecting and publishing FDI statistics separately for special purpose entities (SPEs), i.e. enterprises that may be established primarily for tax and other financial management purposes without a physical activity in the economy (Box 2.2). The examples of recent investment projects, realised as greenfield or brownfield investment, also provide an insight into the character of FDI in the country (Boxes 2.3 and 2.4).
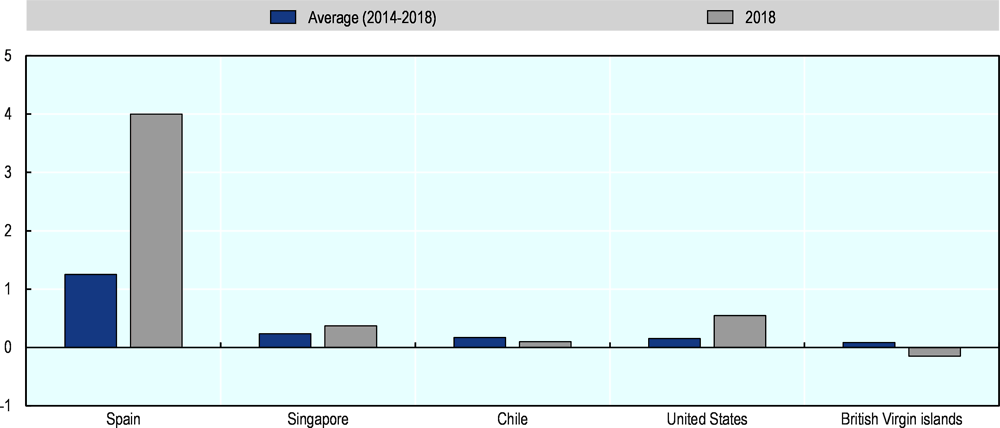
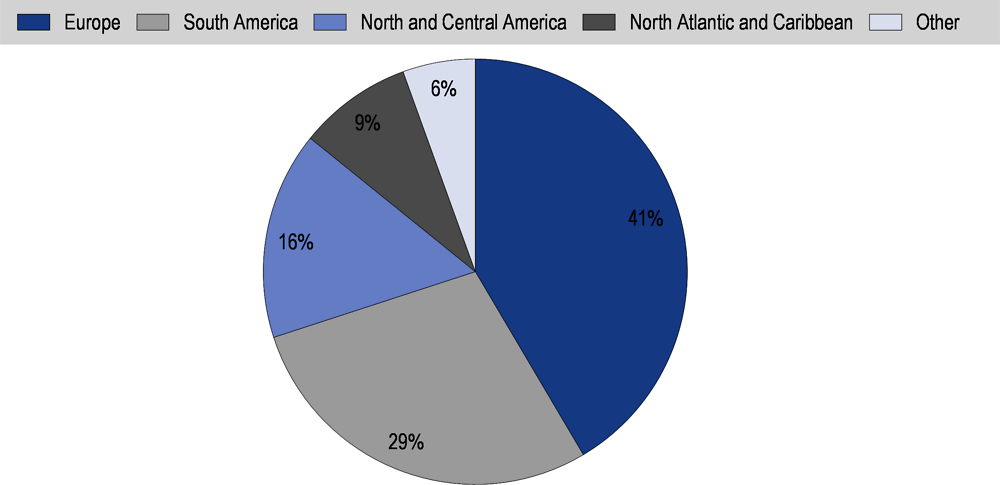
In terms of geographical distribution, Europe remains the most important source of FDI in Uruguay, accounting for over 40% of total inward FDI stock in the country, followed by South America with about 30% of the total, Figure 2.18). This reflects the important role of investors from both Spain and Argentina in the Uruguayan economy (each accounting for 17% of the total inward FDI stock in 2018, Figure 2.19). In terms of FDI inflows, Europe accounted for nearly two thirds of all FDI inflows in the last five years, with Spain being the most important foreign investor (Figure 2.16). Yet, the importance of countries that are commonly considered low-tax locations or tax havens as significant source for FDI in Uruguay (e.g., the British Virgin Islands) suggests that investment via SPEs may be affecting the distribution of FDI.
Special purpose entities (SPEs), such as shell or shelf companies, are companies that do not have substantial economic activity in the country but that are used by companies to raise capital or to hold assets and liabilities. With the proliferation of international activities and increase in intra-frim trade, including in intangibles, it has become increasingly easy for companies to shift profits across jurisdictions according to the most favourable tax environment through corporate structures built for that purpose. Just as gross trade flows may obscure the destination and origin of value-added produced in a given economy due to multiple shipments of goods across borders during the production process that spans several countries, so the passing of funds through SPEs can lead to the inflation of FDI statistics and the obscuring of the ultimate source and destination of FDI.
The OECD Revised Benchmark Definition of Foreign Direct Investment (BMD4) recommends that countries compile their FDI statistics excluding resident SPEs, and, then, separately for resident SPEs to provide a more meaningful measure of direct investment into and out of an economy (see OECD, 2008). For the country hosting the SPEs, this recommendation improves the measurement of FDI by excluding inward FDI that has little or no real impact on their economies and by excluding outward FDI that did not originate from their economies. Four countries—Austria, Hungary, Luxembourg, and the Netherlands—have reported FDI flows and positions excluding resident SPEs to the OECD for several years. With the implementation of the latest standards, 30 OECD countries currently report FDI data excluding resident SPEs. In some countries, such as Luxembourg, Netherlands or Hungary, SPEs account for a sizable share of inward FDI stock (Figure 2.18) and, if not accounted for, could distort FDI statistics. Even in countries where SPEs do not play a significant role currently, it is useful to be able to identify resident SPEs in the FDI statistics so that their role can be monitored, especially as, by their nature, SPEs are easily established and can grow rapidly and distort investment flows in particular years.
Source: OECD. For more information, see the OECD website on International Investment Statistics: www.oecd.org/daf/inv/mne/statistics.htm
Note: Uruguay uses a directional method of compilation of statistics on FDI flows. Average FDI inflows for 2014-2018. Only equity and reinvestment portion of FDI inflows is shown in the figure above. When aggregated, average FDI inflows from Europe were USD 776 million in 2014-18 (i.e. 73% of all FDI inflows in Uruguay).
Source: Central Bank of Uruguay (BCU)
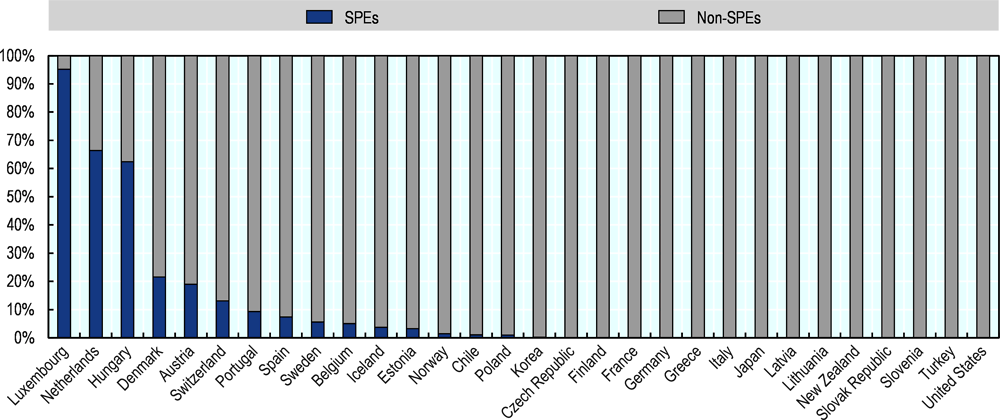
Note: Data for Australia, Canada, Ireland, Israel, Mexico, and UK are not available with a split for SPEs and non-SPEs. Data for Denmark, Greece, Korea, Norway and Switzerland is available for 2016.
Source: OECD International Direct Investment Statistics

Various instruments of public support can support FDI diversification…
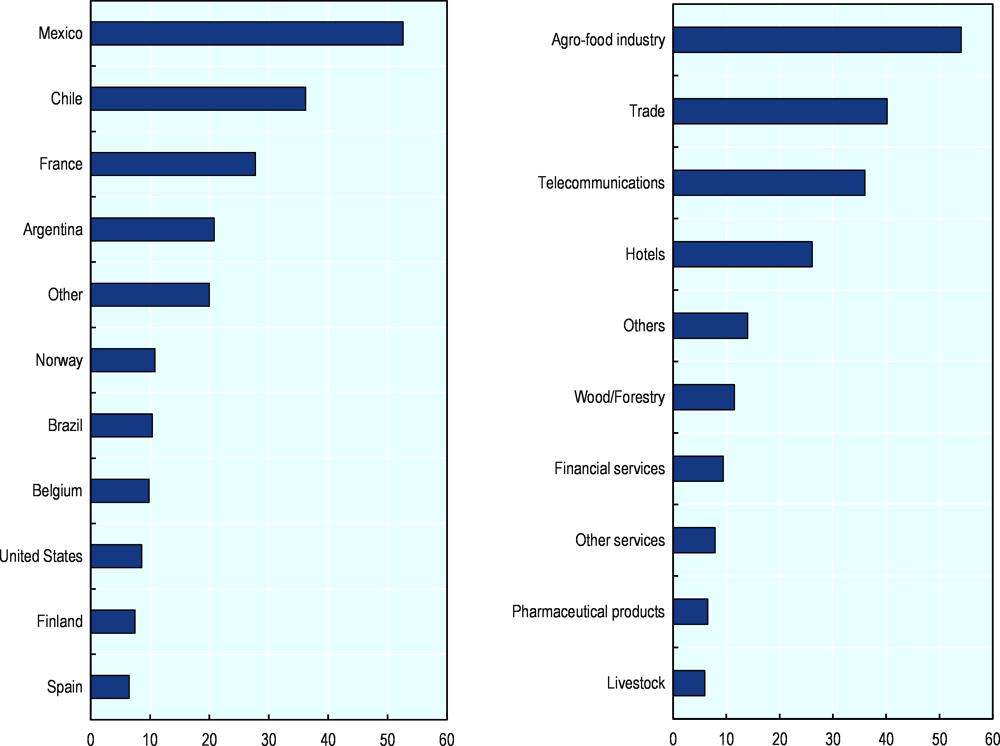
Public policies have a role to play in shaping the distribution of FDI as well as business activity in the country more generally. For example, investment projects supported through the Law on Investment Promotion (COMAP), discussed in detail in Chapter 6-7, are often in sectors and from home countries that otherwise do not receive high levels of FDI, aiming to support the process of economic diversification and growth. For example, most of the projects supported via COMAP were realised by investors from Mexico, Chile and France (Figure 2.20). With further improvements to the system of selecting projects to be supported by COMAP (described in Chapter 6-7), the focus on promising source countries and destination sectors with potential that do not naturally receive high levels of investment could contribute to the country’s productive transformation.7
Free economic zones (FEZs) also play an important role in terms of the location of foreign investors in Uruguay as well as the source of country’s exports. For example, in 2017, over 1 200 firms were located in FEZs, over half of which were exporters. According to the Ministry of Economy and Finance and the Central Bank, exports from FEZs in Uruguay accounted for nearly one third of total national exports (MEF, 2019a).8 They also account for 2.3% of total investment (MEF, 2019b) and employ about 14 000 people (MEF, 2019c). Zonamerica is by far the largest FEZs in Uruguay, accounting for about 40% of exports, investment and employment generated by all the country’s FEZs in 2017. Overall, about 30% of investments in FEZs are in manufacturing and 50% in services. According to the authorities, through the provision of investment incentives as well as infrastructure and tailored services within them, the zones can help support the development of various high value-added business and audio-visual services (for which a thematic FEZ has been created) as well as advanced manufacturing, such as pharmaceutical products. As discussed in Chapter 6, rigorous impact evaluations of the current incentives regime are largely limited to the COMAP regime (e.g. Llambi et al. 2018), making an overall assessment of costs and benefits of FEZs more difficult.
Continuous regulatory changes that aim to respond to global trends in certain emerging industries– as exemplified by the growing renewables sector (Box 3.2 in Chapter 3) and the market for legal cannabis in Uruguay (Box 2.4 below) – and efforts to coordinate proactive investment promotion and facilitation initiatives of various public and private actors (Chapter 6) can also help attract FDI into new market niches.
Uruguay has seen a number of greenfield and M&A project besides the two mega-deals associated with the activity of UPM-Kymmene – first an acquisition of Oy Metsa Botnia Ab´s operations in Uruguay by the Finnish forestry firm for 1.2 bln USD in 2009, and the recent announcement of the greenfield investment of 2.7 billion USD in 2019. Some recent examples are listed below.
Montevideo Refrescos SRL: Soft Drinks; Investor Origin: Mexico, Investment value: 251 mln USD
ICC Labs: Pharma, Investor Origin: Canada, Investment value: 223 mln USD
Baluma SA: Entertainment; Investor Origin: Chile, Investment value: 180 mln USD
Weyerhaeuser: Forestry; Investor Origin: Brazil, Investment value: 402 mln USD
Hotel San Rafael: Hotels; Investor Origin: Italy, Investment value: 400 mln USD
GLA - La Caleta: Shopping; Investor Origin: Argentina; Investment value: 150 mln USD
Altius: Shopping and Hotel,: Investor Origin: USA; Investment value: 150 mln USD
Alsea: Restaurants, Investor Origin: Mexico; Investment value: 49 mln USD
While less common in the manufacturing sector, there are also several notable examples:
Grupo Marfrig of Brazil has progressively integrated three meat packers (Frigorífico Tacuarembó, La Caballada and Colonia), thus becoming Uruguay’s largest processed meat exporter;
US-based Velcro Companies, the world’s largest fastener systems producer, built a new plant in 2015 –Velcro’s biggest investment in recent years;
Faurecia of France, a global leader in automotive technology, produces car seats for exports, mostly to neighbouring Mercosur countries;
Italian dairy brand Parmalat returned to Uruguay after its controlling company, France’s Lactalis, acquired two plants in Uruguay under the name Indulacsa.
Investment Promotion Agency of Uruguay, Uruguay XXI, publishes quarterly FDI monitor with information on the latest investment deals and investment opportunities in the country, which is available on the agency’s website: www.uruguayxxi.gub.uy/en
Source: Dealogic, Uruguay XXI, OECD
Finally, linkage programmes connecting foreign and domestic firms can also play an important role, and can open new opportunities in the domestic and foreign markets for local firms. For example, a recent study by the IDB shows that when a domestic firm is a supplier of a multinational firm established in Uruguay, it increases the firm’s probability to start exporting directly in a subsequent year by 70% (Carballo et al., 2019). In this respect, the Investment Promotion Agency, Uruguay XXI, described in Chapter 7, and other government bodies can help forge such business connections between foreign investors and local firms through matching initiatives.
Recreational cannabis has been legal since December 2013 (Ley Nº 19172), making Uruguay one of the first countries to legalise cannabis. The Regulatory and Control Institute for Cannabis (The Instituto de Regulación y Control de Cannabis de Uruguay, IRCCA) was also established. The latest figures on the industry’s growth can be found on the regulator’s website (www.ircca.gub.uy). Export of medical marijuana is permitted to countries where its use is legal.
In addition to a comprehensive cannabis law, Uruguay has attracted considerable investors’ interest for three reasons. First, growing conditions are optimal, on account of easy access to low-cost and fertile land. Second, on the domestic market demand has outstripped supply, possibly due to competitive pricing to attract non-registered users (that are estimated to be at least four times as numerous as registered ones). Third, Uruguay is the only country where regulations currently permit the cultivation of certain plants on a commercial scale. Moreover, public institutions are proactively engaged in this strategy to promote investment in the industry. For instance, Uruguay XXI attends global industry events; and Institut Pasteur de Montevideo, a foundation between the Uruguayan and French governments, established a strategic partnership with Dormul, one of the companies in the sector. ICC's new CBD extraction facility is strategically located within the Science Park free trade zone. In addition, the Chamber of Medical Cannabis Companies, which groups 14 firms, was established in late 2018. Investments are strictly controlled, to prevent inter alia money laundering.
IRCCA has approved cannabis projects worth USD57 million since 2015 and is currently reviewing other permits for 21 projects worth approximately USD40 million. It plans to increase the number of licensed producers that supply recreational cannabis to pharmacies from two – ICC and Symbiosis – to as many as five. In addition, the sector has attracted foreign investment. For example, Big North American cannabis companies, some of which are listed, have started to consider Uruguay as a production, with the prospect of the country becoming the first to reach USD1 billion in annual exports of medical cannabis products by the mid-2020s.
Fotmer, is a wholly-owned subsidiary of Silverpeak Life Sciences, one of the largest companies in Canada’s medical marijuana industry. It currently employs 80 people and is investing USD7 million in 35 000 marijuana plants laboratories and 10 tons of crops. Fotmer has requested IRCCA to increase its annual production permit and it aims to quadruple production and build a larger extraction lab in 2020.
Khiron Life Sciences bought Dormul, which has obtained the first licence to produce medical cannabis with THC for commercialisation in Uruguay. In addition, Dormul has an application pending for its extraction licence, which could allow the company to be approved for medical cannabis-based oils for both domestic and export purposes.
In 2018, a USD12 million ICC laboratory was inaugurated, and bought in 2018 by Aurora Cannabis, also from Canada, for USD217 million.
In line with the experience elsewhere, investors have raised issue of administrative burdens. In Uruguay, the Ministry of Public Health shares responsibility with the manufacturer for any damaging side effect produced by a medicine. As a result, the approval of oils and ointments from marijuana requires standard medicinal tests, which can take up to 10 years to complete.
Source: Uruguay XXI (2019)
… and internationalisation support can help domestic companies expand abroad
Finally, there is further scope for both understanding better and supporting foreign expansion of Uruguayan firms via FDI. As reflected in total outward and inward FDI stock, the activities of Uruguayan companies abroad remain less important than activities of foreign-owned enterprises in Uruguay. In addition, most of the outward FDI stock is generated by foreign-owned firms that are established in Uruguay rather than domestic firms (BCU, 2019).9 As such, the government could consider understanding better the nature of activities of Uruguayan firms abroad as well as specific barriers faced by them in order to better support their internationalisation efforts.10 To-date the information remains largely anecdotal. For example, in 2018, there were only two Uruguayan companies among the top 500 largest firms in Latin America, according to the ranking compiled by América Economia (2019).11
Considering the dynamism and relative strength of some sectors in Uruguay, there could be scope for further growth of Uruguayan firms in foreign markets, in particular in the LAC region. Several examples of successful expansions of Uruguayan companies abroad demonstrate the feasibility of the exercise (Box 2.5). Going forward, active and consistent export and investment promotion and facilitation policies, could also make a beneficial contribution in this respect (see Chapter 7) along with experience sharing among firms. The government could consider engaging in dialogue with Uruguayan firms to understand better the nature of challenges faced in foreign markets and the scope for possible government action.
Over the past two decades, a number of Latin American companies have emerged as global, or at least regional players, in a number of sectors. In some cases, the multinational enterprises from the region, or multilatinas, have been so effective as to consolidate global industries (e.g., Cemex in building materials, Vale in iron extraction, and JBS Friboi and Marfrig in meat processing). Uruguayan companies, facing limited domestic opportunities due to the small size of the local market, and growing in sophistication by the relative affluence of national consumers, started investing in neighbouring countries as early as in the 1920s. Tabacos Monte Paz, for instance, bought extensive land in Brazil and Argentina and operated purchasing branches in Salvador de Bahía and La Habana. Several examples of Uruguayan multilatinas point to feasibility of further internationalisation of local firms:
Dairy cooperative Conaprole (Cooperativa Nacional de Productores de Leche), established in 1935, is the country’s largest private company, with sales of over USD 1 billion, 1 850 employees and roughly 2 000 milk farmers (tamberos). It has a 70% market share in Uruguay and is Latin America’s largest exporter of dairy products.
Created in 1929, Frigorífico Modelo has various business lines connected to food and agriculture and is building a USD 7 million plant in Asunción, Paraguay.
Monte Paz sells more than 20 tobacco brands and controls 90% of the local market. It remained the country’s sole cigarette manufacturer after the closure of Philip Morris International’s subsidiary, Abal Hermanos. It is estimated that Monte Paz has annual foreign sales in excess of USD 40 million, mostly to Paraguay.
Union Agriculture Group (UAG) was established in 2008 to grow cranberry and rapidly became one of Uruguay’s largest land holders. It concluded the first IPO on the Montevideo stock exchange in 30 years in 2012 and acquired 67 000 hectares from Argentina’s El Tejar, reaching the area under exploitation of over 170 000 hectares (mostly soy). UAG has suffered from financial difficulties in recent years.
The technology park Zonamerica, which is estimated to generate over 1.8% of the country’s GDP and 1% of total investment, hosts over 600 enterprises and employs nearly 7 000 people. In partnership with Colombia’s Grupo Carabajal, it is investing USD 350 million to build a zone in Cali, expected to create 20 000 jobs.
Grupo Biotoscana — controlled by the U.S. investment fund Advent International— acquired Laboratorio DOSA in Argentina, a pharmaceutical laboratory specialising in treatment for severe lung diseases, for USD 29.9 million.
Artech Consultores is a software producer, founded in 1988. Its most famous product is Genexus, a development tool to create, develop and maintain multi-platform apps and build customised products that is sold in over 30 countries and generated sales for more than USD 50 million in 2017. Artech moved to larger foreign markets at a very early stage, opening branches in Brazil and Mexico.
Scanntech’s technology platform connects independent retail stores with global consumer products companies, financial and telecommunications firms, and government services. The company, which is backed by Latin American venture capitals and the IADB and the first one in the Continent to be invested by Sequoia Capital, has launched in Argentina, Chile, Paraguay, Brazil, and Peru.
Uruguay has been successful in attracting FDI into the economy. Despite its small size, thanks to its political and macroeconomic stability and other factors, it has mobilised significant amount of foreign investment over the years. As such, it boasts one of the highest shares of inward and outward FDI to GDP in the region.
Yet, as the global FDI subsides and instability in the region increases, the country may find it difficult to sustain the momentum, which appears to be supported by the most recent figures. The decision of UPM, a large Finnish forest industry company, to undertake a large greenfield FDI investment and build a high-technology cellulose pulp plant, could potentially serve as an important signalling effect to investors, counterbalancing the unfavourable political and economic environment in the region.
Beyond attracting more FDI, Uruguay’s governments is also increasingly conscious and interested in attracting investment that contributes to broader socio-economic goals of the country. As such, policies aimed at investment promotion and facilitation are undergoing reforms to enable the government to attract MNEs that not only would otherwise not invest in the economy, but also support the country’s ongoing transition from resource-based to knowledge-based competitiveness. In addition, domestic firms may benefit from the government’s proactive and consistent internationalisation support and linkages with foreign buyers to increase their footprint abroad.
Maintain macroeconomic stability and open trade and investment policies, which are pre-conditions for attracting FDI.
Build on the important signalling effect to investors of large, high-tech investment projects to build an effective upgrading strategy.
Adopt policies aimed at investment promotion and facilitation in order to accelerate the country’s ongoing transition from resource-based to knowledge-based competitiveness.
Introduce proactive and consistent policies to accompany the internationalisation of domestic firms and induce linkages with foreign buyers to increase their footprint abroad.
References
OECD International Investment Statistics database, www.oecd.org/fr/investissement/statistics.htm
OECD FDI in Figures in LAC, www.oecd.org/investment/FDI-in-Figures-April-2019-Latin-America-English.pdf
Uruguay XX1 (2019), Oportunidades de inversión, Inversión extranjera directa en Uruguay, www.uruguayxxi.gub.uy/es/noticias/articulo/inversion-extranjera-directa-mejora-en-2019/
Uruguay XXI (2014), Comportamiento Exportador de las Empresas Extranjeras en Uruguay, www.uruguayxxi.gub.uy/uploads/informacion/0fd3957070920f2978c45647882c3b771f18e676.pdf
del Castillo G. and D. García (2012), “Inward FDI in Uruguay and its policy context”, Columbia FDI Profiles, Vale Columbia Center on Sustainable International Investment.
OECD (2008), OECD Benchmark Definition of Foreign Direct Investment, 4th Edition, www.oecd.org/daf/inv/investmentstatisticsandanalysis/40193734.pdf
Carballo J., I. Marra de Artiñano and C. Volpe Martincus (2019), “Linkages with Multinationals and Domestic Firms' Performance”, Trade and Integration Sector, IDB Technical Note No. IDB-TN-01746, www.publications.iadb.org/publications/english/document/Linkages_with_Multinationals_and_Domestic_Firms_Performance_en.pdf
MEF (2019a) Contribución a las Exportaciones en 2017, Análisis de las Exportaciones desde Zonas Franca, Censo De Zonas Francas, Ministry of Economy and Finance of Uruguay, http://zonasfrancas.mef.gub.uy/innovaportal/file/27029/1/contribucion-a-las-exportaciones-en-2017---analisis-de-las-exportaciones-desde-zonas-francas.pdf
MEF (2019b) Contribución a la Inversión en 2017, Análisis de la Inversión en Zonas Francas, Censo De Zonas Francas, Ministry of Economy and Finance of Uruguay, http://zonasfrancas.mef.gub.uy/innovaportal/file/27028/1/contribucion-a-la-inversion-en-2017---analisis-de-la-inversion-en-zonas-francas.pdf
MEF (2019c) Contribución al Empleo en 2017, Análisis del Empleo en Zonas Francas, Censo De Zonas Francas, Ministry of Economy and Finance of Uruguay, http://zonasfrancas.mef.gub.uy/innovaportal/file/27027/1/contribucion-al-empleo-2017--analisis-de-la-ocupacion-en-zonas-francas.pdf
Notes
← 1. Reducing FDI restrictions (as measured by the OECD FDI Regulatory Restrictiveness Index) by about 10% is found to increase bilateral FDI in stocks by 2.1% on average (Mistura and Roulet, 2019).
← 2. These figures are based on assets/liabilities method of compiling FDI statistics. Meanwhile, the data on FDI flows as well as stocks by country and sector activity are compiled using the directional principle. In some cases, there can be differences in the value of investment reported using the directional or assets/liabilities method. For more information, see: http://www.oecd.org/daf/inv/FDI-statistics-asset-liability-vs-directional-presentation.pdf
← 3. Inward FDI stock has increased by 6% and inward FDI stock by 3%, on average, in years 2012-2018. Inward FDI is called liabilities and outward FDI assets in the terminology of the asset-liabilities standard for compiling statistics (see e.g. OECD, 2014 for more information).
← 4. Information shared by the Central Bank of Uruguay during a workshop on the role and the effects of FDI on the Uruguayan economy organised by Uruguay XXI: http://www.uruguayxxi.gub.uy/es/centro-informacion/articulo/jornadas-de-discusion-sobre-insercion-internacional-2019/
← 5. The data is based on the Annual Survey of Economic Activity (Encuesta Anual de Actividad Económica), currently available for years 2013-2014 with (years 2015-2018 are under preparation). For more information, see www.ine.gub.uy/encuesta-anual-de-actividad-economica
← 6. For more information, see the company’s press release: http://www.upm.com/about-us/for-media/releases/2019/07/upm-continues-its-strategic-transformation-and-invests-in-a-world-class-pulp-mill-in-central-uruguay
← 7. Considering that COMAP applies to both foreign and domestic investment, and on average 60% of supported projects in the last decade were by domestic-owned firms (Uruguay XXI, 2019), it has a potential of influencing broad investment decisions.
← 8. The statistics on business activity in FEZs are available on the website of the Ministry of Economy and Finance: http://www.zonasfrancas.mef.gub.uy/18424/4/areas/estadisticas-zzff.html
← 9. Information provided by the Central Bank of Uruguay during the workshop on the role and the effects of FDI organised by Uruguay XXI in December 2019.
← 10. Information could be gathered through relevant institutions, including the Central Bank, Uruguay XXI, Chambers of Commerce and the network of embassies and consulates abroad. Surveys of domestic firms could also shed light on the barriers faced when expanding abroad.
← 11. ANCAP is ranked 292nd and UTE 362nd.