... your login credentials do not authorize you to access this content in the selected format. Access to this content in this format requires a current subscription or a prior purchase. Please select the WEB or READ option instead (if available). Or consider purchasing the publication.
AA
A+
A-
Annex C. OECD DAC standard suite of tables on the European Union
Table C.1. Total financial flows
USD million at current prices and exchange rates.
Table C.2. ODA by main categories
Table C.3. Bilateral ODA allocable1 by region and income group
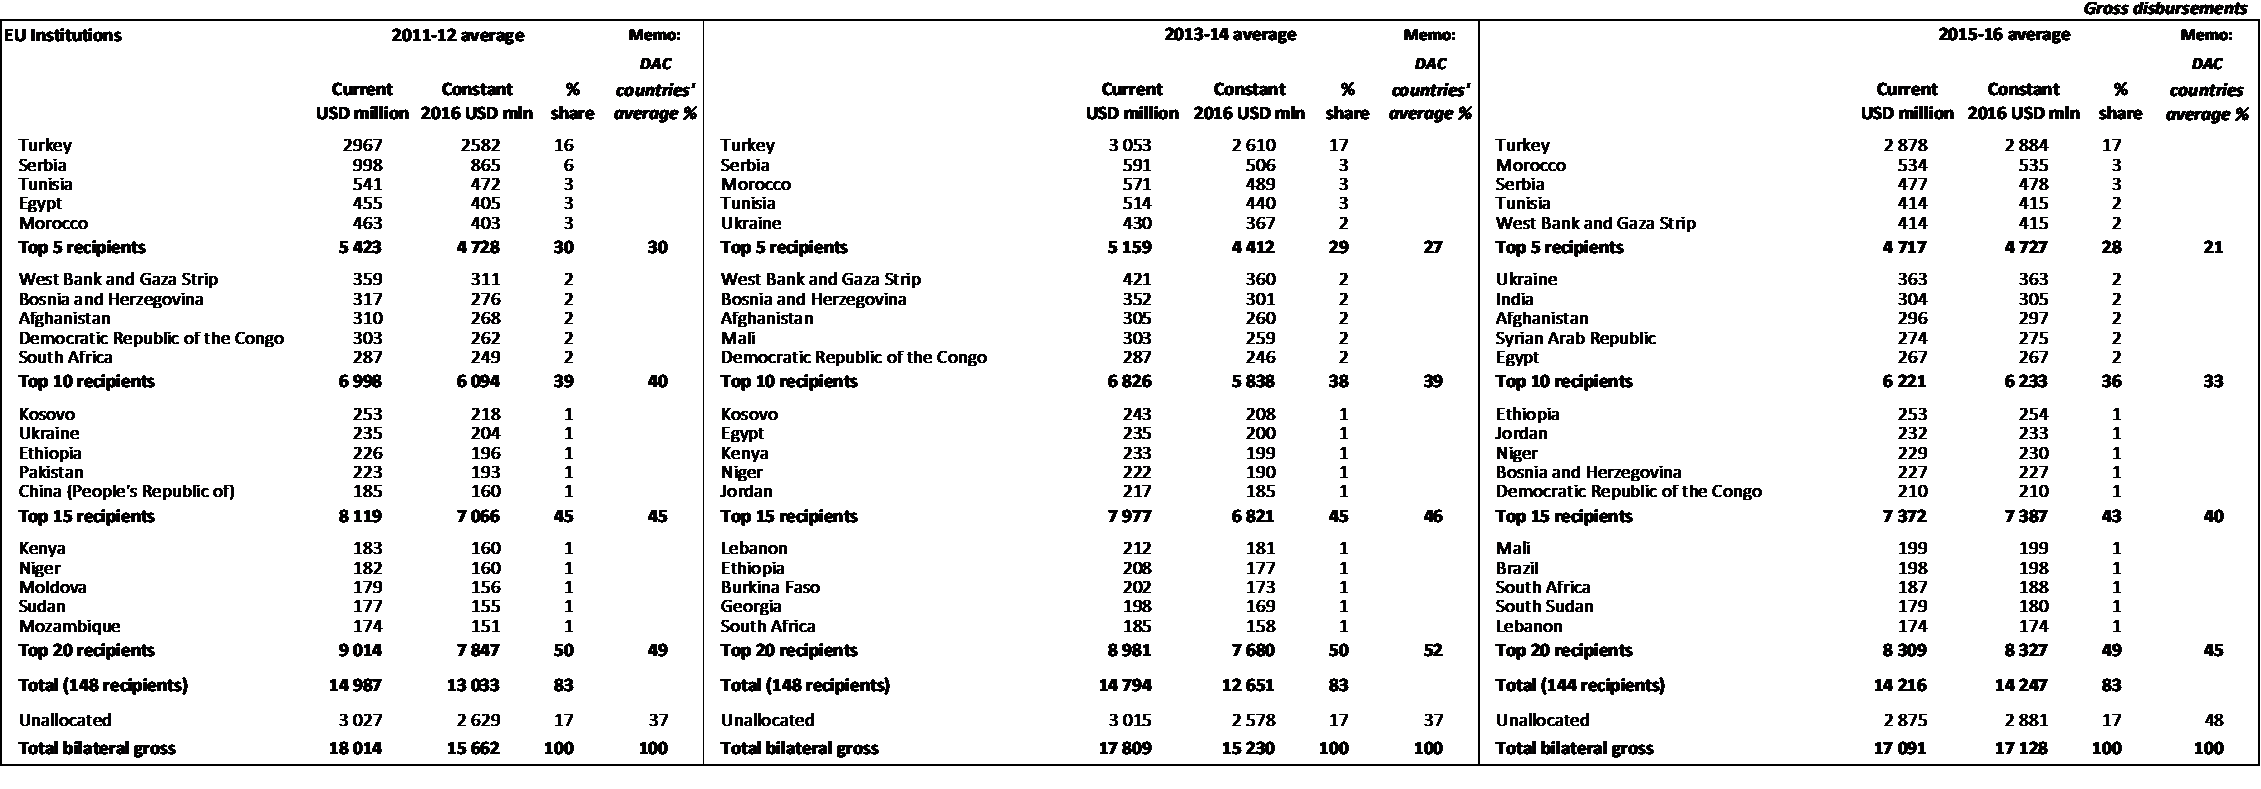
Table C.4. Main recipients of bilateral ODA
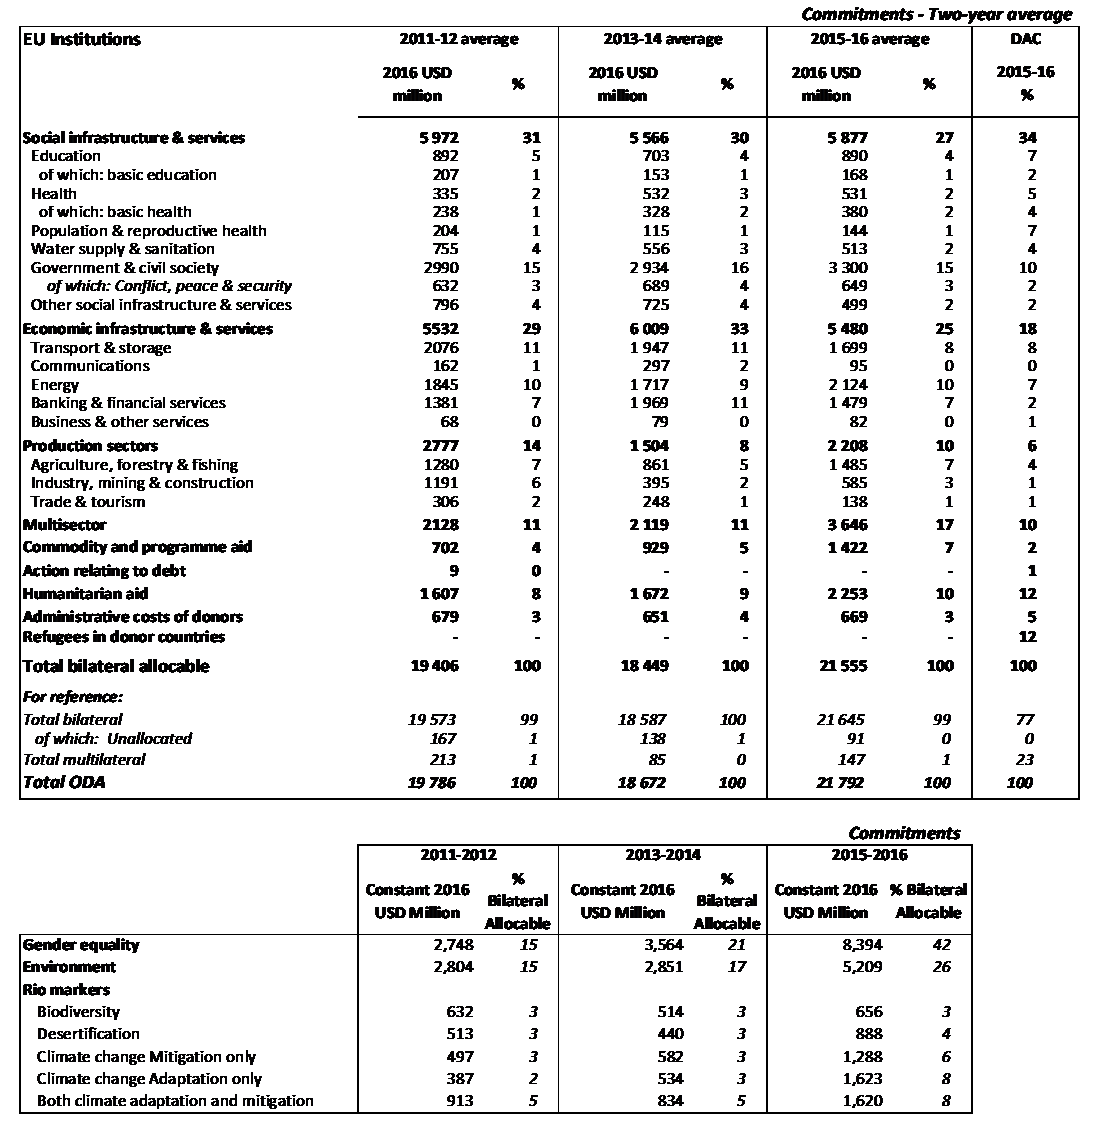
Table C.5. Bilateral ODA by major purposes
At constant prices and exchange rates
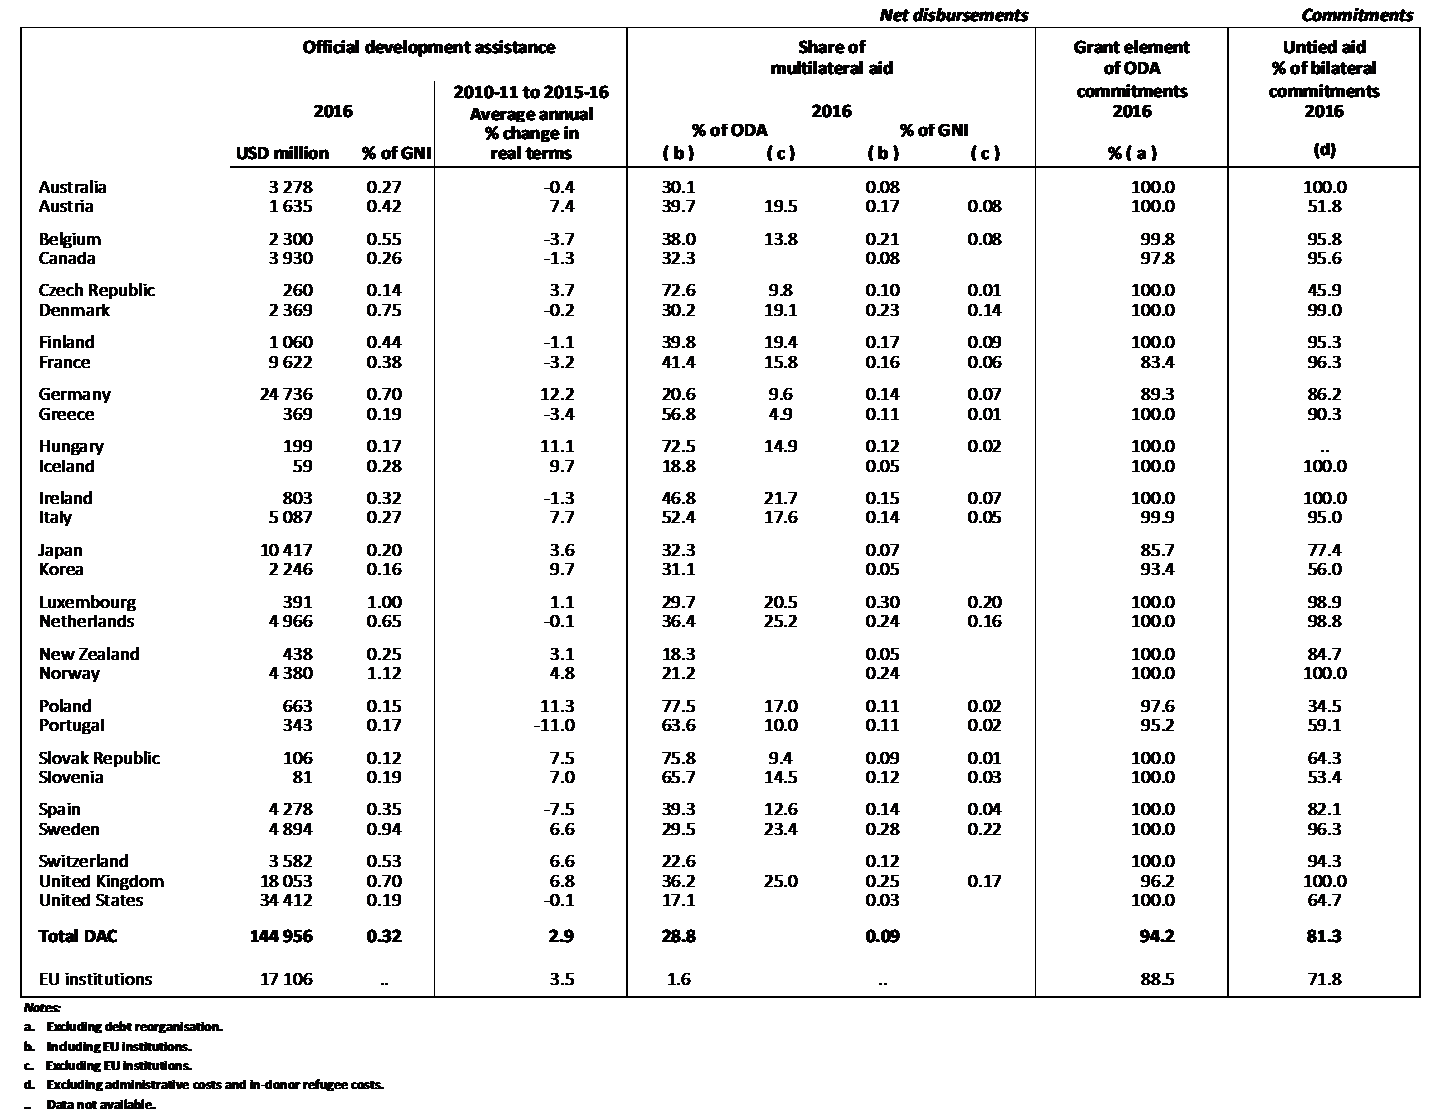
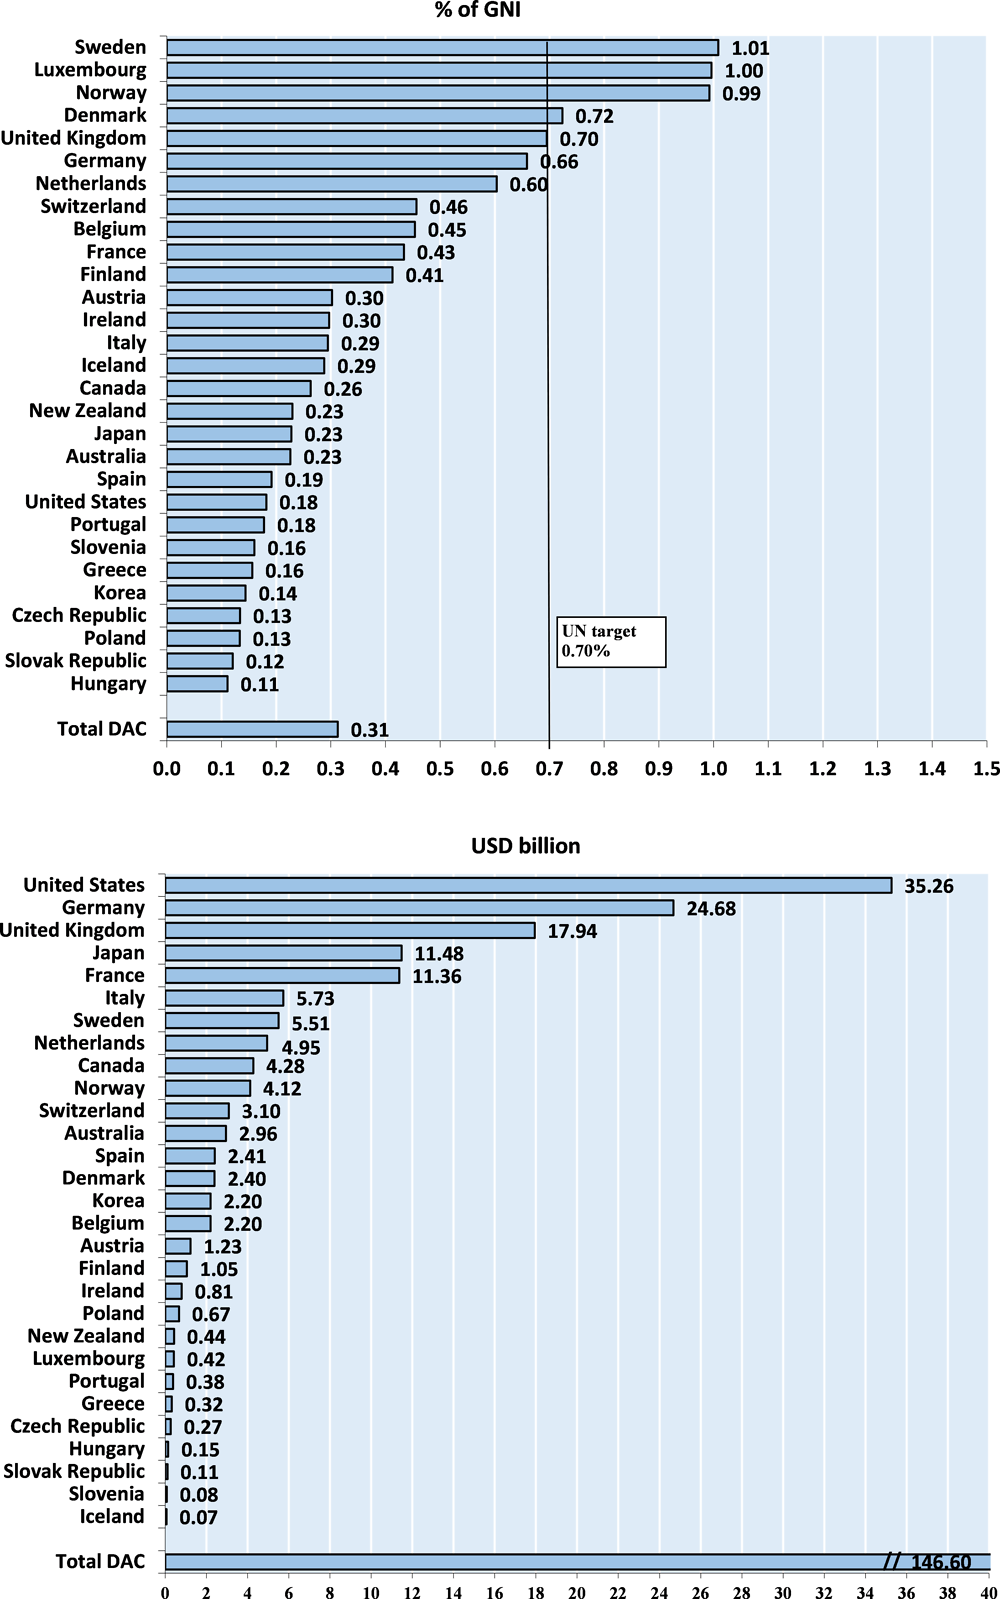
Table C.6. Comparative aid performance of DAC members