Chapter 2. Australia: Providing social protection to non-standard workers with tax financing
Changes in the nature of work and labour market regulation pose challenges to social protection systems relying on social insurance contributions. In contrast, the Australian system of social protection relies on general government revenue rather than social security contributions. In this system, some of the vulnerabilities of the social insurance state may not be so salient, but other challenges and trade-offs exist. In particular, Australia has been described as a “wage-earner’s welfare state” (Castles, 1985), with social protection linked to employment conditions, including relatively high minimum wages, paid sick, care, parental and holiday leave, workers compensation and mandatory occupational pensions. As in social insurance states, changes in the nature of work could potentially undermine these features of the Australian social protection system. A further difference is that the Australian social security system is highly income-tested, with spending being more targeted to the poor than any other OECD country. Administration of income-testing becomes more complicated if patterns of work become irregular or other circumstances, such as multiple job holding become common. This chapter assesses Australian employment and social security policies and institutions to identify strengths and weaknesses of the Australian approach to social security.
2.1. Introduction
Changes in the nature of work pose challenges to the social security systems of high-income countries, particularly those relying on contributory social insurance systems. These systems are based to varying degrees on workers satisfying contribution conditions that require or assume full-time engagement in paid work for the majority of years that individuals are in the labour force, together with formal arrangements for the payment and recording of contributions by employers and employees. They also often distinguish between employees and the self-employed. As temporary work and changing forms of employment contracts become more prevalent, the assumption of full-time, permanent formal employment threatens to become less representative, potentially undermining welfare state finances as well as the social protection of workers and their families.
This paper discusses the case of Australia, where virtually none of its system of social security is based on contributory social insurance principles. This offers the opportunity to explore a case study where some of the apparent vulnerabilities of the social insurance state may not be so salient, but where other challenges and trade-offs may have arisen in the context of other forms of social protection.
The paper is structured as follows: the next section of the chapter provides an overview of the Australian system of social protection and its guiding principles; this is followed by a brief discussion of how the system has developed over time in terms of its main programmes addressing lifecycle needs and social risks and how these compare with social protection in other OECD countries. The second section of the paper outlines the status of many of these alternative forms of employment within the framework of Australian employment law – which also differs in important ways from the systems of other OECD countries. This is followed by an overview of the current state of the Australian labour market in relation to the trends of concern – part-time employment and under-employment, self-employment and independent contractors, and the “gig economy”. The paper also compares the level of non-standard employment in Australia with that in other OECD countries. The third section then discusses the interaction between social protection design and the Australian labour market, identifying how different programmes deal with different risks and lifecycle phases and evaluating how these programmes address the challenges identified above. The fourth section discusses the incomes and assets of the self-employed and how they differ from employees and other households. The paper concludes with an assessment of how well the Australian system deals with the challenges of the changing nature of work.
2.2. Overview of the Australian system of social protection
Social security is only part of a broader system of social protection in Australia (Whiteford and Angenent, 2002). The Australian social security system differs from the social insurance systems common in other OECD countries, both in terms of how benefits are financed and also in terms of how benefits are distributed between income groups. In most OECD countries, the bulk of government benefits are financed by contributions from employers and insured employees, and benefits are often related to past earnings, so that higher income workers receive higher absolute levels of benefits if they become unemployed or incapacitated or when they retire.
In contrast, in Australia, most government benefits are flat-rate entitlements financed from general government revenue, and there are no explicit social security contributions required as a condition of eligibility. While the recently introduced Paid Parental Leave scheme (see Section 2.4.2), uses previous employment as a targeting mechanism to determine eligibility it does not require explicit contributions. In addition, most benefits are income tested and asset tested, so that entitlements reduce as resources increase (Whiteford, 2017). Within these income and assets tests, income from self-employment and business resources are treated differently from other employment or unearned income (see Section 2.4.2). To a very substantial degree, payments are the responsibility of the Commonwealth (national) government, with eligibility conditions and entitlements being uniform across the country.
It is important to note, however, that there are programmes at the level of Australian state governments – notably compensation for work accidents and motor vehicle accidents – that involve contributions of different sorts, and in the case of compensation for accidents or illness arising from work also pay high wage replacement rates. In addition, many public sector employees and some private sector workers also are covered by defined-benefit occupational pension schemes for retirement (although most of these schemes are now closed to new entrants).
Workers may also be entitled to various forms of social protection as part of their employment. Indeed, a famous characterisation of Australia is that it was a “wage-earner’s welfare state” (Castles, 1986), where “redistributive efforts were achieved using the instruments of wage regulation rather than traditional tax-and-spend welfare policies” (Deeming, 2013, p.669). This reflected the early introduction of a very high minimum wage, and the extensive regulation of conditions of employment.
Australia’s statutory minimum wage is the third highest in the OECD in purchasing power terms (OECD, 2017a), and due to the relatively low level of taxes (and the absence of social security contributions) (OECD, 2017b), the purchasing power of the full-time, after-tax minimum wage is the highest in the OECD (OECD, 2015b).
In 2010, Australia had the equal fifth lowest level in the OECD of in-work poverty among households of working age (4.3%) and the fourth lowest among working age households with all adults in employment (2.4%) (OECD, 2013). The design of the Australian social security system means that relative income poverty in working-age households in Australia is highly concentrated in households where no one is in paid employment (Whiteford and Adema, 2007; Davidson et al., 2018).
The scope of workplace regulation has changed significantly over time but remains important. Apart from very high income-replacement – up to full-replacement – rates for accidents at work, a majority of employed people are entitled to paid sick leave and paid carers’ leave of up to ten days a year (combined) paid at the base rate of pay as a minimum, as well as paid annual leave and public holidays.
Since the early 1990s, there has also been a mandatory superannuation savings system – the Superannuation Guarantee – covering most employees, which requires employers to contribute to individual accounts for their employees. These can be supplemented by employee contributions, and are supported by extensive tax concessions.
Because the Australian government income support system is not contributory, eligibility is based on residence and coverage of the population is broadly based. The main criteria for being covered is meeting residence requirements, falling into specific eligibility categories, and satisfying income and assets tests. Duration of payment receipt is not time limited, with income support payments being paid indefinitely subject to the continued meeting of eligibility criteria. Benefits are legal entitlements and recipients have the right to seek merits-based or judicial review of administrative decisions.
While income support payments are means tested, these income and assets tests are more generous than those typically applying in social assistance schemes in many other countries. This combined with Australia’s more generous rates of assistance, occurs as the Australian social security system operates as the primary system of support, rather than a residual form of support, for individuals with no or low income. As discussed below, the income tests for income support payments have also changed over time, with the withdrawal rate – the rate at which benefits are reduced as private income increases – in almost all cases being between 40 cents in the dollar and 60 cents in the dollar. In this regard, it can be argued that the Australian system is now more like a set of negative income taxes for eligible groups than a tightly targeted social assistance scheme for the very poor. In this regard, the Australian social security system is a unique form of social assistance, being less “generous” and more targeted than a social insurance system, but more “generous” than other social assistance systems.
In order to be eligible for most income support payments, individuals must fall into defined categories – such as having qualifying Australian residence and being over the relevant age pension age, being sufficiently disabled as to be relieved of an expectation to actively seek work, caring for a person with a disability, caring for young children, being unemployed, or being a student. In addition, each payment has a range of other eligibility conditions, including differing age and residence requirements, domestic circumstances and having income and assets below specified levels. Once these conditions of eligibility are satisfied, the level of benefits to which individuals are entitled will be calculated on the basis of the precise level of the income and assets of themselves and their partners and aspects of their family living arrangements.
According to the McClure Review of the Australian Welfare System (2015) there are around 20 income support payments of the types described above and 55 supplementary payments, which cover additional costs; the most important of the latter are related to the presence of children and to the housing costs of households, but also include additional support for carers, a range of education expenses and pharmaceutical, energy, transport and telephone costs, among other items. Spending on these cash benefits for children in Australia is the sixth highest in the OECD, and the fourth most progressive in terms of distribution (Stewart and Whiteford, 2018). They thus form a very important part of the income support package for low-income working families, including those in non-standard employment.
The Australian income support system has developed over time in relation to two broad types of need, themselves based on the relationship of individuals to the labour market. ‘Social security pensions’, initially, old-age and invalid pensions, were provided to those not expected to be in the labour force because of old-age, or disability. ‘Social security benefits’ (also referred to as ‘allowances’), initially, unemployment, sickness and special benefits, were provided to those expected to be in the labour force, but who were not currently in the workforce (because of unemployment, short-term illness or injury, or some other ‘special’ circumstance anticipated to be of short duration). However, the slow dissolution of the “wage earners’ welfare state” model in the 1970s and into the 1980s rendered these types of need increasingly irrelevant1; so that, by the mid-1990s, a number of new ‘social security benefits’ (i.e. Partner Allowance, Parenting Allowance, Widow Allowance, Mature Age Allowance) had been designed around long-term receipt of income support, in anticipation of being outside the labour force, or having minimal attachment to it. Developments since the mid-1990s have further blurred the distinctions between ‘social security pensions’ and ‘social security benefits’2. Legislative benchmarking of ‘social security pensions’ to a measure of average wages (from 1997), combined with indexation of pensions to the higher of the Consumer Price Index and a specially constructed ‘living costs’ index for pensioners and beneficiaries (2009), has resulted in a large (and still increasing) divergence between maximum rate packages structured around pensions versus benefits (where once, in the early 1990s, pensions and benefits packages were paid at close to the same maximum rates)
Overall, Australia is the sixth lowest spender on public social security cash benefits of 35 OECD countries, spending 8.6% of GDP in 2014 (Whiteford, 2017). However, it has the highest level of spending on income-tested benefits of any OECD country – 6.5% of GDP in 2012, with the next nearest countries being Ireland, Iceland and Canada (OECD, 2014). It also has the highest share of cash spending devoted to income-tested payments – nearly 80% of total benefit spending in 2012.3 As a result, Australia also has the most progressive distribution of all cash benefits in the OECD, with more than 40% of benefit spending being directed to the poorest 20% of the population (OECD, 2008).
Income support payment receipt is fairly common in Australia. In total, there are around 2.5 million people receiving Age Pension, and around 2.5 million people receiving working-age income support (Figure 2.1). In 2016, 27.5 % of the adult population were receiving an income support payment, comprising 76% of the population aged 65 and over and 16% of the population of working age.
Interpreting coverage of social security in an income-tested system will necessarily be different from coverage in a contributory system. On the whole, with the exclusion of those not residentially qualified for payment, the people not receiving income support payments will be those whose incomes and assets are high enough to exclude them from payments; that is, they will be better off than those who claim payments with limited or no private resources. The non-contributory nature of the Australian system will therefore tend to favour many of the groups who are not covered by social insurance in other countries, including those with interrupted work histories, secondary earners and part-time casual and seasonal workers, older working-aged migrants and people with lifetime disability, for example.
A further indicator of the different way in which the Australian system operates is the estimates of very high take-up of benefits among those eligible. For example, Baker (2010) estimated that take-up of Parenting Payments in 2008 was 94%, while take-up of Disability Support Pension was 98%, well above the levels found in many other OECD countries (Hernananz et al., 2004).

Source: DSS Payment Demographic data https://data.gov.au/dataset/dss-payment-demographic-data
As noted earlier, over time the Australian system of income support has evolved from a tightly income-tested social assistance system to a set of payments that are more like a set of negative income taxes for people who fall into the specific categories noted above. Since the late 1960s, the withdrawal rate on adult income support payments has been reduced from 100% to between 40% and 60%, with “free areas” of income below which payments are not reduced4; these are more generous for social security pension recipients than for recipients of social security benefits/allowances, with the exception of student payments. The free areas for student payments are particularly generous, however, this design in part reflects that maximum rates for students without children (both youth and adult) are well below those paid to unemployed adults.5 In addition, the system of payments for families with children seeks to provide support to families in part-time or casual or otherwise low-paid work, with taper rates on ‘adjusted taxable income’ (once income exceeds the income free area) of between 20% and 30%. However, this support is undermined to some extent, particularly for families with variable incomes throughout a financial year, by the need for recipients of fortnightly payments to ‘estimate’ their ‘adjusted taxable income’ for a full financial year; see Whiteford, Mendelson and Millar, (2003).

Source: DSS Payment Demographic Data - Datasets - https://data.gov.au/.
These changes particularly for social security benefits/allowances were designed to encourage part-time work by recipients with, for those with full-time job search obligations, the objective of facilitating the transition into full-time work. For members of a couple, the changes were accompanied included the provision of income free areas and lower taper rates for both members of a couple, ensuring that a second earner was rewarded for taking up work. There are also a range of provisions designed to smooth transitions between the income support system and employment, or back into the income support system. For example, there are abridged reclaim procedures if a person loses qualification for a payment or benefit and reapplies for that payment or benefit within 13 weeks of the cancellation. These have the effect of reducing the incidence and severity of breaks in receipt of government benefits following ‘peaks’ in receipt of private income. A related feature is Working Credits, which accumulate when the total income of the recipients is less than their “free area” of AUS 48 per fortnight (including paid work and investments). Working credits can accumulate up to a maximum of 48 each fortnight, to a maximum of 1 000 Working Credits, which can then be run down if a recipients gains more substantial earnings, so that they do not immediately lose their entitlements.
Overall around 11% of income support recipients have earnings from work with these levels being lowest for Age Pensioners and Disability Support Pensioners (Figure 2.2). For those of working age, around 17% have earnings as well as their income support payments. The highest level of earnings is received by those receiving Youth Allowance for students (38%) who have the highest income test free area, single parents receiving Parenting Payment (Single) (27%) who have the lowest taper rate (40%), followed by those receiving unemployment payments (Newstart Allowance at 21% and Youth Allowance Other at 20%). Overall, in June 2016, there were close to 450 000 people both working and receiving social security payments, which was equivalent to around 12% of all part-time workers in Australia. In addition to these people receiving income support and working part-time, there are also many low and middle income families with children simultaneously receiving family payments and working; in most cases, there is a full-time worker in these households.
2.3. Labour market and work arrangements in Australia
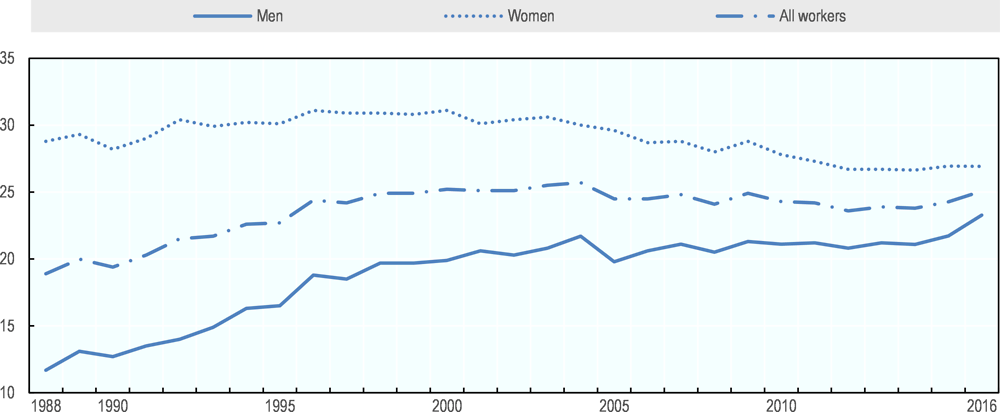
Since the 1970s, Australia – like other OECD countries - has experienced significant structural changes in its labour market, including an initial fall in male labour force participation rates particularly at older ages (which subsequently recovered) and an increase in prime-age female participation rates, mainly an increase in part-time and casual employment. There have also been major changes in the processes of youth entry to the labour market – where once young men took on full-time employment after finishing secondary education and young women had a relatively short period of employment before marrying and having children, now longer educational participation – both in terms of finishing high school and attending university or other forms of tertiary education – has become the norm for men and women. Age at first marriage and first childbirth for women has increased from around 20 years of age, to 30 years of age, or older. Age at first marriage for women has increased from around 21 in 1975 to 28 in 2013 and age at first childbirth from 24 to 31 between 1975 and 2014. Between the 1970s and the 1990s employment and labour force participation also fell significantly at older ages, although these declines were partly reversed between the 1990s and 2008.
At the same time as these changes in the labour market were under way, Australia also carried out significant reforms to its system of labour market regulation (and social security, as discussed above). These changes in labour market regulation therefore potentially have significant implications for social security policy. As a result, understanding how social security policies deal with an individual’s work status requires an understanding of the interaction between employment conditions and entitlements and social security entitlements.
This section sets out the main components of the Australian workplace relations system, and then discusses the main employment types and how they have quantitatively evolved in recent years. It also puts non-standard work in Australia in the OECD context.
2.3.1. Overview of the Australian workplace relations system 6
Although it was influenced by the British common law legal system, Australia nevertheless developed a very different industrial relations model where federal and state governments, employers and unions all played a role in regulating employment relations at a national and industry level (Owens et al., 2011). The past 30 years or so have witnessed radical changes, however, with the decentralisation and individualisation of what was “a relatively centralised framework of wages [and conditions] determination” (Wright and Lansbury, 2015, p. 9).
These changes have enabled workplace-level collective negotiation of pay and conditions (agreement is contained in enforceable enterprise agreements) whilst retaining industry/occupation specific legal minima (called modern awards) which enterprise agreements may diverge from if they leave employees better off overall. Modern awards set minimum wages as well as other working conditions such as overtime payments and additional leave conditions. Their overall contents are specified in the Fair Work Act 2009 (FWA), Australia’s principal employment rights statute, and each award is set and reviewed by an independent statutory body, the Fair Work Commission (FWC). Neither modern awards nor enterprise agreements may undercut the National Employment Standards, a minimum statutory safety net of minimum employment conditions contained in the Fair Work Act that applies to all national system employees (Stewart et al., 2016).
Compared with other English-speaking countries employment relations remain quite regulated, albeit less than in many European nations. The most significant employment protections which exist for employees are largely provided by the Fair Work Act, as described above. The self-employed are significantly less protected.
The most relevant employment standards relating to social security risks are ten days paid personal sick leave which may also be taken as carer’s leave. This accumulates each year, as long as a permanent employee remains working for the same employer. This means that long-term workers could be entitled to long-duration, fully paid sick leave at older ages when they may require this support.
In contrast, government-provided Sickness Allowances are payable to people aged 22 or older, but under age pension age, and who either have a job or are receiving Austudy Payment (an income support payment for students or Australian Apprentices aged 25 or older) or ABSTUDY living allowance as a full-time student. Apart from meeting the income and assets tests and residency rules, claimants must provide a valid medical certificate, and have work or study to return to when their health improves. However, in June 2016 only around 7 700 people received Sickness Allowance – or roughly 0.3% of all working-age social security recipients – primarily because permanent employees would generally be entitled to paid sick leave as a condition of employment, and recovery times for most episodically experienced illnesses and injuries affecting work attendance do not exhaust statutory sick leave entitlements.
In terms of costs of employment, full-time permanent employees are also entitled to 20 days (25 days for regular shift workers) paid annual leave plus around eight paid public holidays per year, with paid annual leave rights also accumulating whilst working with the same employer. A rough calculation is that paid annual holidays add 10.1% to normal salary costs, with paid public holidays adding a further 3.4%. If a worker took all of their personal sick and compassionate leave each year this would add a further 4.3%, so that the total potential cost of these leaves is equivalent to nearly 18% of the cost of days actually worked.
These paid leaves are unavailable to casual workers (some unpaid leaves are however), although casuals do receive a loading of between 15% and 25% on their pay, partly to compensate for this.
The most recent (2016) figures (Department of Employment, 2017) indicate that a total of 60.5% of those working had their pay set by awards (24%) or collective agreements (36.5%), with a growing proportion covered by awards which only set minimum pay and conditions (see above). Workers were in individual agreements in 37.3% of cases and 3.6% were owner managers of incorporated enterprises (OMIEs).
Whether a worker is an employee or an independent contractor significantly affects the worker’s employment rights but does not directly affect their social security entitlements. Employment entitlements broadly defined, however, may impact on how well a worker is protected against social risks such as time off work due to accidents, ill health and caring, and income in old age. Thus, where a worker’s status impacts on employment entitlements it may also indirectly support or undermine the functions of the public social security system.
Deciding in a contested case which status a worker has can be complex and depends on many different aspects of the worker/employer relationship (for example, control of how work is done, a worker’s freedom to substitute another to do the work). These have been discussed extensively by labour lawyers (Stewart et al., 2016; Owens et al., 2011). Independent contractors should operate genuinely independent businesses providing “services in freely negotiated commercial contracts” whilst employees on the other hand are “subordinate” to their employers (Owens et al., 2011, p. 153).
Differences in interpretation may depend on whether a court views its role as being to determine the extent to which a worker is genuinely a risk-taking entrepreneur in reality, or whether it places greater emphasis on the formal arrangements between the employer and the worker (Stewart et al., 2016). The FWA prohibits employers from misclassifying workers as independent contractors.
Precariousness of employment has been much discussed in Australia in recent years (for example Campbell and Price (2016), ACTU (2012)). Casual employment, fixed-term contracts (discussed in Section 2.4.1), employment agency work (known as labour hire) and employees misclassified as independent contractors contribute to insecure employment.
No precise data exist in Australia on the impact of work obtained through online platforms. Minifie (2016) comments that “it seems likely that fewer than 0.5% of adult Australians [80 000 people] work on peer-to-peer platforms more than once a month” (p. 33). Stewart and Stanford (2017) cite Minifie and also Deloitte Access Economics’ (2017) higher estimate of 1.5% over 2015-16 in the state of New South Wales, and conclude that gig work has made little impact in Australia so far. The authors also analyse the legal uncertainty gig workers face as to their employment status.
In August 2016, there were just over 11.8 million employed people in the Australian labour force and around 720 000 unemployed people (ABS 2017a). Of the 11.8 million employed people, 9.8 million (83%) were employees, with this group comprising 7.35 million employees with paid leave entitlements and 2.46 million (25% of employees) without paid sick leave i.e. “casual workers” (Figure 2.3) (ABS, 2017a). Around 46% of the employed workforce are women. Just under a third of all workers work part time, of whom nearly 70% are women. This means that 47% of all female workers are part time, compared with 19% of men (ABS, 2017b). There is considerable underemployment in Australia. In May 2017, it stood at 9.1% (7.1% of men and 11.3% of women), which is the highest level among OECD countries (ABS, 2017c).
Second job holding affects a relatively small proportion of workers – around 7-8% (Wilkins, 2017). Among these, a growing group comprises those working part time in their main job and using multiple jobs as a means to getting enough hours of work. This group has grown in size over the last decade, rising from approximately 54% of multiple job holders in 2008 to approximately 62% in 2015. In 2014 and 2015, approximately one in four multiple-job holders were part-time in each of their jobs, but full-time in all jobs combined. This was up from approximately one in six multiple job holders in the mid-2000s (Wilkins, 2017).
In August 2016, there were just over 800 000 owner managers of incorporated enterprises (of whom 59% had employees) and 1.2 million owner managers of unincorporated enterprises (of whom 80% were without employees).7

Source: ABS (2017a).
Independent contractors
The Australian Bureau of Statistics (ABS) (2017a) also classifies some employed people as independent contractors, which is a classification which may overlap with several categories in Figure 2.3 (employees, OMIEs and OMUEs). Independent contractors are sometimes referred to as consultants or freelancers. The term “contractors” is a broad term that is often used to describe people with a variety of forms of employment, for example, not only true independent contractors, but also employees engaged in short-term or fixed-term work, sometimes engaged through a third party (e.g. a labour hire firm/employment agency). The ABS (2017b) defines independent contractors as those who operate their own business providing services and who are not classed as employees. They have clients (possibly through an intermediary) rather than an employer and spend their time directly on client work rather than managing any employees they may have. Though in theory independent contractors should be negotiating on equal terms with their clients, in practice this is often far from the case.
Workers saying they were independent contractors may possibly in some cases be misclassified, as 42% said they could not subcontract their work and nearly two-thirds appeared not to control how their work was executed (ABS, 2017a). Concerns have been expressed about misclassification of employees as independent contractors (Productivity Commission, 2015).
There were just over 1 million people who were independent contractors in August 2016 (about 9% of all workers). Almost three-quarters (72%) of all independent contractors were men, and more than half (55%) were aged 45 years and over. Nearly one-third of all independent contractors worked in the construction industry, and a further 16% in technical services. Male independent contractors were most likely to work in construction (40%) and in technical services (14%), while female independent contractors clustered in professional, scientific and technical services (21%) as well as health care and social assistance (20%) (ABS, 2017a).
Casual employees
Casual employees are employed on a temporary “as needed” basis (though in practice many have fairly stable employment with one employer) and are not formally defined in the Fair Work Act. In awards, they are usually defined as “anyone who is engaged as a casual, or engaged and paid as such”. A recent decision in the Federal Court (WorkPac Pty Ltd v Skene (2018) has provided further clarification of this.
The FWA does, however, define the employment rights to which casuals are and are not entitled. Casuals are not entitled to paid holiday and sick leave, redundancy pay and notice of termination (Stewart et al., 2016). The FWA does grant some rights to casuals, though some are restricted to those with regular and systematic employment for a qualifying period with an employer and who have an expectation of such employment continuing. An employer of a casual worker must (subject to certain exceptions) make the statutory superannuation contributions on their behalf (see below). Casual workers are also covered by workers’ compensation arrangements.
A casual worker under an award should be paid 25% more for each hour than another worker doing the same job on a permanent basis. In enterprise agreements, the casual loading varies by sector, but tends to be between 15% and 25% (Healy and Nicholson, 2017). A recent study by Healy and Nicholson (2017) points out that “the practice of paying a casual loading developed for two reasons. One was to provide some compensation for workers missing out on paid leave. The other, quite different, motivation was to make casual employment more expensive and discourage excessive use of it.”
There are two main areas of costs savings to employers in hiring casuals. The first is their lack of entitlement to paid leave. Despite the casual loading that is intended to compensate for less favourable conditions, a range of research has found that there are still detriments to employees – and thus benefits to employers. Lass and Wooden (2017) use the HILDA longitudinal household survey to examine the existence of wage penalties or premia for temporary workers including casuals. They summarise prior Australian research as finding “that casual employment is associated with, at most, a very modest wage premium” (pp 1-2). For example, Watson (2005) analysing an earlier version of the same survey as Lass and Wooden, found small premia for casual workers (significantly less than the nominal loading for casuals). After controlling for the loading, casual workers were actually experiencing a wage penalty.
Unlike this earlier research which “focused on the mean of the wage distribution”, Lass and Wooden (2017 p2) the authors examine the penalty/premia throughout the wage distribution. Casuals in HILDA (as in ABS data8) appear disproportionately in the lowest-paid jobs. They conclude a wage penalty does indeed exist for those in the lowest-paid casual jobs, moving towards a premium at higher pay levels. Yet even at higher pay levels, the premia (except in a few cases) do not fully reach the level of the loading (p.16).
More difficult to calculate is the benefit to employers of the flexible way casuals’ low level of job protection enables their labour to be called on to meet employers’ fluctuating staffing requirements. This stems from a lack of realistic protection from unfair dismissal and their lack of notice rights or redundancy payments, together with the ease with which employers can adjust their hours at short notice (Campbell, 2017; Productivity Commission, 2015, Vol. 2, p. 801). The Productivity Commission (2015) notes the variability of hours, the possibility of dismissal and fewer prospects of workplace training “are far more difficult to quantify [than loss of specific payments]”.
The share of casual workers increased in the late 1980s and 1990s(Figure 2.4). Over the period since 1988, female workers have been much more likely to be casual than men, with the share of female employees employed casually being over 30% for much of the period. After 2000, however, this proportion dropped from a high of 31%. More recently, the proportion of casual employees increased from 23.5% in August 2012 to 25.1% in August 2017, with the proportion of casual male employees increasing from 21.0% to 23.1% and the proportion of casual female employees increasing from 26.2% to 27.1%. The overall growth in casual employment has been driven by its growing prevalence among men, with the proportion nearly doubling from 11.7% in 1988 to 22.7% in 2004, but it has been roughly stable since then. Analysis by Campbell (forthcoming, using ABS data) suggests that the variability of casuals’ hours and income has increased between 2012 and 2017. Casuals are much more likely to work short hours than permanent staff. Of all casuals, 19.3% worked less than ten hours per week in 2016 (ABS, 2017a). Casual employment is predominately part time (70% of casual employees) and the majority (52.6%) of it is undertaken by women (of whom 81.1% are part-time) with a large proportion of it carried out by young people (37.3% by those under 25).
Source: Australian Bureau of Statistics (ABS), Australian labour market statistics, Cat. No. 6105.0, ABS, Canberra, July 2014.
As with independent contractors, it appears that considerable avoidance of legal minima applicable to casuals may be occurring. Lass and Wooden (2017), whilst acknowledging that permanent staff are often paid more than the minima applicable to their job, comment that their findings “suggest…a considerable degree of non-compliance on the part of employers of low-wage casual labour” (p. 16). In July 2017, the FWC decided that a clause enabling casuals to ask to become permanent employees (subject to fulfilling certain conditions) would be inserted into awards (industry-specific legal minima for wages and working conditions, see Section 2.3.1). How far this will reduce misclassification of permanent employees as casuals is debatable, but it is an indication of concerns about the undermining of employment rights.
It is unclear how extensive compliance is with labour laws (Landau et al., 2014). The Fair Work Ombudsman (FWO), Australia’s labour inspectorate and employment conditions enforcement agency pursues numerous claims of underpayment of wages to largely low-paid workers9, amongst whom will be casuals and “sham” contractors. Concerns are regularly expressed in the media about underpayment of wages, with franchisees a particular concern.10 Following concerns expressed by the Productivity Commission (2015), legislation recently strengthened protections for vulnerable workers.
Australia’s international ranking in terms of the share of temporary employees is unclear. The definition used in the OECD Labour Force Statistics is that in 2017 only 5.3% of dependent employment was temporary, giving Australia the fourth lowest share of temporary workers in the OECD (Figure 1.1 in Chapter 1).
The definition used is derived from the Australian Labour Force Survey with temporary workers defined as those employees (excluding owner-managers of incorporated enterprises) where the employment in a person’s ‘main job’ (to which are attached a number of measurement issues) has a set completion date or event (fixed-term contract), or casuals (those without leave entitlements) where employment is expected to continue for less than 12 months with “seasonal/temporary job/fixed contract” reported as the reason.
In contrast, much of the Australian literature treats most casual workers as temporary employees. For example, Campbell and Burgess (2001) estimate that in the late 1990s around one in three employees in Australia were temporary workers. More recently, Lass and Wooden (2017, page 1) note that in Australia “the share of temporary in total employment is very high, and … it is casual work, and not fixed-term contracts that is the most prevalent form of temporary employment. Data from the Household, Income and Labour Dynamics in Australia (HILDA) Survey, for example, indicate that around 32% of Australian employees were employed on either a casual basis or a fixed-term contract in 2014, but with casual workers representing the majority of this group (72%)”.
Using a somewhat similar approach with HILDA data, OECD (2015) estimate that in 2013 Australia had the third-highest share of non-standard employment in the OECD with close to 40% of total employment being “non-standard”, but this included part-time permanent employees and the self-employed.
Temporary migrant workers
Among OECD countries, Australia has the third highest share of foreign-born people in its population – 27.7% in 2013 (OECD, 2017). Traditionally, Australia has been a country of permanent settlement and for most of the period after the Second World War, there was no category analogous to guest workers.
The test of ‘community membership’ which must be satisfied to be qualified for most Australian social security payments is Australian residence status. For working-age payments such as Newstart Allowance, migrants not covered by an ‘assurance of support’ must wait two years to become payable, and for Age and Disability Support Pensions they must accrue ten years of ‘qualifying residence’, except in the case of disabilities acquired after settling in Australia. Temporary migrants, however, are not regarded as ‘community members’ for Australian social security purposes (unless they can establish eligibility under one of Australia’s agreements on social security with other countries).
This pattern of migration has changed significantly since the late 1990s towards greater economic and temporary migration. More than 600 000 temporary migrants with rights to work entered Australia in 2014/15 alone (Wright et al., 2016). They include international students, skilled migrants on ‘457’ visas11 and working holidaymakers.
At 31 December 2015, there were 328 000 student visa holders in Australia, 155 000 Working Holiday Maker visa holders, 160 000 Temporary Skilled (‘457’) visa holders, and more than 600 000 New Zealand visa holders (Department of Home Affairs, 2015).
Qualitative research and reports indicate employer evasion of employment standards in relation to migrants with temporary work rights, which has caused concern in Australia. The Productivity Commission (2015) in its review of the evidence concludes that migrant workers are more vulnerable to exploitation and less able to enforce their employment rights than permanent residents. Many of those affected work in casualised industries such as retail or hospitality (Wright et al., 2016; Campbell et al., 2016).
In general, temporary migrant workers will have no rights to social security benefits due to the residence requirements for payments, and in many cases will have limited entitlements to health care, unless they come from a country with which Australia has a reciprocal healthcare agreement. Temporary migrant workers have the same rights at work as permanent residents and will be covered by workers’ compensation schemes; they will also be entitled to superannuation if they are earning over AUD 450 per month. Temporary workers following their departure from Australia can claim their accumulated superannuation contributions and earnings, but these are taxed at rates of between 35% and 65%.
New Zealanders are entitled to travel freely to Australia without visas. However, since 1994, when a Special Category Visa (SCV) was introduced for New Zealanders, they have no longer been treated as de facto permanent residents irrespective of their length of residency. If they wish to apply for permanent residency they must do so under skilled migration requirements, which will generally exclude those aged 45 years and over and those with limited educational qualifications. After 2001, the rights to social security of these visa holders were also significantly restricted. A new permanent residency pathway was introduced from 1 July 2017 for New Zealand citizens who arrived in Australia post 26 February 2001, but on or before, 19 February 2016.
Overall, changes in migration policies and related social security policies have meant that there has been a significant increase in the share of the immigrant population with limited access to Australian social security payments.
Labour hire, fixed-term employees and unpaid work experience
Approximately 600 800 people (about 5% of all employed persons) were placed in their job by a labour hire firm/employment agency in August 2016, of whom 133 700 were employed by the labour hire firm. Those who work for a labour hire company are usually employees of that company not of their host business who gives them work but pays the labour hire company. They are often casuals whilst some may be independent contractors to their labour hire employer (Stewart et al., 2016; Victorian Government, 2016). The latter arrangements are subject to the tests described above if the worker contests their status and alleges that they are an employee. The Labour Hire Inquiry Report (Victorian Government, 2016) found greater economic vulnerability existed for labour hire company employees than other types of employees in many areas.
Men comprised 59% of the overall total and 64% of labour hire direct workers. Overall, the manufacturing (21%) and construction (10%) industries were where many men were hired. Women using this method to find jobs were placed primarily in the healthcare and social assistance (16%) and the public administration and safety (11%) industries (ABS, 2017a). Over half of those finding work through a labour hire firm or employment agency were aged between 25 and 44 (ABS, 2017a).
Fixed-term employees are employed for a specified length of time or until a job is completed. They comprise between 3% and 9% of employees (Stewart et al., 2016). Their rights to employer-provided conditions impacting on social security risks are similar to permanent workers. Unpaid work experience (often known as internships) is reported to be common in Australia, especially for young adults. This experience “occup[ies] an ambiguous space in employment and workplace law” (Oliver et al., 2017, p. 18) as some may be entitled to an employee’s pay and conditions. Some paid interns may also be entitled to student payments.
2.4. Access to social protection
In many instances, differences in employment status between employees and the self-employed and between casual and permanent employees do not impact on their rights to social security. Indeed, because casual employees receive no coverage for sick leave as a condition of employment and can be more easily dismissed, they are conceivably more likely to claim some entitlements than regular employees. While there is no direct information on whether social security recipients who are also working are casual workers or not, it seems likely that many would be. As discussed earlier (Figure 2.2), a total of around 11% of social security recipients receive earnings, including around 20% of Newstart Allowance recipients and a similar proportion of Youth Allowance (Other) recipients. This suggests that for casual workers there are no inherent barriers to combining social security payments with part-time employment.
This section discusses what differences could nevertheless emerge between standard and non-standard workers in Australia: how the income and asset tests treat different sources of income and wealth; Paid Parental Leave as the only programme that has a work history requirement (with this used to determine eligibility as opposed to level of assistance received which is ‘flat rate’); and superannuation and occupational pension plans and coverage of work accidents.
2.4.1. How the social security system treats different sources of income and wealth
Employment income includes
-
salary
-
wages
-
commissions
-
allowances in excess of relevant expenses
-
pay for piece work
-
fixed and variable price contracts
-
fringe benefits related to employment
-
remuneration from own private trusts, but not distributions
-
remuneration from own company, but not dividends
-
regular drawings of income for work performed such as directors’ fees
Employment income does not include
-
drawings by a principal from a sole trader business or partnership
-
superannuation pensions
-
personal injury compensation
-
insurance payouts related to employment
-
leave payments received as a lump sum on termination of employment
Source: Australian Department of Human Services, https://www.humanservices.gov.au/customer/enablers/examples-employment-income.
As discussed in Section 2.2, most benefits in Australia are subject to income and asset tests. In the income tests, deductions for self-employment expenses are more restricted than those allowed for income tax purposes.12 In the income test, the self-employed can deduct costs needed to earn business income, depreciation of business assets and employer superannuation contributions for their employees. They cannot claim, however, past year losses, losses from another business, superannuation for themselves or business partners, and some capital costs, which can be claimed in their tax returns.
The self-employed and others obtaining ‘business income’ (i.e. income from profits generated by the carrying on of a business) are required to provide Centrelink, the agency tasked with the delivery of social security payments by the Department for Human Services (DHS), with their most recent taxation notice of assessment, or a profit and loss statement for a recent period (usually 13 weeks) – if a taxation notice of assessment for the most recently concluded financial year is has not yet available, or income has changed since the last statement (Australian Government, Department of Human Services, 2017).
However, the difference in employment status is significant in relation to the accumulation of savings for retirement through the superannuation system and in relation to ill-health payments particularly where ill health arises from a work-related cause. Before turning to these issues, the paper will discuss the one payment made by the national government that does require a recent employment history for eligibility and two work-related payments which provide social protection apart from paid sick leave mentioned earlier.
2.4.2. Paid Parental Leave and Dad and Partner Pay
Australia’s first national scheme of Paid Parental Leave (PPL) was introduced in January 2011 and paid leave was extended to fathers as Dad and Partner Pay (DaPP) in January 2013. These payments differ from most other social security payments in that while they do not require contributions, eligibility is conditional on previous periods of employment. Currently, Parental Leave Pay in Australia is payable for up to 18 weeks at the minimum wage.
There is a work test for eligibility (as well as a range of other tests such as residency requirements). This requires a PPL recipient to have worked for 10 of the 13 months prior to a birth (or adoption) for a total of at least 330 hours; (which averages out to just over one day per week in that period). There are two important exclusions that may particularly affect casual workers, who cannot be sure of ongoing work and who are not usually entitled to paid leave. These are: (1) there must not be a period greater than eight weeks between any two days of qualifying work; (2) paid leave (e.g. due to ill health or holidays) counts as work whilst unpaid leave does not.
The work test however is wide and can encompass casuals even where they have worked for several employers (and this is true of anyone otherwise satisfying the work test e.g. seasonal workers) and also includes independent contractors and the self-employed. Dad and Partner Pay has very similar eligibility rules.
There is also a cap on earnings. This means that individuals with an adjusted taxable income above AUD 150 000 a year (or about 2.7 times the median wage in July 2017) from employment or business income or from a wide range of taxable government pensions and benefits, receive no PPL. There is no taper, but entitlement is lost as soon as one earns above this threshold.
In addition, because these payments are made at a flat rate and at the full-time minimum wage, they are more advantageous (in terms of their replacement rate) to low-income and part-time workers earning below the full-time minimum wage than to higher-paid, full-time workers. The official evaluation of these schemes (Martin et al., 2014) shows stronger effects for low-paid, casual and self-employed workers than for full-time workers on permanent contracts. This was based on comparing outcomes for different categories of workers after the scheme was introduced, compared to a sample of workers before the scheme was introduced. The main result of interest was whether parents spent more time with their infants before returning to work. For mothers, the evaluation estimated that for low-income workers, the proportion surveyed who had not returned to work by 13 weeks increased from 80% to 90%, for casual workers from 79% to 90% (compared to 85% to 92% for those not on casual contracts), and for previously self-employed mothers from 43% to 66% (compared to 86% to 94% for those not self-employed). Prior to DaPP, 13% of all fathers in an online survey reported they had not been eligible for any type of leave, but this ranged from 3% of those with permanent contracts, to 41-54% of the self-employed and 65% of fathers in casual employment. After the introduction of DaPP, 36% of all surveyed fathers used the provision in the first six months after the birth of their baby, but roughly half of casual and self-employed fathers (Martin et al., 2014).
In summary, while PLP/DaPP are the only government social security provisions in Australia to explicitly require previous employment as a condition of eligibility, it appears that it was designed in a way – a flat-rate payment replacing full-time minimum wages – that had a greater impact on outcomes for irregular workers than to those with a permanent contract.
2.4.3. Superannuation
The Superannuation Guarantee Act 1992 (SG Act) requires employers to pay a proportion of ordinary time earnings (which includes the loading for casuals) into a superannuation fund. This is a defined-contribution scheme and there is no requirement that it be converted into an annuity on retirement. This contribution is now 9.5% of wages (up to a cap of AUD 51 620 per quarter in 2016-17), and is legislated to rise to 12% beginning in 2021-22. Individual contracts, enterprise agreements and modern awards may make provision for higher contributions, or ‘defined benefit’ superannuation (so long as the employer contribution is at least 9.5%).
Superannuation covers employees and contractors with a contract “wholly or principally” for their labour, effectively employees.13 There are exemptions for those who earn under AUD 450 per calendar month in a particular job, those doing private or domestic work up to 30 hours per week, and part-time workers under 18. The AUD 450 threshold (which is not uprated for wage or consumer price inflation) is equivalent to around six hours per week at current minimum wage rates. This has implications for those working in multiple small part-time jobs as they potentially will not be covered even if their total hours of work put them over this level.14 In 2013/14, 66% of women and 73% of men over the age of 15 were having superannuation paid into a fund on their behalf.
Individuals may contribute to their own superannuation fund before tax (subject to financial year limits) at a 15% tax rate, whilst contributions from after tax income sources are not subject to a contributions tax (Australian Tax Office, 2017b). The higher an individual’s marginal tax rate the more advantageous it is to do this – the top marginal tax rate is 45%. The self-employed are generally regarded as being less likely to make these contributions – despite the tax advantages (including tax deductibility of ‘notified’ personal super contributions) – because they are more likely to retain earnings as cash in their businesses (which boosts the eventual sale price of the business, with income from the sale of the business treated as a ‘capital gain’ which is taxed at half the taxpayer’s top marginal income tax rate). However, recent changes introduced in the 2016-17 Budget have made it easier to make such contributions. There is also a Low-Income Superannuation Tax Offset under which the government pays up to AUD 500 a year into a superannuation account on a ‘low-income’ earner’s behalf (Australian Tax Office, 2017d).
The SG Act requires employers to pay superannuation quarterly into the superannuation funds of their eligible workers. An employer who fails to do this faces financial penalties on top of repaying the superannuation guarantee amount. The penalty is 10% of the shortfall (the nominal interest component) and AUD 20 per employee affected per quarter (the administration fee). The Tax Office also has discretion to levy an additional penalty of up to 200% of the outstanding amount, including shortfall, interest component and administration fee. Company directors are also personally liable for the whole amount owing to each employee.
Despite these penalties for non-compliance, approximately 20 000 employees and ex-employees (largely of small businesses) report a suspected underpayment or non-payment to the Australian Tax Office annually (ATO, 2017c). An employee often cannot claim their unpaid superannuation directly from their (ex) employer and their fund cannot do it on their behalf as it is for the ATO to initiate compliance (Stewart et al., 2016).
Conflicting estimates of the superannuation compliance gap have been made recently. A report from a Senate committee (Senate of Australia 2017) states that Industry Super Australia (ISA), an organisation managing research, policy development and advocacy projects for industry superannuation funds (which jointly manage about 5 million accounts), estimated that “Australian employers failed to pay at least AUD 3.6 billion in SG contributions in 2013/14” (revised now to AUD 5.6 billion in 2013-14) (pp. 13-14). This is roughly equivalent to 10% of total employer superannuation contributions for the 2013/14 financial year. A more modest sum has been subsequently estimated by the ATO of AUD 2.85 billion (5.5% of the amount of AUD 51.51 billion collected) in 2014/15 (ATO, 2017c). This is net of AUD 414 million which it reports as recovered by ATO compliance activities in that year (ATO, 2017c).
Two main causes were identified: underpayment of SG for employees and those contractors who are in effect disguised employees, and contributions not being paid in the cash economy. Projected accumulated losses over the next ten years were estimated as having an effect on a large number of individuals. The ATO and the Senate of Australia (2017) note that employees of small businesses and in the hospitality, construction, manufacturing and retail industries (noted by the Senate report to be areas of insecure and low-waged jobs) suffer from non-payment disproportionately. The Government has recently introduced a suite of targeted reforms to introduce stronger penalties for non-compliance, ensure more reliable collection of liabilities and improve the visibility of superannuation payments to the ATO.
There are significant concerns about the adequacy of superannuation particularly for women with interrupted work histories due to caring responsibilities. Women on PPL payments and those receiving social security benefits while caring are not eligible for superannuation contributions. Interruptions to work will thus reduce the total amount of superannuation in retirement. Data compiled by the Workplace Gender Equality Agency show the superannuation gap is 46.6% on average. This means the average Australian man currently retires with AUD 197 054 while the average woman retires with just AUD 104 734 (Commonwealth of Australia, 2016).
There are also concerns about the generosity of tax expenditures for superannuation. Unlike most other countries, superannuation in Australia has operated on a “ttE” basis15; in broad terms, this means that contributions into superannuation are taxed at a flat rate of 15% and earnings within superannuation funds are also taxed at a flat rate of 15%, rather than at the marginal rate of the individual.
Because existing taxes on contributions and earnings are at a flat rate, they are more valuable for higher-income earners, who would otherwise pay higher marginal rates on these incomes. It is estimated that close to a third of the value of the tax concessions in Australia accrue to the top 10% of taxpayers (Ingles and Stewart, 2015), however changes introduced in the 2016-17 Budget will address this equity issue going forward.
2.4.4. Accidents at work
The principal method of compensating workers for workplace-related injuries and illness is through the (eleven different) workers’ compensation schemes provided in states and territories for most workers, and by the federal government for its own and a limited number of other employees (Stewart et al., 2016). The workers’ compensation schemes16 require most employers to insure against occurrences of workplace related injuries by paying a standardised average premium rate. The rate applied to the employer varies by industry classification. In 2015-1617 the rates applied ranged from 0.26% to 3.43% of payroll.
Rules about the amount and nature of earnings compensated vary as do the periods of incapacity covered and the lump sums for permanent incapacity and death. For example, in New South Wales – the most populous Australian state – injured workers receive up to 95% of their pre-injury average weekly earnings up to a ceiling of roughly twice median earnings for up to 13 weeks. Between 14 and 130 weeks they can receive up to 80% of their pre-injury earnings up to the same ceiling, and after this they can still receive 80% of previous earnings if they are assessed as unable to work. Those who are able to return to work on a program of reduced hours are eligible for the same levels of support, less their actual earnings. Special provisions are made where employees are uninsured. However, many jurisdictions do not require insurance to include any or all superannuation contributions, so during the period of an injury, workers may not have contributions to their superannuation savings maintained.
According to data in the OECD Social Expenditure Database for Australia, in 2014 payments made by workers’ compensation schemes amounted to AUD 8.5 billion or roughly 50% of the government’s level of spending on the public Disability Support Pension (costing AUD 16.5 billion in that year).18
Independent contractors are not always covered by workplace accident schemes. The summary of coverage compiled by Safe Work Australia (2016) suggests variation across jurisdictions in the coverage of independent contractors, with many not covered at all, though labour hire workers must usually be covered by their labour hire employers (i.e. not the employer with whom they are placed). In general terms, the federal government guidance advises independent contractors: “You may not necessarily be entitled to workers’ compensation unless you have arranged your own accident protection insurance. Some independent contractors are covered for workers’ compensation in some states and in specific circumstances” (Department of Innovation, Industry and Science, 2016, p.18).
Claims for workers’ compensation and/or civil damages actions may take some time to be settled, and individuals may claim an income support payment while waiting for settlement. In these cases the social security system makes provision to recover a proportion of income support (i) already paid from a lump sum or (ii) otherwise payable from ongoing instalments of compensation if a workers’ compensation claim and/or civil damages action succeeds (Stewart et al., 2016).
2.5. The incomes and assets of the self-employed
The share of households whose principal source of income is from self-employment (unincorporated business income) was 4.1% in 2013/14. There are a further 0.5% of households with zero or negative income – most of whom are likely to be self-employed (ABS, 2015). Households with an incorporated business providing their main income source are largely found among a group that the ABS classifies as “other”, who in total make up about 10% of households. However, the “other” group also includes people with property and investment income, and it is not possible to definitively say what share are only reliant on incorporated business income.
Figure 2.5 shows the distribution of income by main source of gross household income, comparing the self-employed, employees and all households. The self-employed have mean equivalised disposable incomes that are around 94% of those with employee income. Their relative median income is much lower at a little over 80%, reflecting the much higher inequality among self-employed households – the Gini coefficient for employee households is 0.269 while that for the self-employed is 0.389. This in turn reflects the fact that incomes at the 10th percentile of the respective distributions are much lower for the self-employed (by more than 25%) while incomes at the 90th percentile are about 9% higher.

Source: ABS, 2015.
Figure 2.5 shows, however, that self-employed households have considerably higher net worth than employee households, with mean net worth being 60% higher and median net worth 44% higher – again implying higher inequality in the distribution of wealth among the self-employed. The main explanation for their higher net worth is that the average value of their own unincorporated business exceeds AUD 250 000. In addition, however the value of their non-financial assets is considerably higher than that of employees, including the value of their family home and other property. Their superannuation wealth, however, is lower than that of employee households and considerably lower than that of the “other” group. They also have the highest level of liabilities, mainly due to higher property debts.
The self-employed have slightly more one-earner households and they are more likely to be home owners, both with and without a mortgage, relative to employee households. They are also more likely to be couples with and without dependent children, and their average age is somewhat higher.
Figure 2.6 shows receipt of government benefits by source of income. While the self-employed receive the lowest level of cash benefits on average of any of the household groups, it is notable that the average value of family support benefits received (Family Tax Benefits A and B) is about the same as for employee households. In absolute terms, they have the highest level of benefits received from education programmes, but the lowest from health benefits. Again, in absolute terms they pay the highest average income taxes, about 20% or AUD 100 a week more than employee households even though their gross income is lower than employee households. This may reflect the fact that the self-employed have more unequal incomes than employees, with higher incomes at the top of the distribution range.
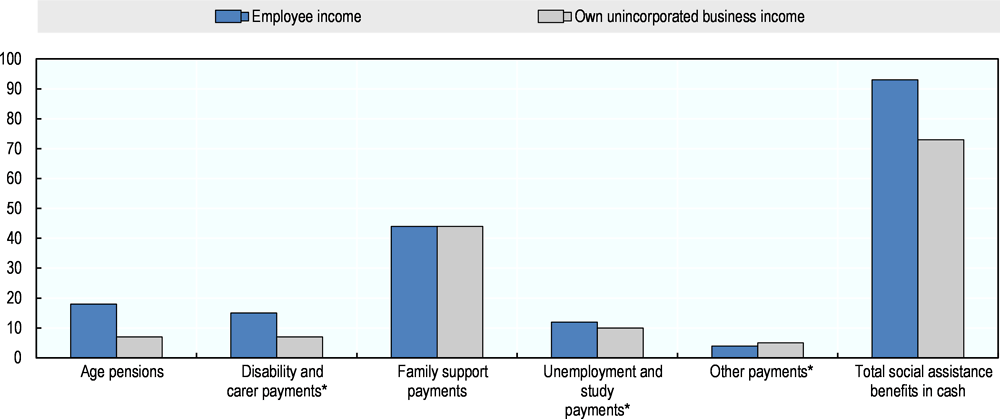
Note: For categories marked with *, the estimate for households with own unincorporated business income have a relative standard error of 25% to 50% and should be used with caution
Source: ABS, 2015.
2.6. Discussion and conclusions
The Australian system of public social security differs significantly from those in most other OECD countries (apart from New Zealand), in not being based on social insurance principles and therefore not requiring previous contributions as a condition of eligibility. Over the last 50 years or so, the Australian social security system has also evolved from a tightly targeted scheme of social assistance designed around the assumption that work is full-time, to a system that recognises that part-time work and other non-standard arrangements exist and may be either a stepping stone to full-time work or sufficient in and of itself sufficient to meet participation requirements. The system is now something more like a set of categorical negative income taxes that encourage part-time work, but which place higher effective marginal tax rates on those who move from part-time to full-time work (OECD Benefits and Wages database).
The Australian story is complicated, however, by its interaction with a system of workplace entitlements that privilege full-time permanent employees. As discussed in Section 2.2, as well as having less access to generous entitlements to paid leave, temporary workers are much more vulnerable to dismissal with little or no notice, their work shifts can be changed at short notice, and they have less control over their patterns and hours of work. The scope and enforcement of this system of workplace-based entitlements that are not directly provided by the government would appear to have diminished over time, due to declining unionisation and growing casual and part-time work. Additionally, independent contractors are outside these workplace protections though a number should in fact be classified as employees, or depend significantly on one or two employers even where they are genuinely independent.
Australia has relatively low levels of self-employment compared with other countries in the OECD (OECD, 2015a). There are other forms of non-standard employment including independent contractors as well as the emerging “gig economy” but data on these trends are less definitive. The last 20 years has also seen a very large increase in temporary migrant workers, who because of residence requirements for social benefits and health services will not be eligible for most forms of government social protection, and are also at higher risk of exploitation at work.
For many categories of non-standard workers, the design features of the Australian system do not exclude them from social protection. Non-standard workers are entitled to the same government benefits as standard workers, and in some cases, may be more likely to be eligible, because they are on lower incomes, work part-time and do not have entitlements to paid sick leave. A significant proportion of social security recipients and of part-time workers are already combining work and welfare. Overall, the non-contributory nature of the Australian system appears to achieve broad coverage and high take-up. Offsetting this is the fact that for working-age recipients, payment levels are modest compared to the levels of assistance provided in insurance-based schemes (this is to be expected from ‘safety net’ social assistance transfers, which are directed towards ‘poverty alleviation’ rather than wage replacement).
Analysis of the economic circumstances of the self-employed in unincorporated businesses finds that they have lower average and median incomes than employees, but with a more unequal distribution of income. This means that lower-income self-employed people are worse off than comparable groups of employees, but the higher-income self-employed are better off. The self-employed generally have significantly higher levels of wealth than employee households, although less of this is in superannuation. It is not possible to say, however, whether the self-employed – who are not covered by compulsory superannuation – are disadvantaged by this, as income data do not identify the previous work status of those currently retired.
Having said this, non-standard workers appear to be, and likely to continue to be, disadvantaged in relation to occupational superannuation, which has become much more significant since the 1990s, a trend that is expected to continue over the next two decades. This may have a stronger negative impact on part-time workers and women than the self-employed, who, while they are less likely to contribute to superannuation, have other forms of savings through their own business and the family home and other real property.
Of particular interest are the Parental Leave Payment arrangements, which advantage workers with incomes below the full-time minimum wage and encompass the self-employed. These have a broad coverage with eligibility based on prior employment and are funded by government and not employers. Overall, while the Australian government social security system does not exclude non-standard workers, many of the features of the systems of work-based support are exposed to the same sorts of challenges from the changing nature of work.
In considering the lessons of Australia’s experience, it should be noted that income-testing potentially raises complications that are not necessarily as salient in non-targeted systems. An income-tested benefit is inherently vulnerable to problems of overpayments and underpayments. To some degree, there may be similar issues with receipt of social insurance benefits where overpayments are possible if recipients do not accurately report their status, e.g. people receiving unemployment payments but who are doing undeclared work in the underground economy. But in a system like Australia’s, correct payments are regarded as more central to the objective of targeting benefits. Accurate targeting will necessarily become more problematic as patterns of work vary in terms of hours per week and weeks per year.
Getting payments “right” in any means-tested system is a complex process necessarily involving trade-offs between responsiveness and simplicity. If the aim is to precisely match income and benefits in real time, then there must be updating and checking of income and adjustments of benefits. But such a system is potentially intrusive and administratively complex.
There are specific examples of these problems arising in the early 2000s in relation to overpayments of family tax benefits in Australia as well as tax credits in the United Kingdom (Whiteford, Millar and Mendelson, 2003), as also more recently in Australia in relation to presumed overpayments of income support benefits (Whiteford and Millar, 2017).
The increasing trends towards more insecure and variable employment patterns – and hence irregular pay packets – will make balancing accuracy and timeliness in means-tested welfare benefits more difficult. This new reality requires both a policy solution and a technical response aimed at harnessing real-time information on earnings and income in a timely way. These complexities need to be borne in mind in assessing the lessons of Australia’s approach to social security.
References
Australian Bureau of Statistics (ABS) (2014), Standards for Labour Force Statistics, Issue For Dec 2014, Cat. No. 1288.0, ABS, Canberra, http://www.abs.gov.au/ausstats/[email protected]/Lookup/by%20Subject/1288.0~Issue%20For%20Dec%202014~Main%20Features~Underlying%20Concepts~20, Downloaded 18 December 2017.
ABS (2015), Household Income and Wealth, Australia, 2013–14, Cat. No. 6523.0, http://www.abs.gov.au/AUSSTATS/[email protected]/DetailsPage/6523.02013-14?OpenDocument
ABS (2016) Employee Earnings and Hours, Australia, May 2016, Cat No. 6306.0, http://www.abs.gov.au/AUSSTATS/[email protected]/Lookup/6306.0Main+Features1May%202016?OpenDocument, downloaded 24 July 2017.
ABS (2017a), Characteristics of Employment, Australia, August 2016, Cat. No. 6333.0, ABS, Canberra http://www.abs.gov.au/ausstats/[email protected]/Latestproducts/6333.0Main%20Features6August%202016?opendocument&tabname=Summary&prodno=6333.0&issue=August%202016&num=&view,downloaded 10 August, 2017.
ABS (2017b) Labour Force, Australia, Nov 2017, Cat. No. 6202.0 (Trend data), ABS, Canberra, http://www.abs.gov.au/AUSSTATS/[email protected]/allprimarymainfeatures/3D6FA35FFE7566BACA258162001958A8?opendocument, downloaded 18 Dec 2017.
ABS (2017c), Labour Force, Australia, Detailed, Quarterly, Aug 2017, ABS, Canberra, http://www.abs.gov.au/AUSSTATS/[email protected]/DetailsPage/6291.0.55.003Aug%202017?OpenDocument, downloaded 18 Dec 2017
Australian Insurance Brokers (2013) Workers’ Compensation Australia, http://www.aisinsurance.com.au/wp-content/uploads/2013/04/Summary-of-the-Australian-Workers-Compensation-System.pdf, downloaded 24 July 2017
Australian Government, Department of Human Services (2017), https://www.humanservices.gov.au/individuals/forms/su580.
Australian Super Funds Association (ASFA), ‘Superannuation Statistics’ August 2017, https://www.superannuation.asn.au/resources/superannuation-statistics
Australian Tax Office (2017a), Income and deductions for business, https://www.ato.gov.au/Business/Income-and-deductions-for-business/Assessable-income/
Australian Tax Office (2017, b) Tax on contributions, https://www.ato.gov.au/individuals/super/super-and-tax/tax-on-contributions/#Beforetaxsupercontributions, downloaded on 15 Dec 2017
Australian Tax Office (2017c), Super Guarantee Gap, https://www.ato.gov.au/About-ATO/Research-and-statistics/In-detail/Tax-gap/Superannuation-guarantee-gap/, downloaded 15 Dec 2017.
Australian Tax Office (2017d), New low income super tax offset, https://www.ato.gov.au/Individuals/Super/Super-changes/New-low-income-super-tax-offset-contribution/, downloaded 15 Dec 2017.
Campbell I (forthcoming), On-call and related forms of casual work in New Zealand and Australia, ILO Geneva.
Campbell, I., & Price, R. (2016). Precarious work and precarious workers: Towards an improved conceptualisation. The Economic and Labour Relations Review, 27(3), 314-332.
Campbell I, Tham J-C and Boese M (2016/7) ‘Inhospitable workplaces? International students and paid work in food services’, Australian Journal of Social Issues. 51: 279–298.
Castles F. G. (1986), The Working Class and Welfare: Reflections on the Political Development of the Welfare State in Australia and New Zealand, 1890-1980, Sydney, Allen and Unwin
Charlesworth, S. and A. Heron (2012), New Australian working time minimum standards: Reproducing the same old gendered architecture? Journal of Industrial Relations, 54, 2, pp 164-181.
Commonwealth of Australia (2016), 'A husband is not a retirement plan': Achieving economic security for women in retirement, Report of Senate Standing Committees on Economics, 29 April 2016, Canberra.
Davidson, P. et al. (2018), Poverty in Australia, 2018, ACOSS/UNSW Poverty and Inequality Partnership Report No. 2, ACOSS, Sydney.
Deloitte Access Economics (2017) Developments in the Collaborative Economy in NSW. NSW Department of Finance, Services & Innovation Sydney, NSW, Australia: Deloitte Touche Tohmatsu.
Deeming, C. (2013), “The Working Class and Welfare: Francis G. Castles on the Political Development of the Welfare State in Australia and New Zealand Thirty Years On”, Social Policy & Administration, 47, 6, pp. 668 – 691.
Department of the Treasury (2017), 2016 Tax Expenditures Statement, Canberra.
Department of Employment (2017) Trends in Enterprise Bargaining, June quarter, p 11, from Australian Bureau of Statistics Employee Earnings and Hours, Cat. No. 6306.0 (May 2010, May 2012, May 2014, May 2016), unpublished data – all employees.
Department of Human Services (2017), Definition of Income, https://www.humanservices.gov.au/individuals/enablers/income
Department of Home Affairs (2015) Temporary entrants in Australia (stock data) statistics, 31 December 2015, Canberra. https://www.homeaffairs.gov.au/about/reports-publications/research-statistics/statistics/live-in-australia/temporary-entrants-in-australia
Department of Home Affairs (2017), Abolition and replacement of the 457 visa – Government reforms to employer sponsored skilled migration visas, https://www.homeaffairs.gov.au/Trav/Work/457-abolition-replacement.
Department of Innovation, Industry and Science (2016) Independent Contractors: The essential Handbook, Commonwealth of Australia.
Department of Social Services (2016) Payment Demographic data, https://data.gov.au/dataset/dss-payment-demographic-data.
Edelman Betrand for Upwork, August 2015 https://www.slideshare.net/upwork/freelancing-in-australia-2015, downloaded 22 July 2017.
Fair Work Ombudsman (2017), Fair Work Ombudsman and Registered Organisations Commission Entity Annual Report 2016 - 2017 (PDF 2MB).
Ferguson, A. and S. Danckert (2015), “Revealed: How 7-Eleven is Ripping of its Workers”, Sydney Morning Herald, http://www.smh.com.au/interactive/2015/7-eleven-revealed/.
Healy J and Nicholson (2017), “The costs of a casual job are now outweighing any pay benefits”, The Conversation, September 4, https://theconversation.com/the-costs-of-a-casual-job-are-now-outweighing-any-pay-benefits-82207.
Hernananz, V., F. Malherbet and M. Pellizzari, (2004), Take-up of welfare benefits in OECD countries: a review of the evidence, Organisation for Economic Co-operation and Development, Paris, March 2004.
Howe B, Munro P, Biddington J and Charlesworth S (2012) Lives on Hold: Unlocking the Potential of Australia’s Workforce. The Report of the Independent Inquiry into Insecure Work in Australia. Melbourne: Studio Alto.
Ingles D and Stewart M (2015), Superannuation tax concessions and the age pension: a principled approach to savings taxation, Tax and Transfer Policy Institute, Australian National University, Canberra. https://taxpolicy.crawford.anu.edu.au/publication/ttpi-working-papers/7561/superannuation-tax-concessions-and-age-pension-principled.
Landau I, Cooney S, Hardy T and Howe J (2014) Trade Unions and the Enforcement of Minimum Employment Standards in Australia, Research Report, Centre for Employment and labour Relations Law, University of Melbourne
Lass, Inga; Wooden, Mark (2017) : The Structure of the Wage Gap for Temporary Workers: Evidence from Australian Panel Data, IZA Discussion Papers, No. 10670
Martin B., Baird M., Brady M., Broadway B., Hewitt B., Kalb G., Strazdins L., Tomaszewski W., Zadoroznyj M., Baxter J., Chen R., Foley M., McVicar D., Whitehouse G., and Xiang N. (2014) Paid Parental Leave Evaluation: Final Report, the University of Queensland commissioned by the Department of Social Services, Brisbane. https://www.dss.gov.au/sites/default/files/documents/03_2015/finalphase4_report_6_march_2015_0.pdf
McClure. P., Sinclair, S. and Aird, W. (2015), A New System for Better Employment and Social Outcomes – Full version of the Final Report, Department of Social Services, Canberra. https://www.dss.gov.au/review-of-australias-welfare-system
Minifie J (2016) Peer-to-peer pressure: policy for the sharing economy, The Grattan Institute, Melbourne.
OECD (2008), Growing Unequal?: Income Distribution and Poverty in OECD Countries, OECD Publishing, Paris, https://doi.org/10.1787/9789264044197-en.
OECD (2009), “Is Work the Best Antidote to Poverty?”, in OECD Employment Outlook 2009: Tackling the Jobs Crisis, OECD Publishing, Paris, https://doi.org/10.1787/empl_outlook-2009-4-en.
OECD (2013), How's Life? 2013: Measuring Well-being, OECD Publishing, Paris, https://doi.org/10.1787/9789264201392-en.
OECD (2015a), In It Together: Why Less Inequality Benefits All, OECD Publishing, Paris, https://doi.org/10.1787/9789264235120-en.
OECD (2015b), Focus on Minimum Wages after the Crisis, http://www.oecd.org/social/Focus-on-Minimum-Wages-after-the-crisis-2015.pdf
OECD (2017a) Real Minimum Wages, https://stats.oecd.org/Index.aspx?DataSetCode=RMW, downloaded 24/08/2017
OECD (2017b), “Evolution of the tax burden (2000-16)” in Taxing Wages 2017, OECD, Paris, https://doi.org/10.1787/tax_wages-2017-8-en, downloaded 24/08/2017.
OECD (2017c), Foreign-born population, https://doi.org/10.1787/5a368e1b-en (Accessed on 11 September 2017).
OECD (2018), OECD Benefits and Wages: Statistics (database), http://www.oecd.org/els/benefits-and-wages-statistics.htm.
Oliver D, Stewart A, MacDonald P and Hewitt A (2016) Unpaid Work Experience: Prevalence nature and impact, commissioned by the Australian Department of Employment, Canberra. https://docs.employment.gov.au/system/files/doc/other/unpaid_work_experience_report_-_december_2016.pdf.
Owens, R., Riley, J., & Murray, J. (2011). The law of work. Oxford University Press.
Productivity Commission (PC) (2015), Workplace Relations Framework, Final Report, Canberra.
Safe Work Australia (2016) Comparison of workers’ compensation arrangements in Australia and New Zealand, Commonwealth of Australia.
Senate of Australia Economic References Committee (2017) ‘Superbad – Wage theft and non-compliance of the Superannuation Guarantee: Report’, Canberra.
Stewart, A., Forsyth, A., Irving, M., Johnstone, R., & McCrystal, S. (2016). Creighton and Stewart's Labour Law. The Federation Press.
Stewart, A., & Stanford, J. (2017). Regulating work in the gig economy: What are the options? The Economic and Labour Relations Review, 28(3), 420-437.
Stewart, M. and P. Whiteford, (2018), “Balancing Equity and Efficiency in the Tax and Transfer System” in R. Breunig and M. Fabian (Eds) Hybrid Public Policy Innovations: Contemporary Policy Beyond Ideology, Routledge.
Victorian Government (2016), Report of the Victorian Inquiry into the Labour Hire Industry and Insecure Work, Industrial Relations, Melbourne.
Watson, I. (2005). Contented Workers in Inferior Jobs? Re‐Assessing Casual Employment in Australia. The Journal of Industrial Relations, 47(4), 371-392.
Whiteford, P. (2010), 'The Australian tax-transfer system: architecture and outcomes', Economic Record, 86 (275), 528-544. Online ISSN: 1475-4932.
Whiteford P, (2017), Social Security and welfare spending in Australia: Assessing long-term trends Policy Brief no: 1/2017, Tax and Transfer Policy Institute, Crawford School of Public Policy, Australian National University, Canberra.
Whiteford, P. and W. Adema (2007), “What Works Best in Reducing Child Poverty: A Benefit or Work Strategy?”, OECD Social, Employment and Migration Working Papers, No. 51, OECD Publishing, Paris. DOI: https://doi.org/10.1787/233310267230.
Whiteford, P. and and G. Angenent (2002), The Australian System of Social Protection: An Overview, 2nd Edition. Department of Family and Community Services, Canberra, Occasional Paper No. 7, Canberra.
Whiteford, P. Millar J. and Mendelson M. (2003), Timing it right? Tax credits and how to respond to income changes, Joseph Rowntree Foundation, London.
Wilkins R (2017) ‘Three charts on: Who holds more than one job to make ends meet?’ The Conversation 18 September 2017, https://theconversation.com/three-charts-on-who-holds-more-than-one-job-to-make-ends-meet-83299 (downloaded on 14 Dec 2017)
Wooden, M. (2017), Has the level of casual employment in Australia stayed steady for the past 18 years? The Conversation, downloaded 23 July 2017.
Wright C.F. and Lansbury R. (2016) ‘Employment Relations in Australia’ in Bamber G.J., Lansbury R.D., Wailes N. and Wright C.F. (eds) (2016) International and Comparative Employment Relations: National Regulation and Global Changes (6th edition) Allen & Unwin/Sage: London
Wright C.F., Clibborn S., Piper N. and Cini N. (2016) Economic Migration and Australia in the 21st Century. Sydney: Lowy Institute for International Policy.
Notes
← 1. For example, many single parent ‘pensioners’ were in employment during this period, and durations of unemployment benefit receipt beyond 12 months became more commonplace.
← 2. Resulting in ‘Parenting Payment (single)’ which, although defined as a ‘social security pension’ under the Social Security Act 1991 (Cth), has design features of both pensions and benefits, and has become an ‘intermediate’ category of income support.
← 3. Cash spending includes social security and other payments made in cash to individuals and excludes services or subsidies. The main non-income-tested spending relates to state government schemes of workers’ compensation and pensions for retired public servants.
← 4. For social security benefits income free areas largely recognise the costs of taking up work, with ‘credit’ or ‘banking’ mechanisms providing an added incentive to take-up intermittent casual work.
← 5. In effect student assistance rates expect recipients to have additional income from part-time work (or another income source) so as to achieve a similar living standard to that achieved by an unemployed adult.
← 6. We describe the federal industrial relations system which now covers most Australian employees (Productivity Commission, 2015).
← 7. “[An] owner manager of an incorporated enterprise (OMIE)…[is] a person who operates his or her own incorporated enterprise, that is, a business entity which is registered as a separate legal entity to its members or owners (also known as a limited liability company). … [An] owner manager of unincorporated enterprise (OMUE)… [is] a person who operates his or her own unincorporated enterprise or engages independently in a profession or trade.” These workers may employ others, or they may not.(ABS 2014).
← 8. Lass and Wooden note that “45% of casual (non-managerial) employees are paid exactly the award rate, which compares with just 18% of permanent (non-managerial) employees” (ABS, Data Cube 5, Table 2, Australian Bureau of Statistics (ABS). Employee Earnings and Hours, Australia, May 2016. ABS cat. no. 6306.0. Canberra: ABS.). (p7)
← 9. In 2016/17 the Fair Work Ombudsman (2017) states it obtained AUD 30.6 million for over 17 000
Workers, https://www.fairwork.gov.au/annual-reports/annual-report-2015-16, downloaded 11 March 2018
← 10. See for example, the 7 Eleven grocery franchise, Ferguson and Danckert (2015), http://www.smh.com.au/interactive/2015/7-eleven-revealed/, downloaded 10 September 2017
← 11. Replaced by new Temporary Skill Shortage (TSS) visa with effect from March 2018. See Department of Home Affairs (2017) https://www.border.gov.au/Trav/Work/457-abolition-replacement.
← 12. For income tax purposes, expenses are broken down into direct expenses, those that are directly linked to the generation of the income and sometimes called cost of sales, and indirect or overhead expenses. Direct expenses are those that increase or decrease depending on the level of income being generated. For a manufacturer, direct expenses include materials and direct labour costs, while for a retailer it is the net cost of stock purchases. Overhead expenses are those that do not depend on the amount of revenue produced, but must be paid just because the business is operating. Overhead expenses include rent, interest on loans taken out to purchase the business, insurance and vehicle costs. Generally, income tax allows the deduction of direct expenses (Australian Tax Office, 2017a).
← 13. The tests which the Australian Tax Office (ATO) applies appear similar to those for deciding if a worker is an employee, https://www.ato.gov.au/individuals/super/getting-started/contractors/ https://www.ato.gov.au/business/employee-or-contractor/difference-between-employees-and-contractors/ Senate of Australia (2017) comments on “the complexity of classifying workers correctly for superannuation purposes” (p. 42). It also reports one lawyer providing evidence that “individuals suffer a serious injury or health event and seek access to a disability or income protection insurance payment, only to find that due to SG non-payment, they are in fact ineligible for assistance under their superannuation fund policy's benefit” (pp 24-5).
← 14. Workers working multiple part-time jobs can pay into their superannuation fund voluntarily, but will not receive employer contributions.
← 15. The abbreviation “ttE” means that contributions to pension schemes are taxed as concessional rates (t), their earnings in funds are also taxed at concessional rates (t), and pension payments are exempt from taxation (E).
← 16. The Australian Insurance Brokers (2013) Summary of Workers’ Compensation Australia, states ‘Private sector insurers provide workers compensation in the risk states (being West Australia, ACT, Tasmania and Northern Territory) while state monopolies operate in New South Wales, Victoria, South Australia and Queensland’: http://www.aisinsurance.com.au/wp-content/uploads/2013/04/Summary-of-the-Australian-Workers-Compensation-System.pdf Downloaded 24 July 2017
← 17. https://www.safeworkaustralia.gov.au/system/files/documents/1806/comparative-performance-monitoring-report-19th-edition-part-3_0.pdf.
← 18. It is worth noting that workers’ compensation schemes in Australia are not ‘exhaustive’ (i.e. it is possible to get workers’ compensation for a work-related illness or injury, and also pursue a civil damages award in relation to the same compensable event).