Chapter 3. The business environment for SMEs and entrepreneurship in Indonesia
This chapter assesses the business environment for SMEs and entrepreneurship in Indonesia and, in particular, macroeconomic conditions, labour market regulations, the level of skills in the labour force, product market regulations, taxation affecting small business development, access to finance conditions, the innovation system and the ability of Indonesia to attract foreign investments. Indonesia’s macroeconomic conditions are healthy and supportive of business growth, small business taxation is light, and access to finance for SMEs has been enhanced by a series of regulatory reforms, including the requirement on state-owned and commercial banks to devote at least 20% of their business loans to SMEs. On the downside, there are signs of skills shortages in the labour market, the business license and permit system is still fairly complex despite recent improvements, and the national innovation system should be further developed. Stronger SME development policies, however, are likely to require an enlargement of the national tax base by bringing more companies into the formal sector and by improving efficiency in tax administration.
Macroeconomic conditions
Indonesian macroeconomic conditions are generally healthy and supportive of business growth. They include a young and growing population, a large domestic market, abundant natural resources, a stable political system, and a prudent fiscal policy framework. National gross domestic product (GDP) has grown steadily over the past decade and has not been affected too negatively by the 2008-2009 global recession, with Indonesia’s GDP growth rate having been higher than both the OECD average and the average of dynamic Asian economies since 2011 (Figure 3.1). Indonesia’s GDP in current prices totalled IDR 13 589 trillion (about USD 1 016 billion) in 2017, making Indonesia by far the largest economy of Southeast Asia.
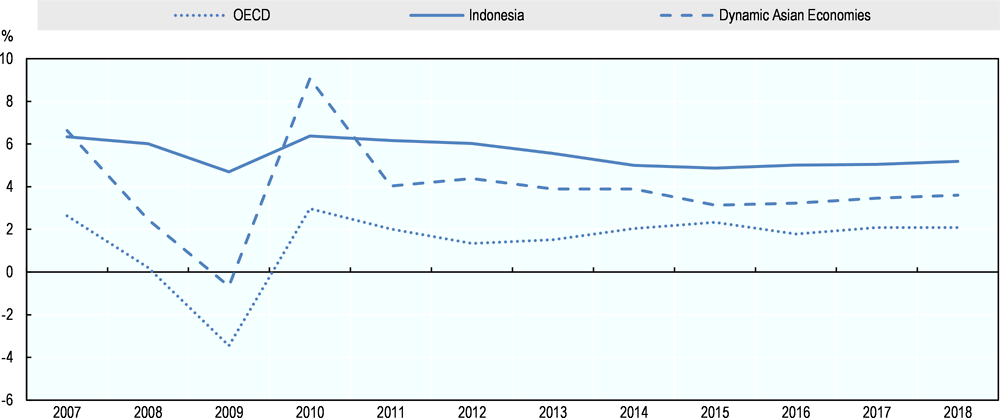
Notes: Gross domestic product in US dollars and constant exchange rates. Dynamic Asian Economies include Chinese Taipei, Hong Kong (China), Malaysia, the Philippines, Singapore, Thailand and Viet Nam.
Source: OECD Economic Outlook Database.
The drop in commodity prices in 2011 and then, more severely, from mid-2014 onwards has had a serious impact on Indonesia’s exports, since commodities (e.g. palm oil, coal, natural gas, crude oil, rubber and copper) account for about half of national export volumes. This has had an impact on the current account balance which has been in a deficit position since 2012 (Figure 3.2). Furthermore, the development of a strong national manufacturing sector has partly been hindered by Indonesia’s strong dependence on imported raw material and, more recently, by the depreciation of the Indonesian rupiah against the US dollar.
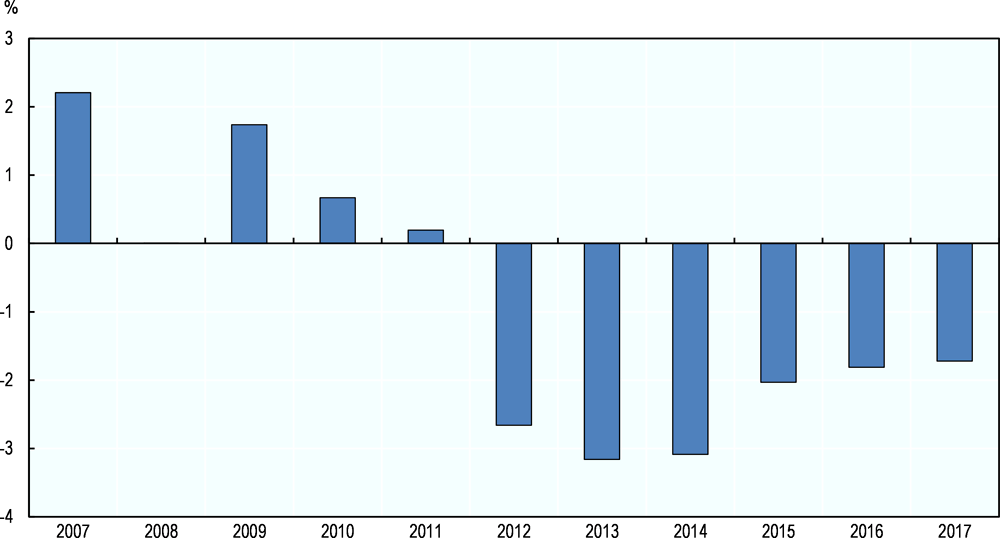
Source: OECD Economic Outlook Database.
Indonesia’s government budget position is solid, with low public debt (29% of GDP in 2017) and a budget deficit which is below the 3% limit set by national law: 2.5% in 2017 and 2.1% in 2018. The budget deficit is projected to drop further to 1.8% in 2019, with an increase in tax revenues driving the consolidation (OECD, forthcoming). Indonesia’s government spending is moderate by international standards, at 21.6% of GDP, compared with the OECD average of 40.6%. The central government collects 89% of total tax revenues, but only accounts for 47% of total government expenditures, which is due to large cash transfers from the central government to subnational governments as a consequence of the extensive devolution process started in the early 2000s (OECD, 2016a) (see also chapter 6).
The Indonesian economy is still characterised by a low share of services in the economy, i.e. 45.4% of national value added, with industry (including construction) and the primary sector (including mining) accounting respectively for 33.1% and 21.5%. The services sector has grown faster than industry and the primary sector, at an annual average rate of 6.8%, but its weight in the economy is still much lower than in other middle-income economies, where it averages 60% of GDP (World Bank, 2017a). Policies to support the services sector, such as trade liberalisation of services, are likely to benefit the whole economy through the close linkages of the services sector with other industries.
The labour market
In 2017, Indonesia’s labour market participation rate (70%) and employment rate (66%) were slightly lower than the respective OECD averages (72% and 68%), while the unemployment rate (5.6%) was similar to the OECD average (5.9%). However, youth unemployment is still high and women’s labour market participation continues to be low. In 2017, Indonesia’s youth unemployment rate was 17.8%, while women’s labour market participation rate was nearly 30 percentage points below that of men (55.1% vs. 84.8%). Furthermore, about 70% of national employment is estimated to be informal (OECD, forthcoming; Rothenberg et al., 2016), and vulnerable employment (e.g. own account workers and unpaid family workers) is estimated at 58% of total employment, higher than China (45%), the Philippines (37%) and Malaysia (22%) (ILO, 2016).
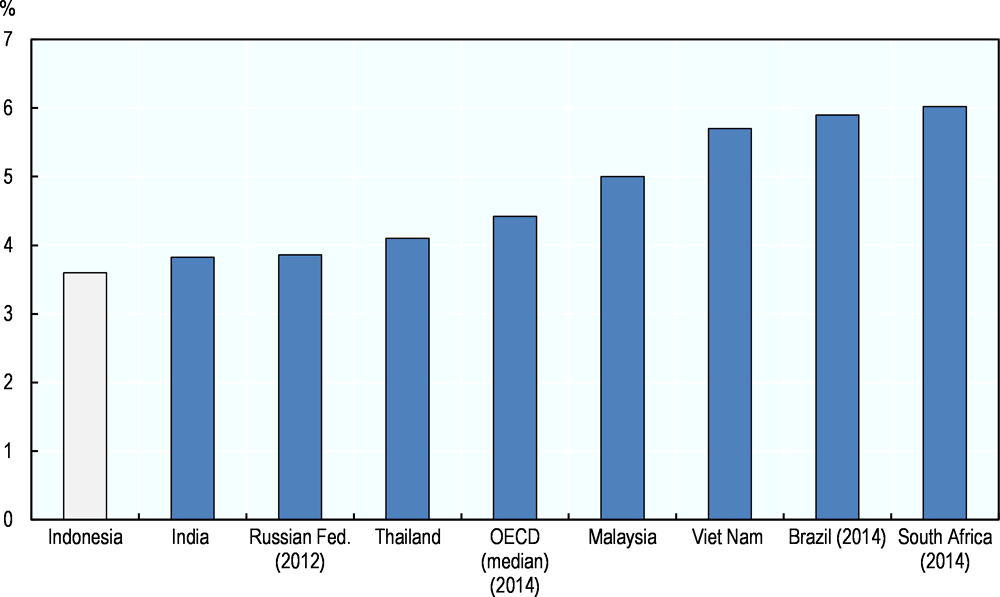
Some rigidities in labour market legislation help to explain the large size of the informal economy. According to the OECD Employment Protection Legislation (EPL) dataset, Indonesia has the most restrictive legislation related to the protection of permanent workers against individual dismissals, including high severance pay, whereas regulations on temporary labour contracts are more relaxed, with Indonesia ranking 19th in this specific indicator (Figure 3.3).
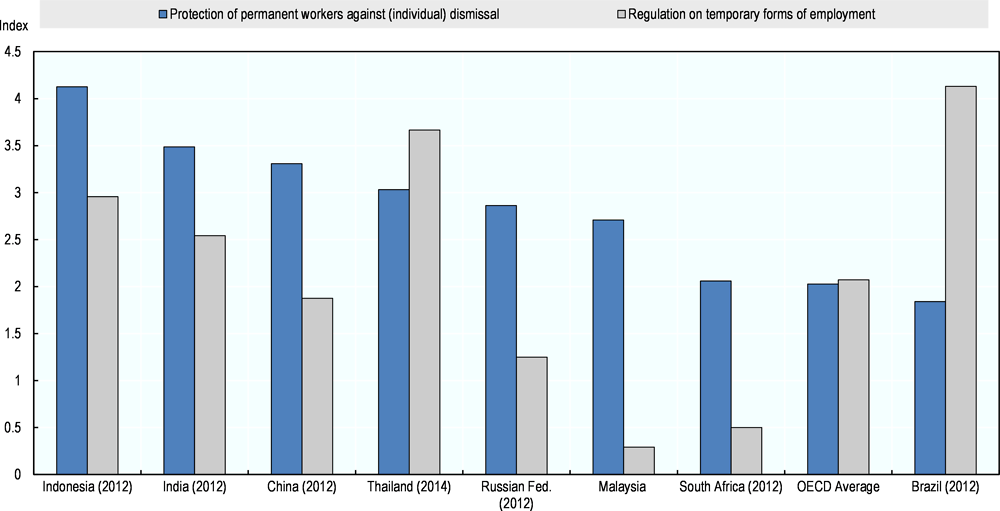
Note: The OECD indicators on Employment Protection Legislation measure the procedures and costs involved in dismissing individuals or groups of workers and the procedures involved in hiring workers on fixed-term or temporary work agency contracts. Data for Brazil, China, Indonesia, India, the Russian Federation and South Africa refer to 2012; data for Malaysia to 2013; data for Thailand to 2014.
Source: OECD Employment Protection Legislation Database.
Indonesia’s statutory minimum wage is also high in international comparison, at around the full-time national median wage (OECD, forthcoming). A high minimum wage mostly penalises vulnerable workers (e.g. low-skilled, unemployed, workers from socially disadvantaged groups), especially when a large informal sector provides an easy and cheaper alternative to employers.
Labour market reforms can play an important role in reducing the size of the informal sector and fostering the scale-up of existing SMEs. Pilot policy measures could include simpler procedures and circumstances for individual dismissals, the replacement of high severance pay with a form of government-backed unemployment insurance and quarterly payments (instead of monthly payments) of social contributions for small firms (OECD, forthcoming).
Human resources
Indonesia has achieved nearly universal literacy – 94% of the population was literate in 2014 – and its enrolment rates in secondary school for 15-19 year-olds (79% for men and 78% for women) are not too far from the OECD average (82.7% for men and 84.6% for women). However, Indonesia’s enrolment rates drop considerably in the following age group (20-29 years old), where only 9% of both men and women are enrolled in education, compared with OECD averages of 26.5% for men and 29.8% for women (OECD, 2017a). This suggests that participation in tertiary education is still limited.
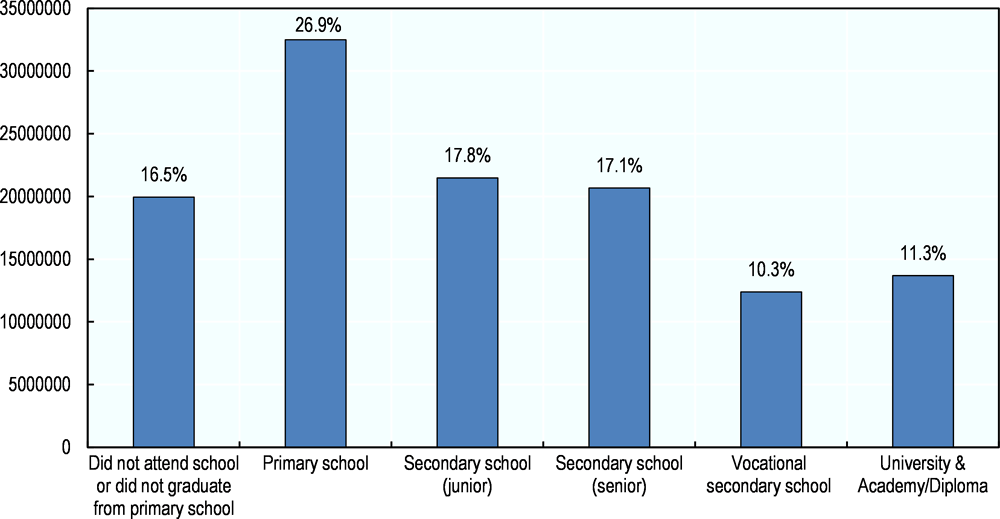
The composition of the labour force reflects education statistics. Those who did not attend school (4 million), did not graduate from primary school (16 million) or only completed primary school (32 million) account for 43.5% of the total labour force; those who graduated from junior high school (21 million), senior high school (21 million) and vocational high school (12 million) account for 45.2%; and those who obtained a diploma (3 million) or a university degree (10 million) make up the remaining 11.3% (Figure 3.4).
Data from the OECD Programme for the International Assessment of Adult Competencies (PIAAC), which conducts surveys of adult skills in OECD and non-OECD countries, also point to skills deficits in the Indonesian adult population (aged 16-64): almost 70% of the surveyed population did not reach proficiency Level 2 out of 5 in literacy and 60% did not reach Level 2 in numeracy.
People with higher levels of education show unemployment rates above the national average. This suggests limited returns from investment in education, which might be linked to an underperformance of the national education system (OECD/ADB, 2015) and to low-skilled workers being more willing to work in the informal sector.
OECD PIAAC data also show that as many as 14.5% of workers are considered over-skilled in their current job in Indonesia, against an OECD average of 10.8%, while more than half of Indonesian workers (54.6%, compared with an OECD average of 39.6%) work in industries unrelated to their field of study. This has important wage implications: wages for workers working in industries unrelated to their educational qualification are 19% lower than those of equally-skilled workers working in sectors related to their field of education (OECD, 2016b).
Source: Central Bureau of Statistics (Badan Pusat Statistik), https://www.bps.go.id
Indonesia’s Masterplan for the Acceleration and Expansion of Economic Development sets the objective of reaching 113 million skilled workers by 2030. To achieve this goal, the government has committed 20% of the state budget to education, which is high by international standards, although limited government fiscal revenues mean that public spending on education is 3.5% of national GDP, which is relatively low in international comparison (Figure 3.5).
Going forward, participation in secondary and tertiary education should be increased to boost the basic skills of the Indonesian labour force. OECD simulations suggest that a one standard-deviation increase in years of schooling (around 3.4 years) would lift the hourly wage by 26.6% in Indonesia, almost twice the OECD average (14.4%). However, it will also be important to improve the efficiency of public spending on education which will include, among other things, enhancing teacher competencies and reducing teacher absenteeism (OECD, 2016b).
Note: Data for the Russian Federation refer to 2012; data for Indonesia, India, Thailand, Malaysia and Viet Nam refer to 2013; data for Brazil, South Africa and the OECD refer to 2014.
Source: World Bank World Development Indicators and OECD Education database.
Vocational Education and Training (VET) in Indonesia
Similarly to other countries, training a student in the Indonesian vocational education and training (VET) system is more expensive than training a student in the general education system (IDR 6.8 million vs. IDR 5.3 million per year). Nonetheless, secondary VET graduates are the group facing the highest unemployment rate in Indonesia (almost 10% compared with the country average of 5.5%), and Indonesian employers consider as many as 20% of new hires with VET qualifications of poor or very poor quality (OECD/ADB, 2015). These figures suggest that issues of quality and cost-efficiency, which apply to the overall education system, are particularly apparent in VET.
One of the main challenges facing Indonesian VET is the lack of up-to-date equipment. Although a law from 1997 encourages collaboration between VET schools and private-sector companies, few of such collaborations exist, making it difficult for VET schools to address industry demands in a timely manner. Another issue concerns the skills level of VET teachers, with many of them coming from a purely academic background, having worked in the same school for many decades, and having never been subject to an assessment review of their performance (OECD/ADB, 2015).
In November 2016 the Ministry of Industry, Research, Technology and Higher Education, the Ministry of Education and Culture, the Ministry of State-Owned Enterprises and the Ministry of Manpower signed a Memorandum of Understanding to strengthen the participation of industry practitioners in the national VET system, including through the creation of internships and on-site training programmes for students and teachers. As a result, a pilot project involving a partnership between three private-sector firms and 20 VET schools has recently been launched (OBG, 2017). This model of collaboration between VET schools and the private sector should be expanded if it proves successful.
Product market regulations and the ease of doing business
Product market regulations, such as those governing business licenses and permits, have a direct impact on business start-up and business scale-up, as well as on the decision of entrepreneurs to operate in the formal or informal sector. The OECD Product Market Regulation (PMR) indicators assess regulatory complexity in three areas: i) state control of the economy; ii) barriers to entrepreneurship; iii) barriers to trade and investment. Indonesia ranks below the OECD average in each of these three categories, whereas compared to other major emerging-market economies such as Brazil, China and India its performance is mixed: Indonesia’s barriers to entrepreneurship are the lowest of the four, whilst state control of the economy is the highest (Figure 3.6).
The World Bank Doing Business annual report is another important comparative source of information on the ease of doing business. Between 2015 and 2018, Indonesia gained 48 positions in the general “ease of doing business” world ranking, moving from the 120th position in 2015 to the 72nd position in 2018, with progress in the so-called “distance to frontier” (i.e. the distance to the best-performing country) in almost all sub-indicators comprising the overall index (Table 3.1). This improvement has been the result of some important recent targeted reforms.
For example, the 2016 “Economic Policy Package XII on the Ease of Doing Business” aimed at reducing the number of days needed to start a business from 48 to 10, the number of procedures from 13 to 7, and the cost linked to setting up a business from IDR 6.8-7.8 million to IDR 2.7 million (World Bank, 2017b). Additional recent reforms have included a reduction in the time needed to register property and acquire construction permits; less frequent tax compliance requirements; and the merger and digitalisation of two forms for business trading licenses and company registrations in Jakarta (World Bank, 2017b; OECD, 2016a).
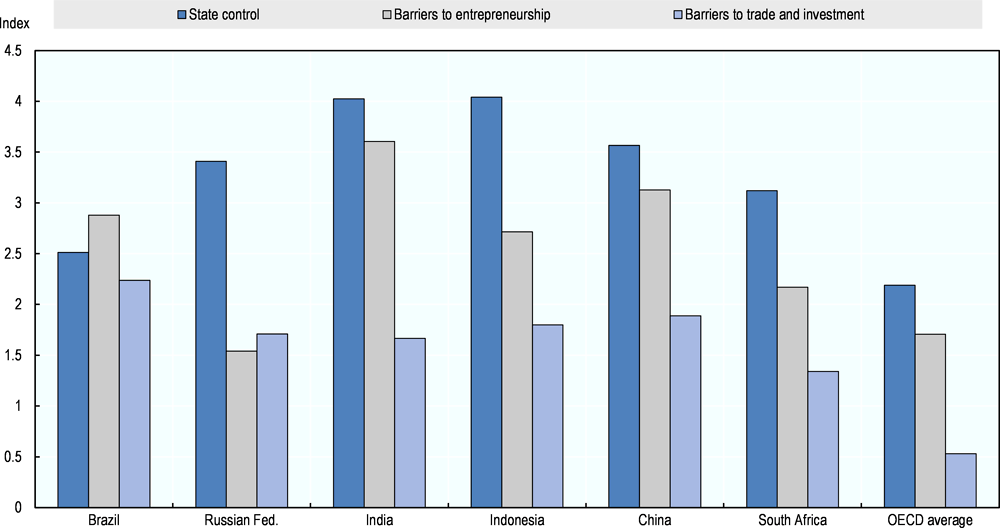
Note: “State control” refers to public ownership (e.g. scope and governance of state-owned enterprises, government involvement in network sectors, etc.) and public involvement in business operations (e.g. price controls); “barriers to entrepreneurship” include complexity of rules and procedures (e.g. the license and permit system), administrative burdens on start-ups (i.e. for both corporations and for sole proprietor firms) and regulatory protection of incumbents (e.g. legal barriers to entry and anti-trust exemptions); “barriers to trade and investment” encompass explicit barriers (e.g. tariffs) and non-explicit barriers (e.g. different treatment of foreign suppliers) to trade.
Source: OECD Product Market Regulation (PMR) database.
Despite recent progress, more could be done to further improve the ease of doing business in Indonesia. For example, the national licensing system remains fairly complex and contributes to the very low position of Indonesia in the specific World Bank Doing Business indicator of “starting a business” (144th position worldwide). After the so-called Big Bang devolution of the early 2000s, many responsibilities related to business licensing were transferred to the subnational level. However, strong heterogeneity in institutional quality across Indonesia has hindered the development of an effective national system of business licenses and permits (OECD, 2012) (see chapter 6 for further details).
In mid-2018, the Indonesian government was in the process of developing an online single submission system to allow the centralisation of licensing procedures from all levels of government into one single website. This is a welcome development, which is likely to require some time to be fully implemented. In this area, the experience of another federal country (e.g. Canada) in managing its national business license system online across different levels of government can offer a policy model for Indonesia to follow (see Box 3.1).
Description of the approach
BizPaL is a collaborative partnership between the federal, provincial and municipal governments of Canada, which includes the participation of over 34 federal government departments and agencies, 13 provinces and territories, and about 700 municipalities to provide information on the permits and licenses required to start and grow a business. Accessing the BizPaL website allows entrepreneurs to identify which permits and licenses they require and how to obtain them. From the website, they select the business activities they plan to undertake and BizPaL automatically generates a list of all required permits and licenses from all levels of government (federal, provincial, territorial and municipal), along with basic information and links to the specific government sites where the entrepreneur can learn more and, in some cases, apply online. The federal government manages the BizPaL project but each jurisdiction is responsible for maintaining its own data within the central database. Information is entered into this database using the BizPaL Administration Module, a secure web–based application. BizPaL receives CAD 3 million annually in federal funding.
Success factors
The success of BizPal rests on the partnership across different levels of government, outreach to other regional SME support organisations, and innovations in the use of information technology platforms to collate a variety of business-related government databases and disseminate information and services.
Obstacles and responses
It was more difficult than initially expected to bring municipalities into BizPal, especially those in smaller and more remote locations, as they lacked staff and capacity to participate. When the project was piloted in 2006, only 13 municipalities were part of the project, increasing to approximately 580 in 2008 (i.e. 16% of the total 3 647 municipalities of Canada). The BizPaL team realised that their target objectives for municipality participation were too ambitious and that much more intensive involvement with municipalities was needed to bring them on board. For example, provincial and territorial governments had to spend considerably more time uploading information on behalf of the local governments than they had originally thought.
Moreover, awareness of BizPaL among SME owners was low, even two years after the launch of the initiative. Thus, BizPaL undertook a national marketing campaign to increase awareness and interest among potential users. The specific objectives of the marketing campaign were to improve client awareness and usage of the BizPaL service and increase BizPaL recognition through cohesive and consistent marketing communication, activities and messaging.
Finally, there was uncertainty with respect to securing ongoing resources from federal and provincial governments, which was alleviated by the federal government decision to allocate an annual CAD 3 million to the project.
Relevance to Indonesia
Similarly to Canada, Indonesia is a federal country in which business licenses are managed by national, provincial and local governments. Better co-ordination between these different levels of government, supported by increased digitalisation of the whole licensing process, would help simplify Indonesia’s business license system.
For a similar policy to be successful, however, complementary measures are needed, including faster and more widespread broadband connection across the country and capacity-building initiatives for the staff in local governments assigned to the project.
Sources for further information
OECD (2017b), SME and Entrepreneurship Policy in Canada, OECD Publishing, Paris, https://doi.org/10.1787/9789264273467-en.
Taxation affecting small businesses
Taxation is another important dimension of the national business environment which is closely related to product market regulations through tax compliance requirements. Of Indonesia’s 260 million citizens only 33 million were registered tax payers in 2016, while only 2.9 million companies were known to the national tax authority (OECD, forthcoming). Both figures contribute to Indonesia’s narrow tax base.
Since 2013, Indonesia has enforced a special tax regime for SMEs with the aim of encouraging small business formalisation.1 Businesses in eligible sectors with an annual turnover below IDR 4.8 billion (around USD 350 000) can opt into the scheme and pay a rate of 0.5%, based on their monthly turnover. The rate was originally 1%, but it has recently been halved, with an additional cost to the government of between IDR 1-1.5 trillion in terms of foregone fiscal revenues. By mid-2018, this special tax regime had attracted 1.5 million small companies (OECD, forthcoming).
Above the IDR 4.8 billion threshold, statutory corporate income taxation applies. The corporate income tax rate for companies with revenues between IDR 4.8 billion and IDR 50 billion (USD 350 000 and USD 3.8 billion) is 12.5% on the first IDR 4.8 billion and 25% above this threshold, while for companies with turnovers above IDR 50 billion, corporate income tax is set at a flat rate of 25%. A lower corporate income tax rate of 20% applies to companies listed on the stock exchange with more than 40% of traded shares.
Personal income tax rates, which apply to the taxable personal income (i.e. after basic allowances and any possible dependent allowances) of small business owners who run sole-proprietor firms or unincorporated companies are, on the other hand, 5% up to IDR 50 million, 15% between IDR 50 million and IDR 250 million, 25% between IDR 250 million and IDR 500 million, and 30% over IDR 500 million (Indonesia Investment, 2017; PWC, 2016).
Indonesia’s business income tax system has two main noteworthy features. First, it applies different rates depending on the annual revenues of the business. This is not uncommon to OECD countries and other G-20 economies, 14 of which have lower corporate income tax rates for small businesses (OECD, 2015). However, the average difference between the statutory corporate income tax rate and the preferential small business tax rate is four percentage points among the countries covered in this study, whereas in the case of Indonesia businesses are faced with a major tax threshold at IDR 4.8 billion, until which they can opt for a simplified turnover-based tax rate of 0.5%. A risk with major tax thresholds is that they can effectively discourage business growth, whether artificially (through tax evasion) or by companies deliberately restraining growth opportunities.
Second, although this special tax regime is meant to bring micro and small companies closer to the formal economy, the income threshold (annual IDR 4.8 billion) appears to be somewhat high, effectively exempting a large number of formal companies in Indonesia from contributing to the national tax base in line with their revenues. The income threshold could be lowered, while additional benefits could be offered such as access to book-keeping assistance and government support programmes (OECD, forthcoming), as done for example in Mexico through the Régimen de Incorparación Fiscal (RIF) (see Box 3.2).
More broadly, it will be important to strengthen tax collection capacity at the national and, if necessary, subnational level (see chapter 6). The latest OECD Economic Survey of Indonesia dedicates a special chapter to the issue of raising public revenues in a way that is favourable to growth and equity. Some of the suggested measures to improve tax collection will include: investing in tax administration, particularly staff, electronic services and databases; using technology to strengthen monitoring and detect non-compliance, including through the use of risk-based assessments for conducting tax audits; and building capacity at the subnational level through training (OECD, forthcoming).
In January 2014, Mexico replaced its earlier small-taxpayer regime (Régimen de Pequeños Contribuyentes, REPECOS) with the Régimen de Incorporación Fiscal (RIF). In order to reduce the size of the informal economy, the new regime offers substantially lower personal, social security and value-added and excise tax obligations over a period of ten years to small companies that decide to regularise their position. Tax rate reductions gradually phase out during the ten-year period. The RIF is specifically directed at small business owners whose income does not exceed MXN 2 million. To give a further incentive for business formalisation, the federal government also offers training, credit lines and an easy-to-use online book-keeping tool which facilitates tax compliance (called Mis cuentas, “My accounts”).
To adhere to the programme beneficiaries must enrol in the Federal Taxpayer Registry, record revenues and expenses, invoice clients upon request and submit bi-monthly statements.
Source: OECD (2015), Taxation of SMEs in OECD and G20 Countries, OECD Tax Policy Studies, No. 23, OECD Publishing, Paris, https://doi.org/10.1787/9789264243507-en.
Access to finance
Debt finance
In 2015, 59.8% of Indonesian firms had a current or savings account and 27.4% had a bank loan or a credit line. However, only 12.8% of business investment was financed by bank loans and 3.7% by supplier credit, with 66% being financed by internal resources (World Bank, 2015).
Business credit grew considerably in Indonesia over the period 2012-2016, at an annual rate of 62%, totalling IDR 4 505 trillion (about USD 335 billion) in 2016, i.e. 36% of national GDP. SME loans corresponded to about 18-20% of total business loans over the same time period.2 Most SME loans are used to finance working capital (73%), suggesting that they are of short duration. Medium-sized enterprises (46%) are the main recipients of SME loans, followed by small enterprises (30%) and micro-enterprises (24%) (Figure 3.7).
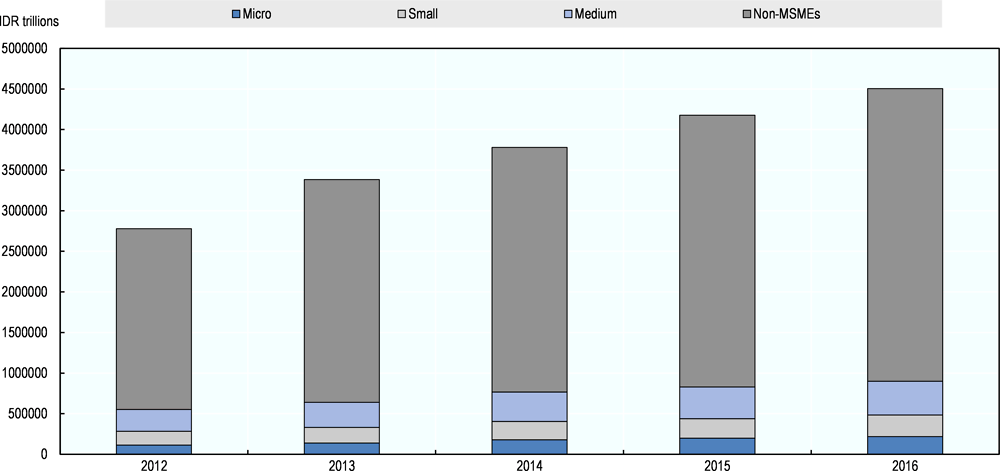
Note: Bank Indonesia’s definition of SME loans follows the SME definition of Law 20/2008.
Source: Bank Indonesia Database, http://www.bi.go.id/id/umkm/kredit/data/Documents/Perkembangan%20Kredit%20UMKM%20dan%20MKM%20Des%202016_BD.pdf
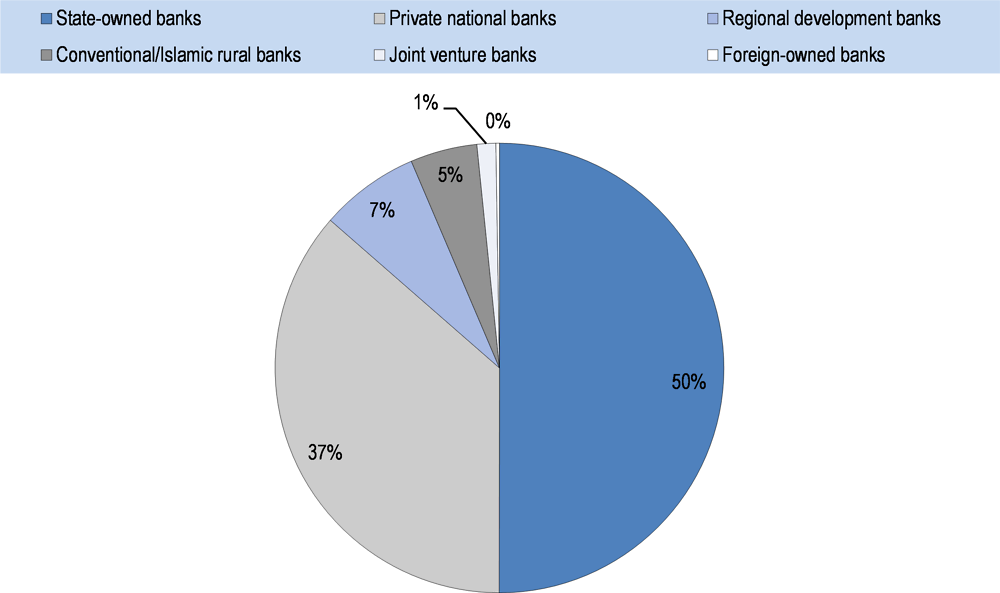
In 2016, half of total credit to SMEs was issued by state-owned banks, with an increase of 5% over the period 2012-2016. Commercial banks lost SME market shares, from 41.5% of total SME loans to 37%, over the same period. Regional development banks, which mostly target micro and small enterprises, still play a small role, only accounting for 7% of total SME loans (Figure 3.8).
State-owned and commercial banks operating in Indonesia must comply with set-aside requirements on the proportions of loans given to SMEs, the target for which has gradually increased from 5% in 2015, to 10% in 2016, 15% in 2017, and 20% in 2018. According to a 2017 report from the national Financial Services Authority (Otoritas Jasa Keuanga, OJK), around one-fifth of commercial banks in Indonesia (mostly joint ventures or foreign banks with local operations) had fallen short of this target, allocating less than 10% of their business loans to SMEs. On the other hand, state-owned banks, with an overall 26% share of SME loans in their business loan portfolios, were fully compliant with this legal requirement. Bank Indonesia is poised to impose administrative sanctions on non-compliant banks, which can take the form of a warning, a fine or a communication that further measures will be taken by the Financial Services Authority. Banks, for example, may be prevented from progressing to the above bank-tier until the target is achieved, which has implications for the range of financial services they can offer to the public.
Source: Bank Indonesia Database, http://www.bi.go.id/id/umkm/kredit/data/Documents/Perkembangan%20Kredit%20UMKM%20dan%20MKM%20Des%202016_BD.pdf.
In 2006, Bank Indonesia established the first public credit bureau (Biro Informasi Kredit, BIK) to collect personal debtor information history and make it available to financial institutions with the aim of reducing information asymmetries in SME credit markets. In 2013, Bank Indonesia also issued a “Regulation on Credit Information Management Bureaus”, clearing the way for private credit bureaus to collect data on creditors. As of 2017, private credit bureaus covered 18% of the adult population in Indonesia. Box 3.3 provides international good-practice guidelines on the management of credit bureaus to help further expand the population coverage and strengthen the use of credit bureaus by financial institutions in Indonesia.
A collateral registry has also been recently established in Indonesia to favour asset-based lending to SMEs. In this field, Mexico offers an interesting example of a country which has established a collateral registry that collects information not only on fixed assets but also on moveable assets (Box 3.4), something which could be replicated in Indonesia.
Finally, the Financial Services Authority (OJK) has issued regulations to lower the risk weight for SME loans guaranteed by entities owned by regional governments (Badan Usaha Milik Daerah, BUMD) and to ask banks to focus on “payment capacity”, which involves taking into account not only collateral requirements but also business revenues in the loan decision-making process.
The aim of credit bureaus is to reduce information asymmetries between creditors and borrowers. Credit bureaus can support SME lending by helping lenders to assess the creditworthiness of borrowers which lack certified financial statements. For example, credit bureaus can collect information on the past behaviour of SMEs in contractual financial obligations such as trade credit, loans and other forms of finance, as well as on their payment history related to taxes and utilities.
According to the World Bank’s General Principles for Credit Reporting (2011), there are five main success factors for the development of credit reporting systems:
-
Credit reporting systems should have relevant, accurate, timely and sufficient data (including positive information) collected on a systematic basis from all reliable and available sources;
-
Credit reporting systems should have rigorous standards of security and reliability;
-
The governance arrangements of credit reporting service providers should ensure accountability and transparency concerning the risks associated with the business and fair access to this information by users;
-
The regulatory framework for credit reporting should be clear, predictable, non-discriminatory, proportionate and considerate of consumer rights;
-
The legal and regulatory framework should include effective judicial or extrajudicial dispute resolution mechanisms.
An important aspect that also needs to be taken into consideration is privacy and data protection since information gathered and stored in credit registries is often very sensitive. It should be a priority for the government to guarantee that regulation on the use of data is clear and strict, and that the judicial system can enforce it through administrative sanctions if necessary.
Source: World Bank (2011), General Principles for Credit Reporting, Washington DC.
In 2010, Mexico introduced a Unified Registry of Movable Collateral Assets to boost collateral registration. The goal of the registry is to allow borrowers to pledge additional assets beyond fixed assets to access debt finance. The registry makes information on collateral assets available online for all interested parties (notaries, lawyers, state officials, bank creditors), with no registration fee required. The digitalisation of the service provides an immediate and cheap alternative to the previous paper-based system.
In the first 18 months of the programme, nearly 67 000 collateral assets were registered, with an estimated increase of business loans by four times (more than USD 50 billion of additional financing), and USD 1.1 billion saved on fees, compared with the previous paper-based system.
Source: OECD (2013), Mexico: Key Issues and Policies, OECD Studies on SMEs and Entrepreneurship, OECD Publishing, Paris. https://doi.org/10.1787/9789264187030-en
On the whole, the government of Indonesia has enforced a vast array of measures to favour access to finance for SMEs. For example, compulsory SME lending set-asides should help expand credit to SMEs. The 20% SME loan target appears reasonable given the existing share of SME loans out of total business loans across OECD countries, although SME loan definitions vary by country making fully internationally comparable information unavailable (OECD, 2018a). However, considering the co-existence of other large SME financing programmes (e.g. the KUR Programme, see chapter 5), a similar policy needs to be closely monitored to ensure that it does not lead to an upsurge in non-performing loans. Similarly, while most state-owned banks have easily met the 20% target, commercial banks, notably foreign-owned banks, have experienced more difficulties due to the inability to find enough SMEs with the business permits, financial statements and collateral assets required by the operational rules of the bank to issue a loan. Thus, it will be important to monitor that a similar measure does not have the unintended consequence of reducing competition in the banking sector by pushing too many commercial banks out of the market.
The growing role of state-owned banks in SME lending should also be closely monitored. On the one hand, it clearly fills a market gap that some commercial banks are unwilling to serve. On the other hand, it can also lead to an increase in non-performing loans – state-owned banks face less market pressure from private shareholders and more political pressure to meet government targets – and to the possible crowding out of commercial banks from the SME market by introducing lending conditions (e.g. interest rates and loan repayment terms) that are not market-based.
Finally, the recent establishment of a collateral registry and credit bureaus are positive developments that should be further pursued and reinforced, including through stronger coverage of SMEs and use by financial institutions.
Equity finance
The Indonesian government actively supports the development of alternative sources of finance for SMEs. Indonesia’s Financial Services Authority (OJK) has introduced lower requirements in terms of company assets and fundraising for SMEs interested in initial public offerings (IPOs), as well as a simplified financial accounting standard for smaller SMEs with assets up to IDR 50 billion. Furthermore, the OJK has issued regulations to facilitate peer-to-peer lending for small limited liability companies with capital up to IDR 1 billion. Loans must be denominated in Indonesian rupiah and cannot exceed IDR 2 billion for each borrower.
The Indonesia Stock Exchange (IDX) also actively supports the access of SMEs to capital markets through an SME Development Initiative comprising the Acceleration Board, i.e. a junior equity market with lower listing requirements than the main equity market, and an incubator programme intended to prepare growth-oriented start-ups for IPOs (both initiatives are further discussed in chapter 5 of the report).
From the investor’s side, private equity funds that re-invest after-tax profits within the same year are exempt from the branch profit tax on these profits (on average 20%). In addition, income earned by venture capital companies from their investments in Indonesia is exempt from capital gains taxation, if the investment was directed at SMEs in one of the government priority sectors, defined as those with high value added and positive externalities (PWC, 2017).3
Altogether, this range of measures is well-intentioned to foster SME participation in equity markets, although very few Indonesian SMEs appear ready to enter the stock market, even when this involves junior equity listings where regulatory requirements are less strict. Increased government attention to the investment readiness of domestic growth-oriented SMEs would therefore be warranted.
Financial literacy and financial inclusion
Financial literacy and financial education have been used by the Indonesian government to enhance the financial inclusion of micro-enterprise owners. The government of Indonesia, through Regulation 82/2016, is currently implementing a National Strategy for Financial Inclusion. The strategy has been prepared by Bank Indonesia, the Ministry of Finance and the National Team for the Acceleration of Poverty Alleviation. It focuses on six pillars: financial education, public financing facilities, financial information mapping, supportive regulations, distribution networks, and intermediation facilities and consumer protection. The strategy particularly targets certain social groups, such as low-income people, women, and people living in rural/disadvantaged areas. The target is for 75% of the population to have access to formal financial institutions by 2019. The National Strategy for Financial Inclusion follows and complements the National Strategy on Financial Literacy, launched in 2013, which also had a chapter on SMEs.
The Financial Services Authority is also particularly active in this field. It has conducted financial education and entrepreneurship training programmes for SMEs through its network of regional Centres for Education, Consumer Services and Financial Access (PELAKU), with 14 of them active in the country in 2017. It has also established the Development Centre for Microfinance and Financial Inclusion (OJK-PROKSI) to give SMEs wider access to financial services, and it has developed an Inclusive Finance Framework (LAKU-PANDAI) which allows banks to offer financial services to customers through the use of mobile and internet banking to better serve remote areas. The latter programme has been rolled out by 18 banks and has reached 3.7 million customers so far through basic savings accounts, microcredit and micro-insurance services. Finally, the Ministry of Finance has recently launched a microcredit programme for firms that are too small to qualify for the KUR Programme.
The innovation system
Indonesia’s spending on R&D is low by international standards, only 0.08% of GDP against the OECD average of 2.5%. By the same token, Indonesian companies tend to register few patents and trademarks and account for only 25% of domestic R&D spending, with the rest undertaken by government, higher education institutions and non-profit organisations.
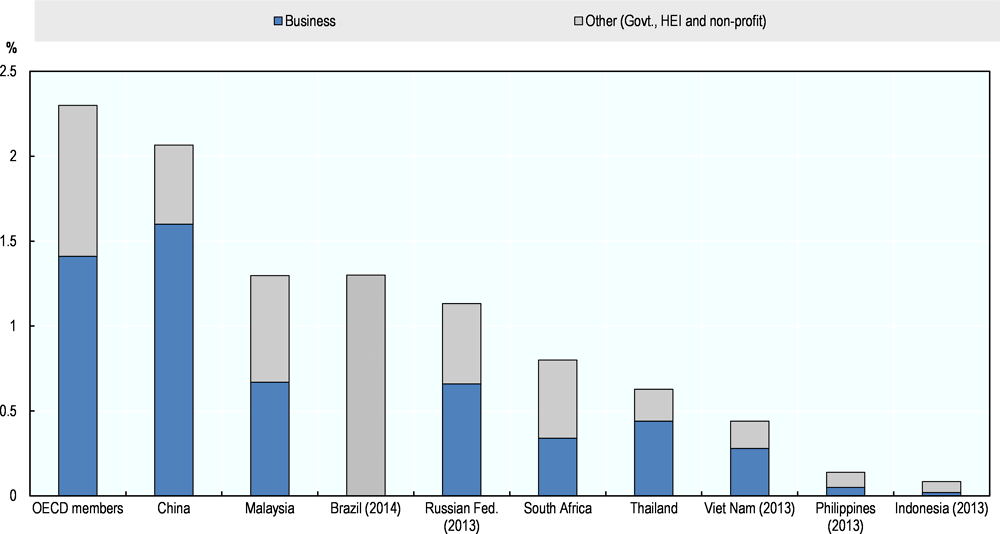
Note: “Other” includes R&D expenditures by government, higher education institutions and non-profit organisations. Data for Indonesia, Viet Nam, South Africa and the Philippines refer to 2013; data for Brazil refer to 2014 and are not differentiated by source of investment. Data for Indonesia, Viet Nam, Malaysia, Thailand and the Philippines are from the World Bank World Development Indicators; data for OECD members, China, Russia, Brazil and South Africa are from the OECD Main Science and Technology Indicator (MSTI) Database.
Source: OECD Main Science and Technology Indicator (MSTI) Database and World Bank World Development Indicators.
The Indonesian government has recently introduced different policies to favour the development of the knowledge economy. The main institutional player is the Ministry of Research, Technology and Higher Education which has launched: i) the National Research Agenda 2015-2019, which primarily aims to encourage industry-university co-operation, for example by enabling researchers to obtain royalties from patents they develop while working for national universities (OECD, 2016c); ii) the Masterplan of National Research 2017-2045, which aims to boost the contribution of the national research system to economic growth; and iii) the National System of Science and Technology which offers regulations on technology transfer, technology audit and technology readiness (Kurniawan, 2016).
Indonesia’s innovation policy mix is mostly geared towards technology consulting services, while fiscal incentives such as competitive grants, vouchers, and R&D tax breaks play a much lesser role (Figure 3.10). The Indonesian government could develop a new R&D tax credit to encourage more business R&D spending, although the design of this policy, as well as monitoring its implementation, would be important to ensure that the measure is not abused. For example, eligible costs should only include costs which are closely related to R&D (e.g. contracts with university and research labs, hiring of researchers and technicians, external consulting and training activities), while excluding investments in machinery and equipment whose link with R&D activity is harder to establish. By the same token, while cash refunds have been used in some OECD countries, in order not to penalise R&D investments in innovative start-ups without taxable income, they should be excluded in the context of Indonesia to rein in the cost of the policy. An example of an R&D tax credit specifically intended for SMEs is presented in Box 3.5.
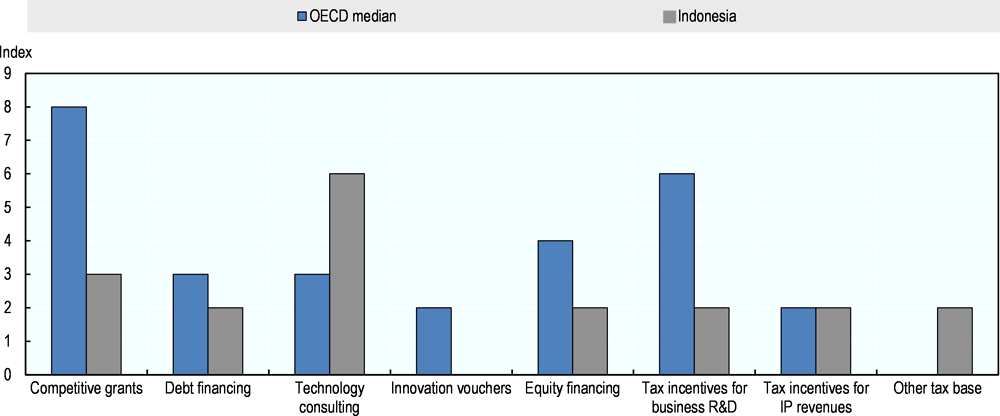
Note: Policy information comes from country responses to the EC/OECD International Survey on STI policies 2016 and 2014. Indonesia's responses are available at EC/OECD International Database on STI Policies, 2016 edition. http://qdd.oecd.org/DATA/STIPSurvey/IDN...STIO_2016
Source: OECD (2016c), OECD Science, Technology and Innovation Outlook 2016, OECD Publishing, Paris, https://doi.org/10.1787/sti_in_outlook-2016-en
Description of the approach
Since 2013 (Loi de finance 2013, art. 71) France has offered a tax credit for SMEs, the CII (Credit d'Impôt Innovation), which allows SMEs (less than 250 employees) to receive tax reductions on expenses related to prototypes or pilot trials of new products. Expenses subject to the tax credit are capped at EUR 400 000 per year and the tax credit rate is 20%, with any unused amount of credit allowed to be carried over for up to three years. Eligible costs include staff costs, intellectual property acquisition, and research contracts to third parties.
Success factors
By supporting prototype development, especially of new products with superior technical performance compared to those available on the market, the programme is particularly suited to encouraging research commercialisation. In addition, by covering only the development phase and not the production phase, the measure is intended to have less distortive effects on the market. Finally, by explicitly targeting, among other criteria, the eco-compatibility of the new products, the CII supports green innovations.
Obstacles and responses
A limitation of CII is that innovations in the services sector and non-technological innovations (e.g. innovations in marketing and business processes) are excluded from the tax credit. As innovation in services can often have an important impact on product innovation in manufacturing, this may limit the effect of the incentive. Another problem is the variety of programmes and incentives to support innovation in France, which makes it difficult for SMEs with limited staff and resources to seize the opportunities offered by the government.
Relevance to Indonesia
The CII offers a model of R&D tax credit specifically for SMEs, whereas R&D tax credits in Indonesia are rather undeveloped. An important element of the French policy is its explicit targeting of new-to-the-market innovations, rather than new-to-the-firm, which ensures stronger additionality and lower fiscal costs of the measure.
Sources for further information
Website of the programme: https://www.entreprises.gouv.fr/politique-et-enjeux/credit-impot-innovation
Indonesian innovation policies have also taken, on occasion, an industry-focus approach. The Ministry of Research, Technology and Higher Education, for example, supports innovation in agri-food, shipbuilding, transport, machinery and textiles (OECD, 2016c). More recently, knowledge-based industries have also started to be prioritised, notably renewable energies through the creation of a government innovation centre and creative industries through the establishment of the Creative Economy Agency (Badan Ekonomi Kreatif, BEKRAF) (see chapter 5).
The Indonesian government has also ramped up spending on its broadband infrastructure. The national Broadband Plan is expected to provide fixed broadband access to all government offices, hotels, hospitals, schools and public spaces by 2019, at a speed of at least 2 Mbit/s. While this is a positive development, it will also be important to expand broadband access to private-sector facilities in order to better reach businesses, including SMEs. Complementary to the development of the broadband infrastructure, the government is also rolling out an E-Commerce Roadmap Strategy that involves several ministries and intends to accelerate the use of e-commerce by SMEs (see chapter 5).
Foreign Direct Investment
In emerging-market economies, foreign direct investment (FDI) is often a major source of capital investment, direct job creation and knowledge spillovers that can benefit local SMEs, especially larger SMEs operating in industries that are suppliers to the sector of the foreign investor (Lembcke and Wildernova, forthcoming).
A large internal market, solid growth prospects, a prudent fiscal framework, abundant natural resources and a relatively low labour cost are some of the main assets which Indonesia offers to foreign investors (Hornberger et al., 2011). Despite these clear assets, FDI inflows to Indonesia over the last ten years (relative to national GDP), albeit sustained, have not been as large as in some other BRICS (e.g. Brazil and China) and ASEAN countries (e.g. Malaysia, Thailand and Vietnam) (OECD, 2016a) (Figure 3.11).
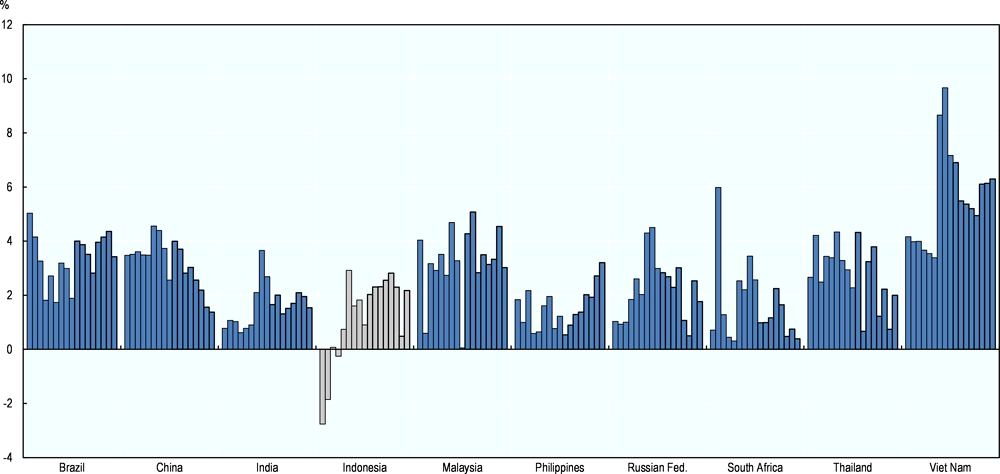
Source: International Monetary Fund, International Financial Statistics and Balance of Payments databases; World Bank, International Debt Statistics; and World Bank and OECD GDP estimates https://data.worldbank.org/indicator/BX.KLT.DINV.WD.GD.ZS?locations=BR-CN-IN-ID-MY-PH-RU-ZA-TH-VN
Regulatory restrictions explain in part the untapped FDI potential of Indonesia. The OECD FDI Regulatory Restrictiveness Index collates the main regulations (e.g. foreign equity limits, screening and approval procedures, restrictions on key foreign personnel, and other operational measures) that may hinder the inflow of FDI at the national level. As shown in Figure 3.12, Indonesia has stricter FDI regulatory restrictions than both the OECD average and the ASEAN-9 average (which does not include Brunei Darussalam) (OECD, 2018b). In particular, among ASEAN economies, only the Philippines has stricter FDI restrictions than Indonesia.
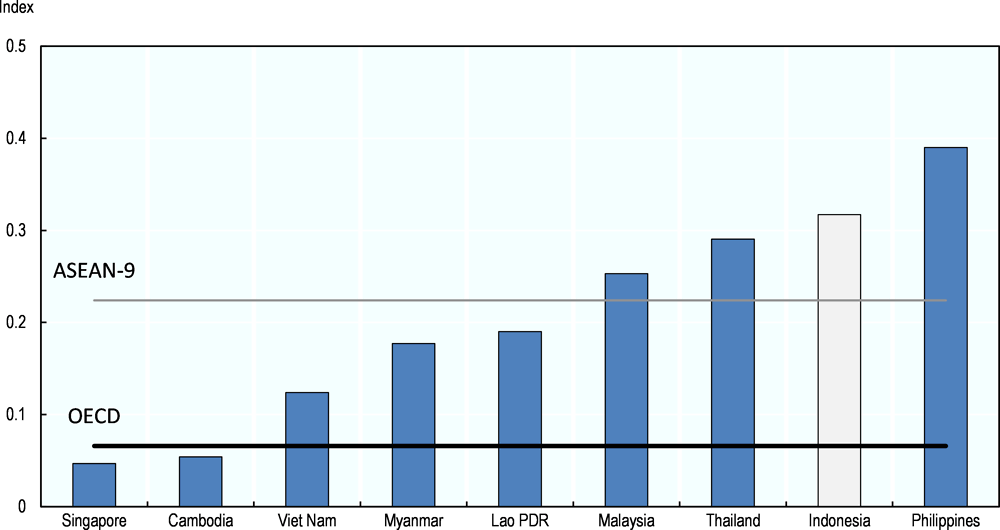
Notes: The OECD FDI Regulatory Restrictiveness Index covers only statutory measures discriminating against foreign investors (e.g. foreign equity limits, screening and approval procedures, restrictions on key foreign personnel, and other operational measures). Other important aspects of an investment climate (e.g. the implementation of regulations and state monopolies) are not considered. Data for Thailand and Singapore refer to 2016. ASEAN-9 is Cambodia, Indonesia, Lao PDR, Malaysia, Myanmar, Philippines, Singapore, Thailand and Viet Nam.
Source: OECD FDI Regulatory Restrictiveness Index database.
Inward FDI also benefits from trade liberalisation in services. By way of example, logistics and financial services are key to the effective functioning of global supply chains. As a consequence, being able to tap freely into these global services from any location influences the investment choice of multinational companies.
The OECD Service Trade Restrictiveness Index (STRI) calculates service trade barriers in 22 sectors across 44 countries, representing over 80% of global service trade. In all 22 sectors considered, Indonesia exceeds the average restrictiveness of the 44 countries (35 OECD countries plus 9, including the 5 BRICS). The main underlying cause is “general regulations which apply to all sectors of the economy” rather than sector-based regulations, including: i) management positions in Indonesian corporations reserved to Indonesian nationals; ii) price preferences given to national companies in public procurement; iii) acquisition of land and real estate by foreigners restricted to the right of use for a limited number of years; and iv) restrictions to the movement of people. The most restrictive sectors in Indonesia are insurance, legal services and distribution, while the least restrictive are sound recording, rail freight and air transport (Figure 3.13).

Note: The STRI indices take values between zero and one, one being the most restrictive. They are calculated using the STRI regulatory database which contains information on regulation for the 37 OECD member countries, Brazil, China, Costa Rica, India, Indonesia, Russian Federation and South Africa. “Average” is calculated over 44 countries (37 OECD countries plus 7, including the 5 BRICS); “minimum” is the lowest value by area of regulation among the 44 countries (the least restrictive).
Source: OECD Service Trade Restrictiveness Index (STRI) database.
In May 2016, a Presidential Regulation revised the “Negative Investment List”, the list of sectors with limitations to foreign ownership, removing 45 sectors from it (e.g. department stores, internet service providers, etc.). Nonetheless, the regulation still organises industries into six different investment categories:
-
Reserved for or subject to partnerships with local MSMEs or co-operatives (Koperasi) through a mutual agreement;
-
With limitation to foreign ownership;
-
With location requirements;
-
With special licensing requirements;
-
Reserved 100% to domestic ownership;
-
With higher allowed foreign ownership for companies from ASEAN countries.
Therefore, although Indonesia has fully or partially opened a number of new sectors to foreign investment in recent years, many restrictions still apply to a relatively large range of sectors. Furthermore, the existence of six different investment categories is likely to make the system difficult to navigate for some foreign investors, especially smaller ones which have been found to be more likely to engage in contractual relationships with local suppliers (Dimelis and Louri, 2004).
With the aim to stimulate inward FDI, the Indonesia Investment Co-ordinating Board (Badan Koordinasi Penanaman Modal – BKPM), has recently developed an “Investment One-Stop” online service to reduce the length of the foreign investment process, i.e. the time between application by foreign investors and response by the government, which in the past could take up to 24 months (OECD, 2016c). Furthermore, in collaboration with the Ministry of Finance, the BKPM can grant tax breaks (i.e. reduction in net income tax of up to 30% of the amount invested, accelerated depreciation and losses which can be carried forward for up to ten years) when the investment meets one of the following criteria: high investment value, export orientation, high absorption of manpower, or high local content.
Moving forward, FDI tax incentives could become more tailored to the development of local suppliers. For example, the government could introduce tax breaks for foreign investors who invest in the upgrading of local suppliers through training, mentoring or staff secondment programmes. Malaysia and Singapore have already used this policy in the ASEAN region with generally positive results (see Box 3.6) (OECD, 2018b).
Malaysia and Singapore offer two examples of ASEAN countries that support FDI-SME linkages through tax incentives. In Malaysia, under the Industrial Linkage Programme, investors can claim tax deductions for costs involved in providing support to local suppliers, including training, product development and testing, and factory auditing to ensure the quality of local suppliers. A Global Supplier Programme also offers financial and organisational support to multinational enterprises, if specialists from their foreign affiliates are seconded to local firms (for up to two years).
Singapore’s Local Industry Upgrading Programme had a similar design, but it has now been replaced by the Pioneer Certificate Incentive and the Development and Expansion Incentive. These two tax incentives offer corporate tax exemption or a reduced concessionary tax rate on eligible income if the multinational enterprise sets up locally upstream and downstream activities previously conducted internally. The aim of the programme is to foster technology transfers and the scale-up of local businesses.
Source: OECD (2018b), OECD Investment Policy Reviews: Southeast Asia, OECD Publishing, Paris. http://www.oecd.org/daf/inv/investment-policy/Southeast-Asia-Investment-Policy-Review-2018.pdf
Conclusions and policy recommendations
Indonesia’s business environment offers mixed conditions for the development of SMEs and entrepreneurship. Macroeconomic conditions are generally healthy and include a stable political system and a prudent fiscal policy framework, although Indonesia’s tax base is low by international standards and affected by the large informal sector. Employment and education statistics point to skills gaps in the Indonesian labour market, which should be addressed through improved spending on education, including on vocational education and training.
Indonesia has made significant progress in the “ease of doing businesses”. However, the business license system should be further streamlined through better co-ordination between the different levels of government involved in the issue of licenses and permits and through moving forward existing plans for the digitalisation of the overall system. Attention also needs to be paid to the design of the national tax system to enlarge the national tax base and to ensure that small business tax preferences do not have the unintended effect of discouraging business growth.
SME access to finance has been boosted by a number of regulatory reforms, not least the obligation for commercial banks to earmark 20% of their business loans for SMEs. When compared to OECD countries the 20% set-aside target appears realistic, although it should be monitored against the credit market conditions of Indonesia to ensure that it does not lead to a rise in non-performing loans and to reduced competition by forcing out of the market types of banks that are traditionally less inclined to working with SMEs. Much is also being done in Indonesia to diversify the sources of finance for SMEs, although results are still relatively modest due to the limited number of domestic SMEs ready to use these sources.
Indonesia also needs to spend more on its national innovation system if its productivity growth objectives are to be met (see chapter 2). Traditional innovation policy instruments such as R&D tax credits are not widely available in Indonesia, hindering the development of business R&D.
Finally, Indonesia has a strong potential to attract FDI, which can benefit domestic SMEs through the development of local supplier linkages. However, such potential is only partially exploited due to regulatory restrictions to FDI and trade in services.
Based on the analysis in this chapter, the following recommendations are put forward to strengthen the business environment for SMEs and entrepreneurship in Indonesia.
-
Simplify regulatory protection in the labour market with the aim to reduce the size of the informal sector and to favour the scale-up of existing businesses. Possible pilot measures could include simpler procedures and circumstances for individual dismissals, the replacement of the high severance pay with a form of government-backed unemployment insurance and quarterly payments (instead of monthly payments) of social contributions for small firms (OECD, forthcoming).
-
Improve literacy and numeracy skills in the labour force, a precondition for on-the-job training and skills development, by increasing participation rates in secondary and tertiary education and by strengthening efficiency in public spending on education (e.g. through an improvement in teacher competencies).
-
Reform the existing VET system by strengthening dialogue and collaboration between private-sector companies and schools in VET provision and by increasing the proportion of teachers who also have an industry, rather than only academic, background.
-
Move forward with current plans to integrate (across levels of government) and digitalise the national business license and permit system, drawing inspiration from consolidated international good practices in this field.
-
Lower the income threshold (currently set at IDR 4.8 billion) to which the special 0.5% turnover-based business tax rate currently applies to better target micro-enterprises. Consider combining this tax measure with additional support in terms of access to book-keeping assistance and to government support programmes for enterprises that join this tax regime.
-
Improve tax collection by investing in the tax administration system, particularly staff, electronic services and databases; using technology to strengthen monitoring and detect non-compliance, including through the use of risk-based assessments for conducting tax audits; and building capacity at the subnational level through training (OECD, forthcoming).
-
Monitor the implementation of SME loan set-asides in commercial banks to ensure that they do not result in a rise in non-performing loans and/or in reduced competition in the banking sector.
-
Apply international good-practice principles to the work of public and private credit bureaus and consider extending collateral registries to moveable assets (beyond fixed assets) to reduce information asymmetries in credit markets and boost SME lending.
-
Strengthen junior equity markets through the scale-up of existing investment readiness programmes for medium-sized firms and growth-oriented SMEs.
-
Strengthen R&D tax credits to encourage more R&D spending in SMEs while paying attention to the design and implementation of this policy to ensure that it is not abused, for example carefully considering which eligible costs to include.
-
Continue to support the development of broadband infrastructure, making sure that it reaches not only government offices but also private-sector premises, including SMEs.
-
Simplify the current FDI negative investment list by reducing the number of investment categories and opening up more sectors to foreign direct investment.
-
Open up more domestic services sectors to international trade with a view to attracting more FDI and improving Indonesia’s performance in the OECD Service Trade Restrictiveness Index (STRI).
-
Develop stronger FDI-SME relationships, including through tax incentives for multinational companies that invest in the upgrading of local suppliers through training, mentoring or staff secondment.
References
Dimelis, S. and H. Louri (2004), “Foreign direct investment and technology spillovers: Which firms really benefit?”, Review of World Economics, Vol. 140, No. 2, pp. 230-253, https://doi.org/10.1007/BF02663647.
Hornberger, K., J. Battat and P. Kusek (2011), Attractive FDI: How Much Does Investment Climate Matter?, Viewpoint: Public Policy for the Private Sector, Note No. 327, World Bank, Washington DC.
ILO (International Labour Office) (2016), Indonesia Labour Market Outlook, Geneva.
Indonesia Investment (2017), Tax System of Indonesia, https://www.indonesia-investments.com/finance/tax-system/item277?
Kurniawan, E. (2016), Science, Technology and Innovation Policies – A Progress from Indonesia, US Mission to ASEAN, https://asean.usmission.gov/innovasean_20170124/
Lembcke, A. and L. Wildernova (forthcoming), “Does FDI benefit incumbent SMEs? FDI spillovers and competition effects at the local level”, OECD Publishing.
OBG (Oxford Business Group) (2017), “Indonesia recruits industry leaders to strengthen vocational education”, http://www.oxfordbusinessgroup.com/news/indonesia-recruits-industry-leaders-strengthen-vocational-education.
OECD (forthcoming), OECD Economic Surveys: Indonesia 2018, OECD Publishing, Paris.
OECD (2018a), Financing SMEs and Entrepreneurs 2018: An OECD Scoreboard, OECD Publishing, Paris, https://doi.org/10.1787/fin_sme_ent-2018-en.
OECD (2018b), OECD Investment Policy Reviews: Southeast Asia, OECD Publishing, Paris, http://www.oecd.org/investment/oecd-investment-policy-review-southeast-asia.htm.
OECD (2017a), Education at a Glance 2017: OECD Indicators, OECD Publishing, Paris, https://doi.org/10.1787/eag-2017-en.
OECD (2017b), SME and Entrepreneurship Policy in Canada, OECD Publishing, Paris, https://doi.org/10.1787/9789264273467-en.
OECD (2016a), OECD Economic Surveys: Indonesia 2016, OECD Publishing, Paris, https://doi.org/10.1787/eco_surveys-idn-2016-en.
OECD (2016b), Skills Matter: Further Results from the Survey of Adult Skills, OECD Skills Studies, OECD Publishing, Paris, https://doi.org/10.1787/9789264258051-en.
OECD (2016c), OECD Science, Technology and Innovation Outlook 2016, OECD Publishing, Paris, https://doi.org/10.1787/sti_in_outlook-2016-en.
OECD (2015), Taxation of SMEs in OECD and G20 Countries, OECD Tax Policy Studies, No. 23, OECD Publishing, Paris, https://doi.org/10.1787/9789264243507-en.
OECD (2013), Mexico: Key Issues and Policies, OECD Studies on SMEs and Entrepreneurship, OECD Publishing, Paris, https://doi.org/10.1787/9789264187030-en.
OECD (2012), OECD Economic Surveys: Indonesia 2012, OECD Publishing, Paris, https://doi.org/10.1787/eco_surveys-idn-2012-en.
OECD/ADB (2015), Education in Indonesia: Rising to the Challenge, Reviews of National Policies for Education, OECD Publishing, Paris, https://doi.org/10.1787/9789264230750-en.
PWC (Price Waterhouse Cooper) (2017), Indonesia Corporate Tax Credits and Incentives, http://taxsummaries.pwc.com/ID/Indonesia-Corporate-Tax-credits-and-incentives.
Rothenberg, A., A. Gaduh, N. Burger, C. Chazali, I. Tjandraningsih, R. Radikun, C. Sutera and S. Weilant (2016), “Rethinking Indonesia’s informal sector”, World Development, Vol. 80, pp. 96-113, 10.1016/J.WORLDDEV.2015.11.005.
World Bank (2017a), Indonesia Economic Quarterly March 2017: Staying the Course, World Bank, Indonesia office, Jakarta, http://pubdocs.worldbank.org/en/278631490090358078/IEQ-MAR-2017-ENG.pdf.
World Bank (2017b), Doing Business 2017, World Bank, Washington DC, http://www.doingbusiness.org/~/media/WBG/DoingBusiness/Documents/Annual-Reports/English/DB17-Report.pdf.
World Bank (2015), World Bank Enterprise Survey - Indonesia, World Bank, Washington DC, http://microdata.worldbank.org/index.php/catalog/2665.
World Bank (2011), General Principles for Credit Reporting, World Bank, Washington DC.
Notes
← 1. Government Regulation No. 46 of 2013
← 2. Bank Indonesia uses the SME definition of Law 20/2008 (see chapter 2). Thus, SME loans are loans to companies that have net assets below IDR 10 billion (not including land and buildings) or annual revenues below IDR 50 billion.
← 3. The sectors are: upstream metal; oil refinery industry and/or infrastructure, including those under the Public Private Partnership (PPP) scheme; base organic chemicals sourced from oil and gas; machinery; telecommunication and information; sea transportation; processing industry for agriculture, forestry, and fishery products; economic infrastructure other than those under the PPP scheme.