copy the linklink copied! Chapter 3. Who sits the PISA assessment?
This chapter describes the students in the PISA target population, or those who were eligible to sit the PISA assessment. It discusses the extent to which this target population represented (or covered) the total population. The chapter also presents the grade distribution of the students who participated in the assessment.
-
Over 97 % of 15-year-olds in Brunei Darussalam, Germany, Hong Kong (China), Malta and Slovenia were represented in the PISA sample. However, less than 80 % of the total population of 15-year-olds were represented in 19 of the 79 PISA-participating education systems, of which 3 were OECD countries.
-
In most PISA-participating education systems, 15-year-old students were most commonly enrolled in grade 10 at the time of the assessment.
copy the linklink copied! Who is the PISA target population?
PISA 2018 assessed the cumulative outcomes of education and learning at a point at which most children are still enrolled in formal education: the age of 15. In particular, PISA assessed students who were aged between 15 years and 3 (complete) months and 16 years and 2 (complete) months1 at the time of the assessment.2 This was done so that students could be compared across countries shortly before they are faced with decisions about major life choices, such as entering the workforce or pursuing further education. Students at the same grade level could have been selected instead, but differences in the institutional nature of education systems (e.g. the age at entry into pre-primary school and into formal schooling; grade-retention policies; and even whether the meaning of grades is equivalent across countries) make it more difficult to make a fair comparison about how prepared students are for life post-school.3
The 15-year-olds in the PISA sample must also have been enrolled in an educational institution4 at grade 7 or higher. All such students were eligible to sit the PISA assessment, regardless of the type of educational establishment in which they were enrolled and whether they were enrolled in full-time or part-time education.
copy the linklink copied! How many 15-year-olds does the PISA sample represent?
Not all of the students who were eligible to sit the PISA assessment were actually assessed. A two-stage sampling procedure first selected a representative sample of at least 150 schools, taking into account factors such as location (state or province; but also whether the school is located in a rural area, town or city) and level of education (lower secondary or upper secondary school). Then, in the second stage, roughly 42 15-year-old students were selected from each school to sit the assessment.5 In PISA 2018, most countries assessed between 4 000 and 8 000 students.6
Students selected to sit the PISA assessment were assigned sampling weights so as to represent the entire PISA-eligible cohort. However, some otherwise-eligible 15-year-old students enrolled in grade 7 or above could be excluded for various reasons, including the remoteness and inaccessibility of their school, intellectual or physical disability, a lack of proficiency in the test language, or a lack of test material in the language of instruction.
Figure I.3.1 shows the proportion of 15-year-olds in each country/economy who were covered by the PISA sample, also known as Coverage Index 3. It ranged from over 99 % in Germany, over 98 % in Hong Kong (China), and over 97 % in Brunei Darussalam, Malta and Slovenia, to under 50 % in Baku (Azerbaijan) and under 60 % in Jordan and Panama. This proportion exceeds 80 % in most OECD countries; only Colombia (62 %), Mexico (66 %) and Turkey (73 %) did not reach this level (Table I.A2.1).7
In most countries, low values of Coverage Index 3, which is based on verified (rather than on reported) enrolment, can be attributed to 15-year-olds who were no longer enrolled in school or who had been held back in primary school. Coverage Index 3 may also have been lower due to student exclusions from the test and dropout during the school year. For example, in Colombia, official enrolment rates indicate that 75 % of 15-year-olds were enrolled in grade 7 or above while Coverage Index 3 indicates that only 62 % of 15-year-olds were eligible to sit the PISA test.
The exclusion of students and schools generally has a limited impact on Coverage Index 3. The overall exclusion rate of students enrolled in school was less than 1 % in 14 of the 79 education systems that participated in PISA 2018 (of which 11 were partner countries and economies); this rate exceeded 5 % in only 16 education systems (of which 14 were OECD countries) (Figure I.3.2 and Table I.A2.1). Further information was sought for all countries/economies in which the exclusion rate exceeded 5 %. In all cases, it was found that there were no significant biases to the results in reading, mathematics and science because over 5 % of students had been excluded and the data were deemed to be acceptable. Results for these education systems are still comparable across education systems and across PISA cycles. Please see Annex A2 for country-specific details.

Countries and economies are ranked in descending order of coverage.
Source: OECD, PISA 2018 Database, Table I.A2.1.
Access to schooling is a prerequisite for achieving equity in education. As discussed in Chapter 1 of PISA 2018 Results (Volume II): Where All Students Can Succeed (2019[1]), PISA 2018 considered two dimensions of equity: inclusion and fairness. PISA defines inclusion in education as ensuring that all students attain essential foundational skills; it relates fairness to the distribution of opportunities to acquire a quality education and, more specifically, to the degree to which background circumstances are related to students’ education outcomes. While enrolling all 15-year-olds in school does not guarantee that every student will acquire the skills needed to thrive in an increasingly knowledge-intensive economy, it is the first step towards building a more inclusive and fairer education system.
Students who have already left formal schooling by the age of 15 are more likely to be cognitively weaker than those who remain at school (Spaull and Taylor, 2015[2]; Taylor and Spaull, 2015[3]; Hanushek and Woessmann, 2008[4]). Therefore, the performance of the 15-year-old cohort in an education system is likely to be overestimated if PISA results are not considered in the context of coverage, and the extent of this overestimation is likely to increase as the coverage decreases. Chapter 9 relates changes in PISA scores in a country/economy with changes in the coverage of its 15-year-old cohort.
Coverage of the 15-year-old cohort has increased in many countries since earlier PISA assessments (see Chapter 9 and Table I. A2.2). Between 2003 and 2018, Indonesia added almost 1.8 million students, and Mexico and Turkey more than 400 000 students, to the total population of 15-year-olds eligible to participate in PISA. Uruguay and Brazil also increased the number of 15-year-olds eligible to participate in PISA, despite having a smaller population of 15-year-olds in 2018 than in 2003. As a result, PISA coverage – the number obtained by dividing the number of PISA-eligible students by the total number of 15-year-olds in a country – increased greatly in all five countries as well as in Albania, Costa Rica and Lebanon.8 This might reflect the expansion of schooling to previously underserved communities, especially in developing countries, and could be indicative of progress towards the United Nations Sustainable Development Goal for quality education in these countries (see Chapter 10).9
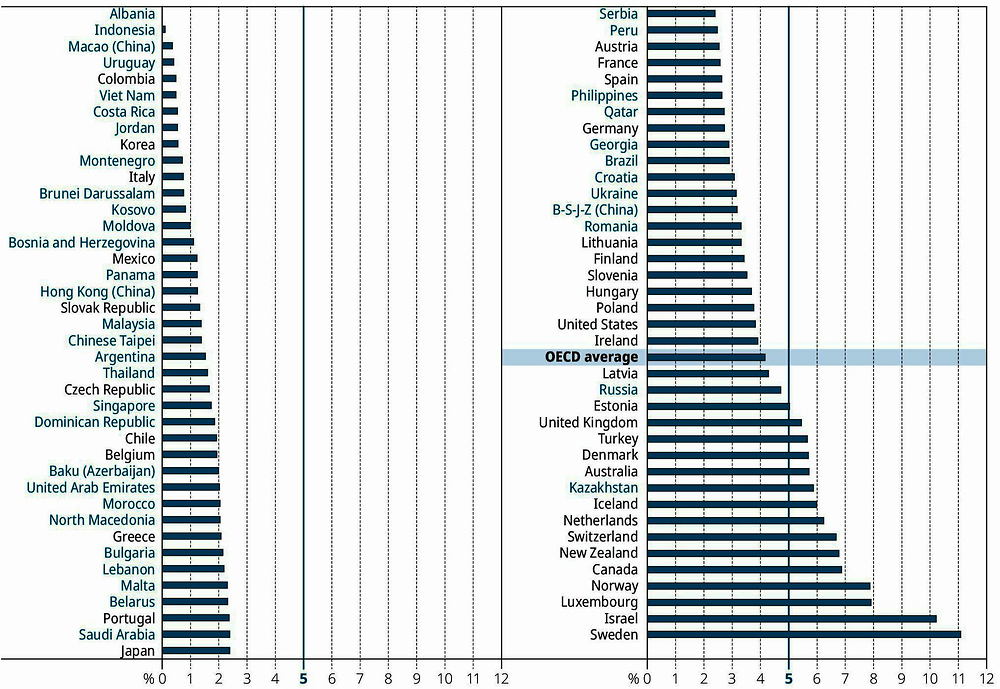
Note: The vertical blue line corresponds to the 5 % exclusion limit. All countries/economies that exceeded this threshold were required to provide documentation to ensure that the exclusions did not affect the comparability of their results with those from other countries/economies.
Countries and economies are ranked in ascending order of the overall exclusion rate.
Source: OECD, PISA 2018 Database, Table I.A2.1.
However, a large decrease in coverage was observed in some countries too, particularly in Jordan (by about 20 percentage points since 2006 and 2009, when it first participated in PISA). In Jordan, the population of 15-year-olds represented by PISA increased by about 25 000 since 2006, but the total population of 15-year-olds grew by about 90 000, largely as a result of the massive influx of refugees from neighbouring countries.10 The influx of immigrant and refugee students into Sweden since 2015 also resulted in a marked increase in exclusions (by 5 percentage points) and a large drop in Coverage Index 3 (by 8 percentage points).
copy the linklink copied! The distribution of PISA students across grades
As alluded to above, students in different countries start formal schooling at different ages. In addition, differences in grade-retention policies and inconsistencies in school attendance mean that students can progress through school differently. Students in some countries automatically move on to the next grade each year regardless of performance, while students in other countries can be held back to repeat a year or may simply not attend school for a year or more, delaying their progress through the school system.11
Hence, 15-year-old students show different distributions across grade levels in different countries. In Brazil, Malta, New Zealand and the United Kingdom, the modal grade, or the grade in which 15-year-old students are most commonly found, is grade 11 (Table I.3.1); in the latter three countries, roughly 90 % (or more) of students are enrolled in grade 11. These are countries in which students enter primary school at an earlier age. Grade 9 is the modal grade in 21 countries and economies – often the countries where students start formal schooling at a later age. Grade 10 is the modal grade in the remaining 53 PISA-participating countries and economies.
Almost 100 % of students in three countries, Iceland, Japan and Norway, were enrolled in grade 10 at the time they sat the PISA test, which reflects the lack of grade retention and grade advancement in these countries, and the alignment between the PISA testing period and the cut-off dates for school enrolment (Figure I.3.3). In contrast, students in Brazil, Colombia, the Dominican Republic and Morocco were dispersed over a wide range of grade levels. Dispersion over two consecutive grade levels may be due to a misalignment between the PISA testing period and the cut-off date for school enrolment, or to a certain degree of flexibility over when children can enter formal schooling. However, in many of these countries, the wide range of distribution observed in the aforementioned education systems often reflects inconsistencies in school attendance. In these (mostly developing) countries, some students may miss a year of school because they are unable to pay school fees; when they return to school, they will necessarily be one (or more) grades behind students whose education was not interrupted. Similarly, their parents may keep them home occasionally to help out with other tasks. In these cases, students’ performance might be judged to be insufficient to move on to the next grade if the students had missed too many days of school, and they may be required to repeat their current grade. By the age of 15, such students may be found in a wide range of grade levels.
By using age, rather than grade level, as the criterion for students’ eligibility to sit the assessment, PISA enables a standardised comparison of the skills of students who are soon to enter adult life. However, these students may be at different points in their educational career – both between and within countries. PISA cannot capture students’ progress through further education after the age of 15; students who appear to be behind today, based on their performance in the PISA assessment, may well catch up with their peers in the future.

Countries and economies are ranked in ascending order of the average grade level of their 15-year-old student population.
Source: OECD, PISA 2018 Database, Table I.A2.8.
References
[4] Hanushek, E. and L. Woessmann (2008), “The Role of Cognitive Skills in Economic Development”, Journal of Economic Literature, Vol. 46/3, pp. 607-668, https://doi.org/10.1257/jel.46.3.607.
[1] OECD (2019), PISA 2018 Results (Volume II): Where All Students Can Succeed, PISA, OECD Publishing, Paris, https://doi.org/10.1787/b5fd1b8f-en.
[2] Spaull, N. and S. Taylor (2015), “Access to What? Creating a Composite Measure of Educational Quantity and Educational Quality for 11 African Countries”, Comparative Education Review, Vol. 59/1, pp. 133-165, https://doi.org/10.1086/679295.
[3] Taylor, S. and N. Spaull (2015), “Measuring access to learning over a period of increased access to schooling: The case of Southern and Eastern Africa since 2000”, International Journal of Educational Development, Vol. 41, pp. 47-59, https://doi.org/10.1016/j.ijedudev.2014.12.001.
Notes
← 1. More precisely, PISA assessed students who were at least 15 years and 3 (complete) months old and who were at most 16 years and 3 (complete) months old (i.e. younger than 16 years, 2 months and roughly 30 days old), with a tolerance of one month on each side of this age window. If, as was the case in most countries, the PISA assessment was conducted in April 2018, all students born in 2002 would have been eligible. For simplicity, students aged between 15 years and 3 (complete) months and 16 years and 2 (complete) months are, in this report, referred to as being 15 years old.
← 2. The month of birth of a cohort that is eligible to sit the PISA test varies over the range of an entire year.
← 3. Fifteen-year-old students in different countries will have had different numbers of years of formal schooling. However, it is assumed that, in countries where entry into formal schooling takes place at an older age, children are still educated before they enter formal schooling, either at home or in various pre-school programmes. This should mitigate, to some extent, the disadvantage that students in these countries may face by not having attended formal schooling for as many years as students in other countries. This also contrasts with other large-scale international assessments that select students by grade level in order to measure the extent to which students master certain aspects of the curriculum. In those assessments, students in countries with a later age at entry into formal schooling are older and will typically have an advantage over students in other countries.
← 4. Educational institutions are generally referred to as schools in this publication, although some educational institutions (in particular, some types of vocational education establishments) may not be referred to as schools in certain countries.
← 5. In schools with fewer than 42 15-year-old students, all 15-year-old students in the school were selected. Countries where schools tended to have fewer than 42 students per age group could opt for a sampling design with a smaller number of students sampled per school (e.g. 30), but had to increase the overall number of schools sampled proportionately.
← 6. Larger numbers of students sat the PISA assessment in countries whose subnational regions were also extensively sampled. This was the case, for example, in Canada (over 22 000 participating students) and Spain (almost 36 000 participating students). In smaller education systems, almost all eligible students and schools were sampled in order to meet the criterion for sample size.
← 7. Data for an education system come from multiple sources that might not be consistent with one another, introducing error into the calculation of coverage indices. The total population of 15-year-olds is typically based on demographic projections from census and registry data; the total population of 15-year-old students may be based on central school registries or on household surveys; and the national desired target population (the PISA-eligible students that the PISA sample aims to represent) is based on school-enrolment estimates (for all schools) provided by the national PISA centre and on student lists provided by the sampled schools. As one example of this inconsistency, the data paradoxically show that in Brunei Darussalam, Canada, Malta and Slovenia, more students were eligible to sit the PISA assessment than were 15-year-old students in grade 7 and above, according to central school registries or household surveys.
← 8. Coverage Index 3 also increased by about 26 percentage points in Argentina between 2015 and 2018. The low values of Coverage Index 3 in 2015 are due to a statistical anomaly (incomplete school sampling frames); as a result, Argentina’s results for 2015 are not comparable to those of other countries or to results for Argentina from previous years or for 2018.
← 9. Improvements in data-collection procedures may also have led to changes in the reported proportion of 15-year-olds covered by the PISA sample, although the direction of the impact of such improvements is unclear.
← 10. The decrease in the coverage of 15-year-olds in Jordan is likely a result of the ongoing refugee crises in neighbouring countries. Refugee children may be enrolled outside of the country’s formal education system, in which case they would not be sampled by PISA.
← 11. In addition to grade-retention policies, certain education systems permit accelerated advancement through the school system.
Metadata, Legal and Rights
https://doi.org/10.1787/5f07c754-en
© OECD 2019
The use of this work, whether digital or print, is governed by the Terms and Conditions to be found at http://www.oecd.org/termsandconditions.