
Ireland
This country note provides an overview of the key characteristics of the education system in Ireland. It draws on data from Education at a Glance 2023. In line with the thematic focus of this year’s Education at a Glance, it emphasises vocational education and training (VET), while also covering other parts of the education system. Data in this note are provided for the latest available year. Readers interested in the reference years for the data are referred to the corresponding tables in Education at a Glance 2023.
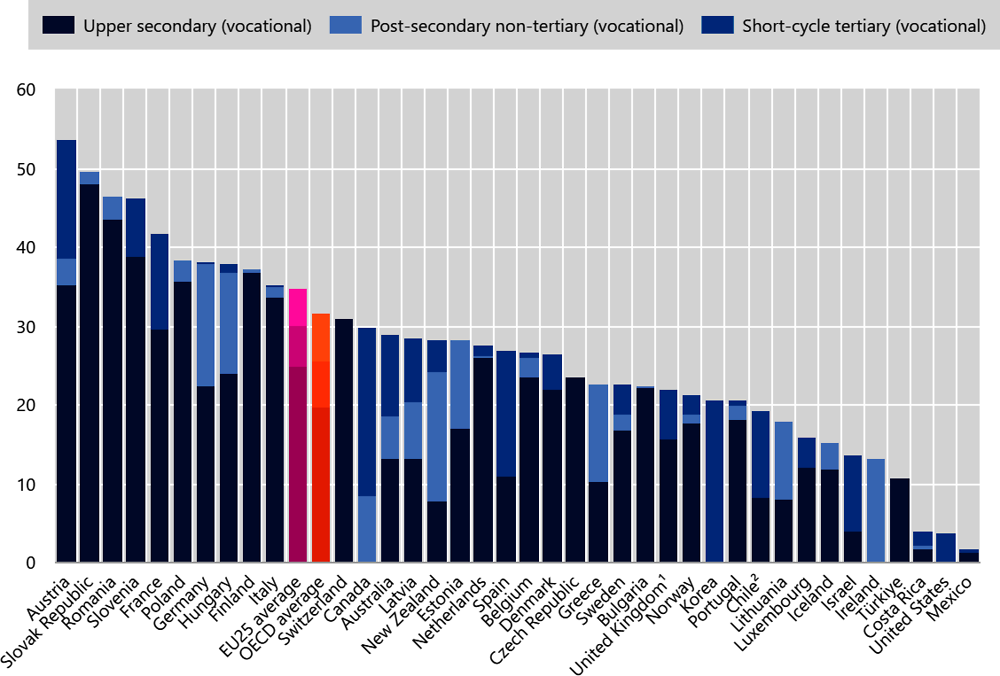
High-quality VET programmes integrate learners into labour markets and open pathways for further personal and professional development. However, the quality and importance of VET programmes differ greatly across countries. In some countries, half of all young adults (25-34 year-olds) have a vocational qualification as their highest level of educational attainment, while the share is in the low single digits in other countries. In Ireland, 13% of 25-34 year-olds have a VET qualification at post-secondary non-tertiary level as their highest level of attainment (Figure 1).
Across the OECD, unemployment rates for 25-34 year-olds with vocational upper secondary attainment are lower than for their peers with general upper secondary or post-secondary non-tertiary attainment. This is also the case in Ireland, where 6.4% of young adults with vocational upper secondary attainment are unemployed, compared to 8% of those with general upper secondary attainment.
Although an upper secondary qualification is often the minimum attainment needed for successful labour-market participation, some 25-34 year-olds still leave education without such a qualification. On average across the OECD, 14% of young adults have not attained an upper secondary qualification. In Ireland, the share is lower than the OECD average (5%).
Tertiary attainment continues to increase among the working age population. On average across the OECD, tertiary attainment is becoming as common as upper secondary or post-secondary non-tertiary attainment among 25-64 year-olds. In Ireland, 54% of 25-64 year-olds have tertiary attainment, a larger share than those that have upper secondary or post-secondary non-tertiary attainment (33%).
On average across OECD countries, 14.7% of young adults aged 18-24 are not in education, employment or training (NEET), while in Ireland the corresponding figure is 9.3%. Reducing NEET rates among young adults is a particularly important challenge in all countries because those who become NEET face worse labour-market outcomes later in life than their peers who remained in education or training at this age.
1. Data for upper secondary attainment include completion of a sufficient volume and standard of programmes that would be classified individually as completion of intermediate upper secondary programmes (9% of adults aged 25-34 are in this group).
2. Year of reference differs from 2022. Refer to the source table for more details.
Countries are ranked in descending order of the share of 25-34 year-olds who attained vocational upper secondary, vocational post-secondary non-tertiary or vocational short-cycle tertiary education.
Source: OECD (2023), Table A1.3. For more information see Source section and Education at a Glance 2023 Sources, Methodologies and Technical Notes (OECD, 2023[1]).
As the demand for skills in the workplace changes ever more quickly, the importance of lifelong learning continues to grow. In Ireland, the share of adults who participated in non-formal job-related education over a four-week reference period is 3% among 25-64 year-olds with vocational upper secondary or post-secondary non-tertiary attainment, 2% among those with general upper secondary attainment and 6% among those with tertiary attainment. This compares to average shares of 7% (vocational upper secondary or post-secondary non-tertiary attainment), 7% (general upper secondary or post-secondary non-tertiary attainment) and 14% (tertiary) across the OECD.
Participation in high-quality early childhood education (ECE) has a positive effect on children’s well-being, learning and development in the first years of their lives. In Ireland, 6% of 2-year-olds are enrolled in ECE. This increases to 88% of 3-year-olds, 80% of 4-year-olds and 3% of 5-year-olds (most children in Ireland start primary education at age 5).
Compulsory education in Ireland starts at the age of 6 and continues until the age of 16. Students typically graduate between the ages of 17 and 18 from general upper secondary programmes. The age range for completing vocational programmes is wider, with students typically graduating from vocational upper secondary programmes between 18 and 25. This is similar to most OECD countries, where graduates from vocational upper secondary programmes have a wider age range, reflecting the greater diversity of pathways into these programmes than for general ones.
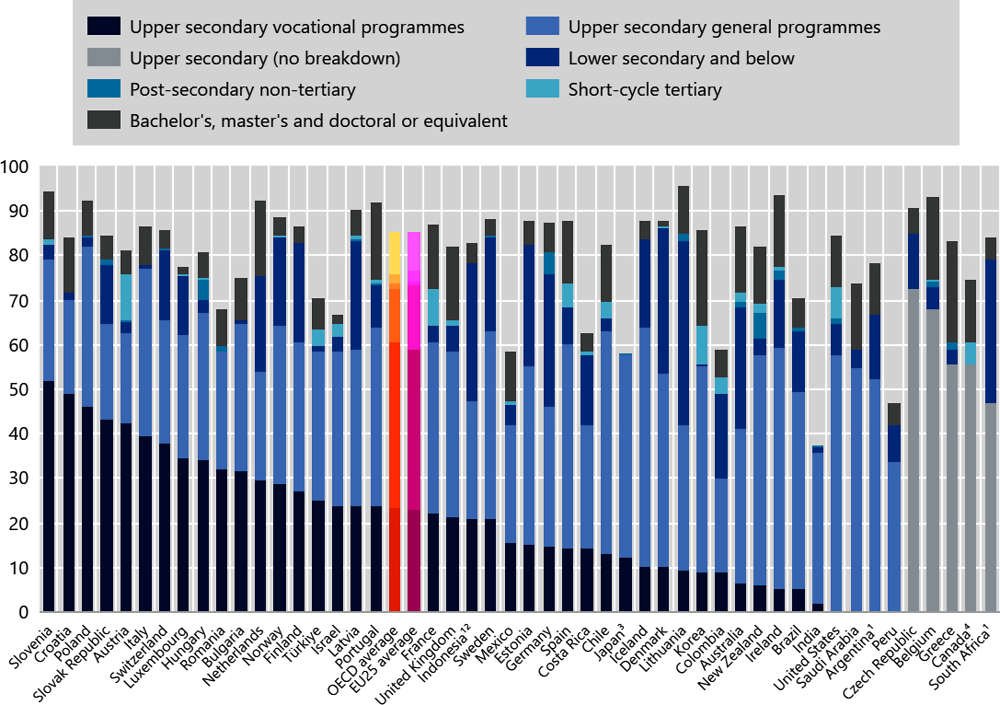
The large majority of 15-19 year-olds across the OECD are enrolled in education. In Ireland, 54% of this age group are enrolled in general upper secondary education and 5% in vocational upper secondary education. A further 15% are enrolled in lower secondary programmes and 17% in tertiary programmes. This compares to an OECD average of 37% enrolled in general upper secondary programmes, 23% in vocational upper secondary programmes, 12% in lower secondary programmes and 12% in tertiary programmes (Figure 2).
1. Year of reference differs from 2021: 2020 for Argentina and South Africa; 2018 for Indonesia.
2. Excludes students enrolled at tertiary levels.
3. Breakdown by age not available after 15 years old.
4. Excludes post-secondary non-tertiary education.
Countries are ranked in descending order of the share of students enrolled in upper secondary vocational education.
Source: OECD/UIS/Eurostat (2023), Table B1.2. For more information see Source section and Education at a Glance 2023 Sources, Methodologies and Technical Notes (OECD, 2023[1]).
Perhaps surprisingly, the share of international students at tertiary level has not been negatively affected by the COVID-19 pandemic in many OECD countries. However, a few countries experienced notable declines in the share of international students. Ireland is one of them, as the share of international students decreased from 11% of all tertiary students in 2019 to 9% in 2021.
All OECD and partner countries devote a substantial share of their domestic output to education. In 2020, OECD countries spent on average 5.1% of their gross domestic product (GDP) on primary to tertiary educational institutions. In Ireland, the corresponding share was 3.2% of GDP, of which 36% was dedicated to primary education, 17% to lower secondary education, 16% to upper secondary education, 7% to post-secondary non-tertiary education and 25% to tertiary education (Figure 3).

1. Year of reference differs from 2020. Refer to the source table for more details.
2. Upper secondary vocational programmes include lower secondary vocational programmes.
3. Upper secondary programmes include lower secondary programmes.
4. Primary education includes pre-primary programmes.
Countries are ranked in descending order of total expenditure on primary and lower secondary institutions.
Source: OECD/UIS/Eurostat (2023), Table C2.1. For more information see Source section and Education at a Glance 2023 Sources, Methodologies and Technical Notes (OECD, 2023[1]).
Funding for education in absolute terms is strongly influenced by countries’ income levels. Countries with higher per capita GDP tend to spend more per student than those with lower per capita GDP. Across all levels from primary to tertiary education, Ireland spends USD 12 194 annually per full-time equivalent student (adjusted for purchasing power), compared to the OECD average of USD 12 647. Expenditure per student is equivalent to 13% of per capita GDP, which is below the OECD average of 27%.
The COVID-19 pandemic has created unprecedented challenges for education systems across the world. On average across the OECD, expenditure on primary to tertiary educational institutions per full-time equivalent student (including expenditure on research and development) grew by 0.4% from 2019 to 2020 (the first year of the pandemic and the latest period with available data). In Ireland, it increased by 6.9%. This change in expenditure per student is the result of total expenditure on educational institutions increasing by 8.1% and the total number of full-time equivalent students increasing by 1.2%.
Government sources dominate non-tertiary education funding in all OECD countries, while the private sector contributes 9% of the total expenditure on educational institutions on average. Private funding in Ireland accounted for 11% of expenditure at primary, secondary and post-secondary non-tertiary levels.
On average across OECD countries, more than half of government expenditure on primary to post-secondary non-tertiary education comes from subnational governments. In Ireland, 100% of the funding comes from the central government, after transfers between government levels.
The total compulsory instruction time throughout primary and lower secondary education varies widely from country to country (Figure 4). Across the OECD, over the course of primary and lower secondary education, compulsory instruction time totals an average of 7 634 hours, distributed over nine grades. In Ireland, the total compulsory instruction time is higher, at 8 170 hours, over nine grades.
On average across OECD countries, 25% of the compulsory instruction time in primary education is devoted to reading, writing and literature and 16% to mathematics. In lower secondary education, the share is 15% for reading, writing and literature and 13% for mathematics. In Ireland, 20% of time is devoted to reading, writing and literature and 17% to mathematics at primary level compared to 9% each to both subjects at lower secondary level.
Teachers’ salaries are an important determinant of the attractiveness of the teaching profession, but they also represent the single largest expenditure category in formal education. In most OECD countries, the salaries of teachers in public educational institutions increase with the level of education they teach, and also with experience. On average, annual statutory salaries for upper secondary teachers in general programmes with the most prevalent qualification and 15 years of experience are USD 53 456 across the OECD. In Ireland, the corresponding salary adjusted for purchasing power is USD 61 498, which is equivalent to EUR 64 737.
Besides average teacher salaries themselves, annual teaching time requirements, annual hours of compulsory instruction time for students, and class size also impact total spending on teacher salaries. When combined, these factors can be used to estimate an average cost of salaries per student and show the relative impact of each individual factor on total salary spending. Total teacher salary costs per primary student are USD 4 152 in Ireland, higher than the OECD average of USD 3 614. This difference can be broken down into these four factors: higher teacher salaries increase costs (by USD 921), above-average teaching hours reduce costs (by USD 652), above-average student instruction time increases costs (by USD 526) and larger classes reduce costs (by USD 257).

Note: Instruction hours for each grade refer to average hours per grade for the level of education. Numbers in square brackets refer to the total number of years for primary and lower secondary education.
1. Estimated number of hours by level of education based on the average number of hours per year, as for some subjects, the allocation of instruction time across multiple levels is flexible.
3. The number of grades in lower secondary education is three or four, depending on the track. The fourth year of pre-vocational secondary education was excluded from the calculation.
Countries and other participants are ranked in ascending order of the total number of compulsory instruction hours.
Source: OECD (2023), Table D1.1. For more information see Source section and Education at a Glance 2023 Sources, Methodologies and Technical Notes (OECD, 2023[1]).
Between 2015 and 2022, statutory salaries of upper secondary teachers in general programmes (with the most prevalent qualification and 15 years of experience) declined in real terms in roughly half of all OECD countries with available data. In Ireland, upper secondary teachers’ salaries decreased by 3% between 2015 and 2022.
National/central assessments (standardised tests with no consequence on students’ progression through school or certification) are more common at primary and lower secondary levels than at upper secondary level, while most OECD countries conduct national/central examinations (standardised tests with formal consequence) in the final years of upper secondary education. These national/central assessments and examinations take place at different grades and can have different periodicities, their contents may vary over years and/or across students and are not necessarily compulsory for students. In Ireland, there are at least two national/central assessments at primary level, and none at lower secondary level. At upper secondary level, there is one national/central examination that each student may be expected to take.
References
OECD (2023), Education at a Glance 2023 Sources, Methodologies and Technical Notes, OECD Publishing, Paris, https://doi.org/10.1787/d7f76adc-en.
OECD (2023), Education at a Glance Database, https://stats.oecd.org/.
OECD (2023), Education at a Glance 2023: OECD Indicators, OECD Publishing, Paris, https://doi.org/10.1787/e13bef63-en.
For more information on Education at a Glance 2023 and to access the full set of indicators, see: https://doi.org/10.1787/e13bef63-en.
For more information on the methodology used during the data collection for each indicator, the references to the sources and the specific notes for each country, see Education at a Glance 2023 Sources, Methodologies and Technical Notes (https://doi.org/10.1787/d7f76adc-en).
For general information on the methodology, please refer to the OECD Handbook for Internationally Comparative Education Statistics 2018 (https://doi.org/10.1787/9789264304444-en).
Updated data can be found on line at https://doi.org/10.1787/eag-data-en and by following the StatLinks 2 under the tables and charts in the publication.
Explore, compare and visualise more data and analysis using the Education GPS:
https://gpseducation.oecd.org/.
This work is published under the responsibility of the Secretary-General of the OECD. The opinions expressed and arguments employed herein do not necessarily reflect the official views of OECD member countries.
This document, as well as any data and any map included herein, are without prejudice to the status of or sovereignty over any territory, to the delimitation of international frontiers and boundaries and to the name of any territory, city or area.
The statistical data for Israel are supplied by and under the responsibility of the relevant Israeli authorities. The use of such data by the OECD is without prejudice to the status of the Golan Heights, East Jerusalem and Israeli settlements in the West Bank under the terms of international law.
The use of this work, whether digital or print, is governed by the terms and conditions to be found at www.oecd.org/termsandconditions/.

Source: OECD (2023), “Ireland: Diagram of education system”, OECD Education GPS, http://gpseducation.oecd.org/Content/MapOfEducationSystem/IRL/IRL_2011_EN.pdf
Please refer to “Ireland: Diagram of education system” for information on the keys.