
Chapter 4. Teachers and support staff
This chapter focuses on teachers: whether schools have an adequate number of them, whether they are sufficiently qualified, their working conditions. It also examines the availability of support staff to provide career guidance at school. Each of these factors is then related to student performance and equity in the education system.
Out of all the school resources that are needed to boost students’ learning and well-being, teachers are perhaps the most important. If schools do not have a sufficient number of teachers, or if teachers are not adequately qualified and able to support their students’ needs, improving the quality and equity of education is unlikely. By contrast, effective teacher policies can be the foundation on which to build successful education systems (OECD, 2005[1]; OECD, 2010[2]; OECD, 2019[3]).
Research has identified teacher-related factors that have a measurable impact on students’ academic achievement or on students’ social and emotional well-being. These include teachers’ initial education and certification, teachers’ working conditions, opportunities for professional development, teacher collaboration and peer-mentoring, and quality systems of teacher appraisal (Rockoff, 2004[3]; Nye, Konstantopoulos and Hedges, 2004[4]; Clotfelter, Ladd and Vigdor, 2006[5]; Jennings and DiPrete, 2010[6]; OECD, 2013[7]). In addition, teacher enthusiasm and support are positively correlated to student learning and attitudes (OECD, 2019[8]).
In addition to teachers, a range of other professionals and human resources plays an important role in school life (OECD, 2019[9]). Schools’ support staff, as considered in this chapter, includes career guidance counsellors, psychologists and social workers; special educators and educational therapists; doctors and nurses; teaching and classroom assistants; and supervisors and school guards, amongst others.
In 43 countries and economies, students attending schools whose principal reported greater shortages of teaching and support staff scored lower in reading. After accounting for students’ and schools’ socio-economic profile, in 17 countries and economies, students in schools with more staff shortages scored lower, while in the Republic of Moldova, students in such schools scored higher.
On average across OECD countries, 27% of students were enrolled in schools whose principal reported that learning is hindered by a lack of teaching staff, and 33% were enrolled in schools whose principal reported that learning is hindered by a lack of assisting staff.
On average across OECD countries, and in 17 countries/economies, students in schools with a greater share of full-time teachers scored higher in reading, after accounting for students’ and schools’ socio-economic profile; in 20 countries and economies, students in such schools scored lower.
On average across OECD countries, and in 12 countries/economies, students in schools with a greater share of fully certified teachers scored higher in reading, after accounting for students’ and schools’ socio-economic profile, while in 6 countries and economies, students in such schools scored lower.
After accounting for students’ and schools’ socio-economic profile, in five countries, students in schools whose principal reported that career guidance is offered at school scored higher in reading, but in six countries, students in such schools scored lower. In addition, in five countries, students in such schools were more likely to expect to complete tertiary education; but in ten countries they were less likely to expect to do so. Similarly, in five countries, students in schools whose principal reported that career guidance is offered at school were more likely to expect to work in a high-skilled occupation, while in six countries, students in such schools were less likely to expect so.
PISA 2018 asked school principals whether providing instruction at their school is hindered by a lack of teaching and support staff or by an inadequacy or poor qualifications of teaching and support staff. This information refers to both the availability and quantity of staff, and to the quality of available staff. Both types of information were combined into a single standardised measure, the PISA index of shortage of education staff (for technical details, see Annex A3). Higher values in the index indicate more shortages of quality education staff in school. For interpretation purposes, it is important to keep in mind that the index measures the perception of school principals, rather than an objective measure of staff shortage. School principals in different countries may have different perceptions of what constitutes a shortage in teaching or support staff in their school.
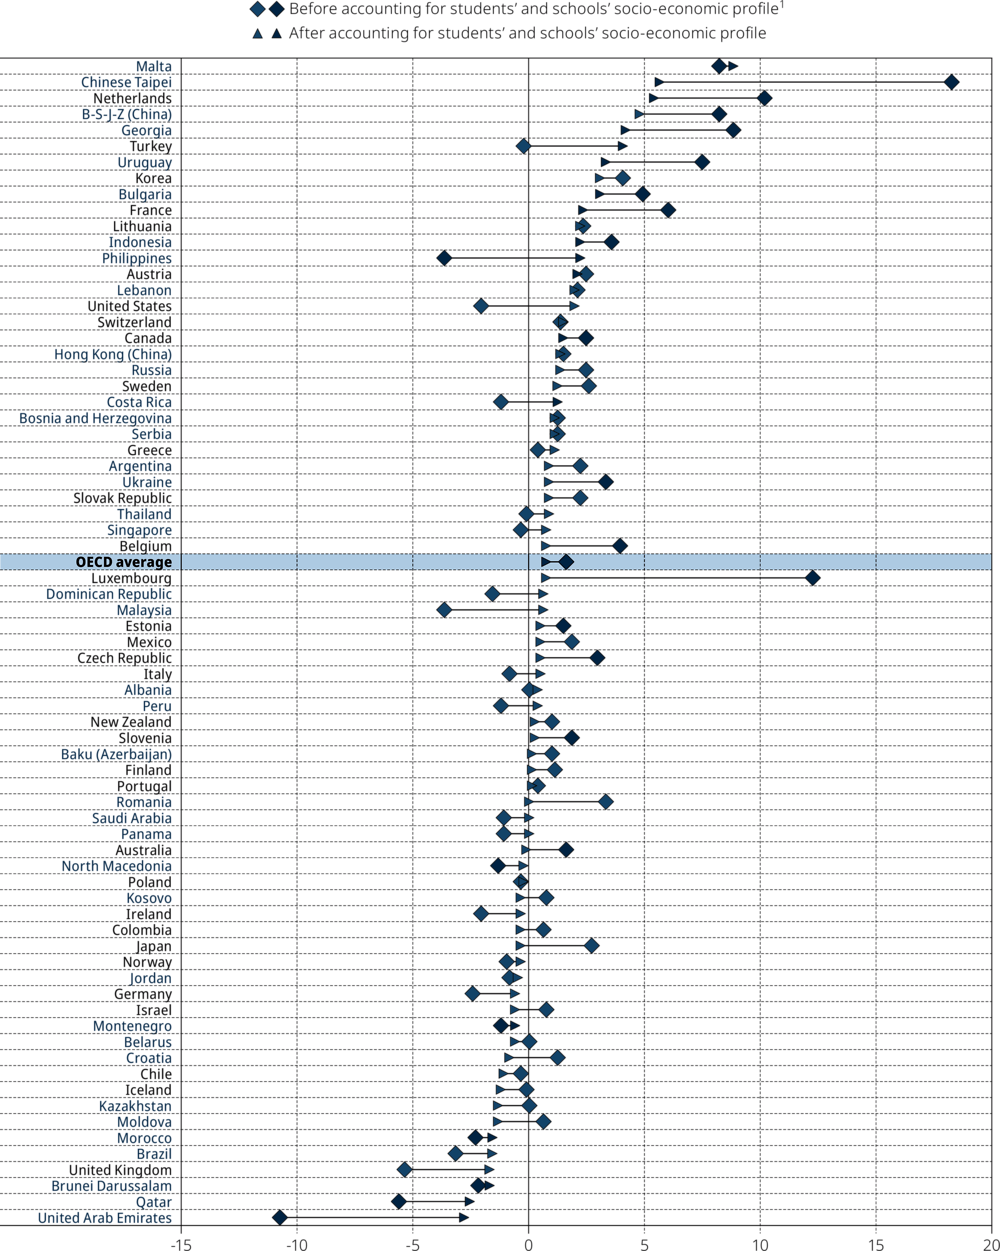
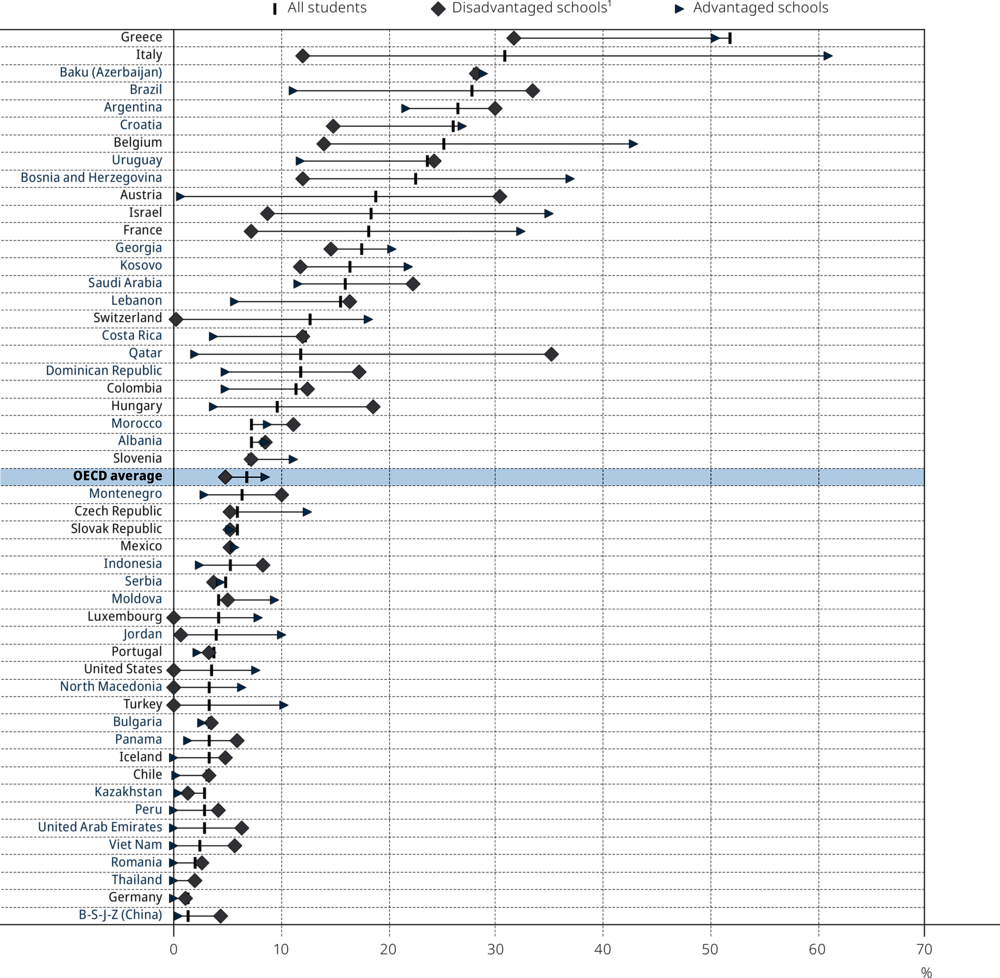
In PISA 2018, the index of shortage of education staff was 0.9 in Japan, Morocco and Portugal, a value that indicates more shortages of education staff, as perceived by school principals (Figure V.4.2). In Bulgaria, Montenegro and Poland, the index was -0.9 or lower, a value that indicates fewer perceived shortages of education staff.
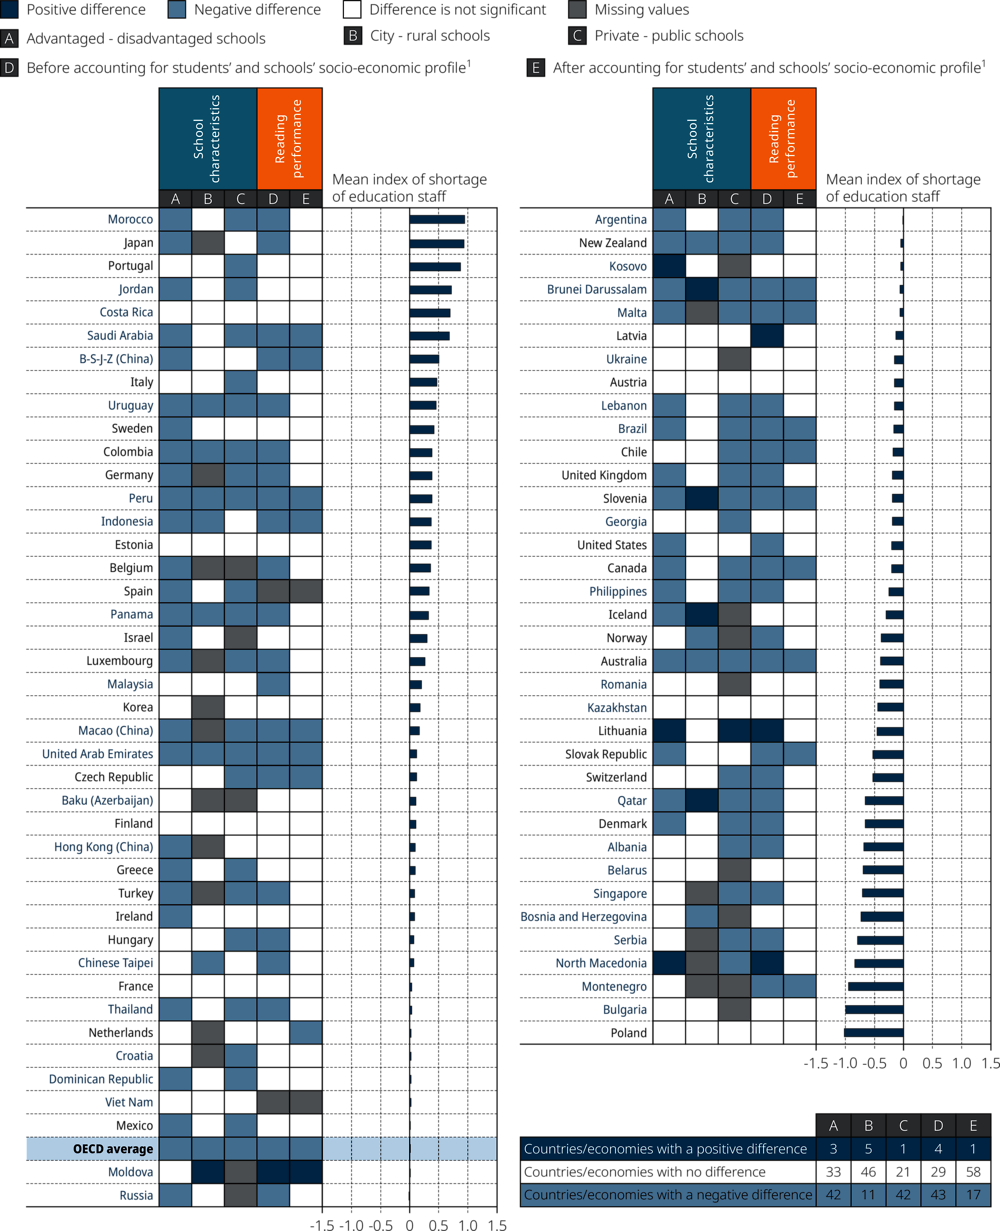
1. This analysis is restricted to schools with the modal ISCED level for 15-year-old students.
Note: Higher values in the index indicate more shortages of teaching and supporting staff in school.
Countries and economies are ranked in descending order of the index of shortage of education staff.
Source: OECD, PISA 2018 Database, Table V.B1.4.1.
In 42 countries and economies, students attending socio-economically disadvantaged schools were exposed to more shortages of education staff than their peers in advantaged schools. The largest disparities in education staff in favour of advantaged schools were found in Hong Kong (China), Peru, the United Arab Emirates and Uruguay (Table V.B1.4.1). Only in three education systems, namely Kosovo, Lithuania and the Republic of North Macedonia (hereafter “North Macedonia”), were shortages of education staff more prevalent in advantaged schools.
In another 42 countries and economies, shortages of education staff were more prevalent in public schools than in private schools. The largest disparities in shortages of education staff, in favour of private schools, were observed in Colombia, Greece, Portugal and Uruguay (Table V.B1.4.1). In Lithuania, public schools suffered fewer shortages of education staff than private schools.
On average across OECD countries and in 11 countries and economies, shortages of education staff were more prevalent in rural schools than in urban schools (Figure V.4.2). In five countries/economies, shortages of education staff were more prevalent in urban schools than in rural schools.
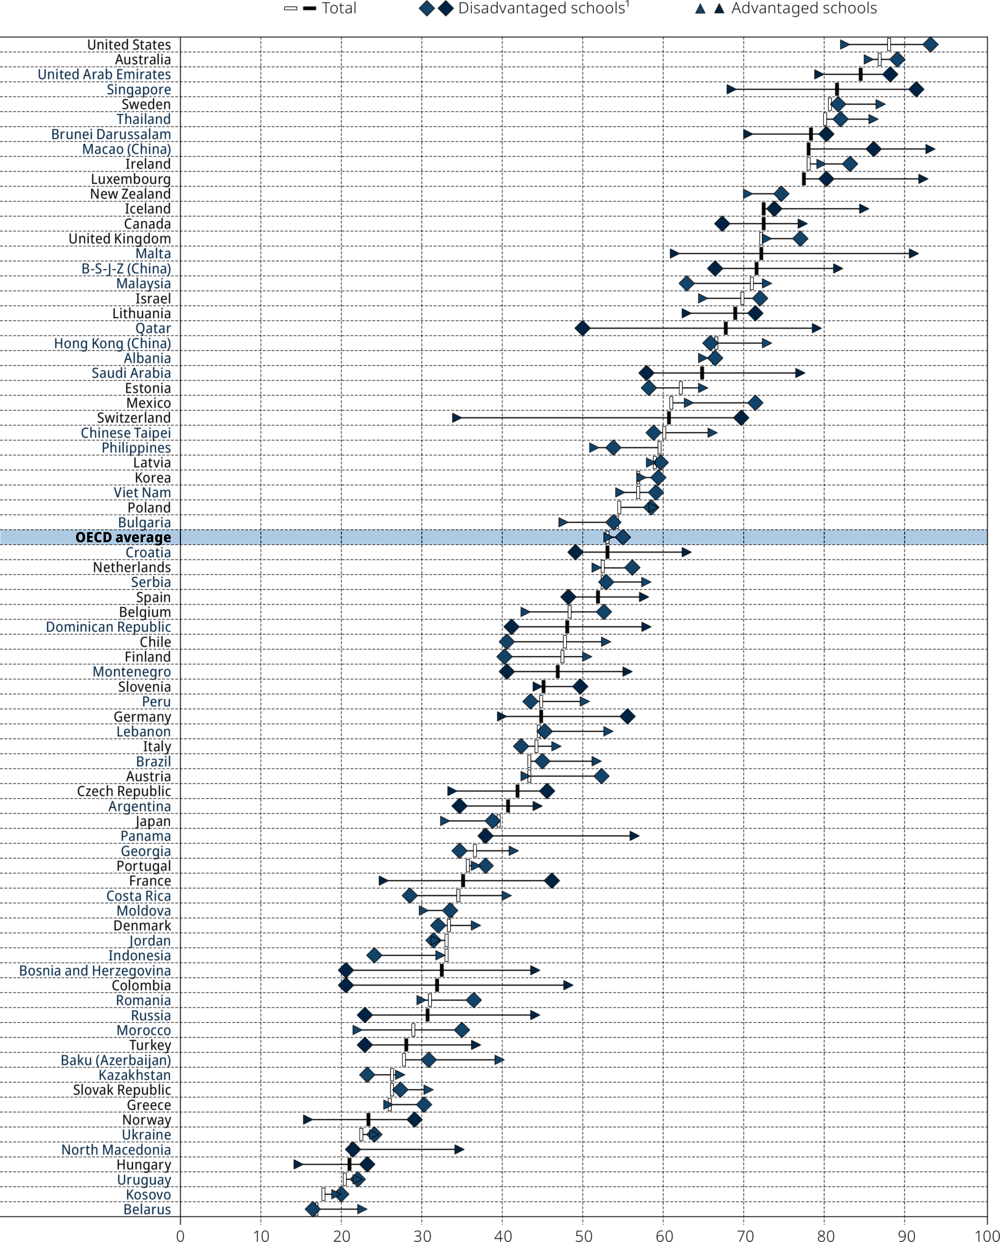
When the components of the index of shortage of education staff were examined separately, it became evident that in most countries a lack of education staff was more prevalent, according to school principals, than an inadequacy or poor qualifications of staff (Figure V.4.3). On average across OECD countries, about 27% of students attended schools whose principal reported that a lack of teaching staff hinders learning, whereas only 15% of students were enrolled in schools where inadequate or poorly qualified teaching staff hinders learning. Similarly, 33% of students attended schools whose principal reported that a lack of assisting staff hinders learning, but only 17% were in schools in which inadequate or poorly qualified assisting staff hinders learning, on average across OECD countries.
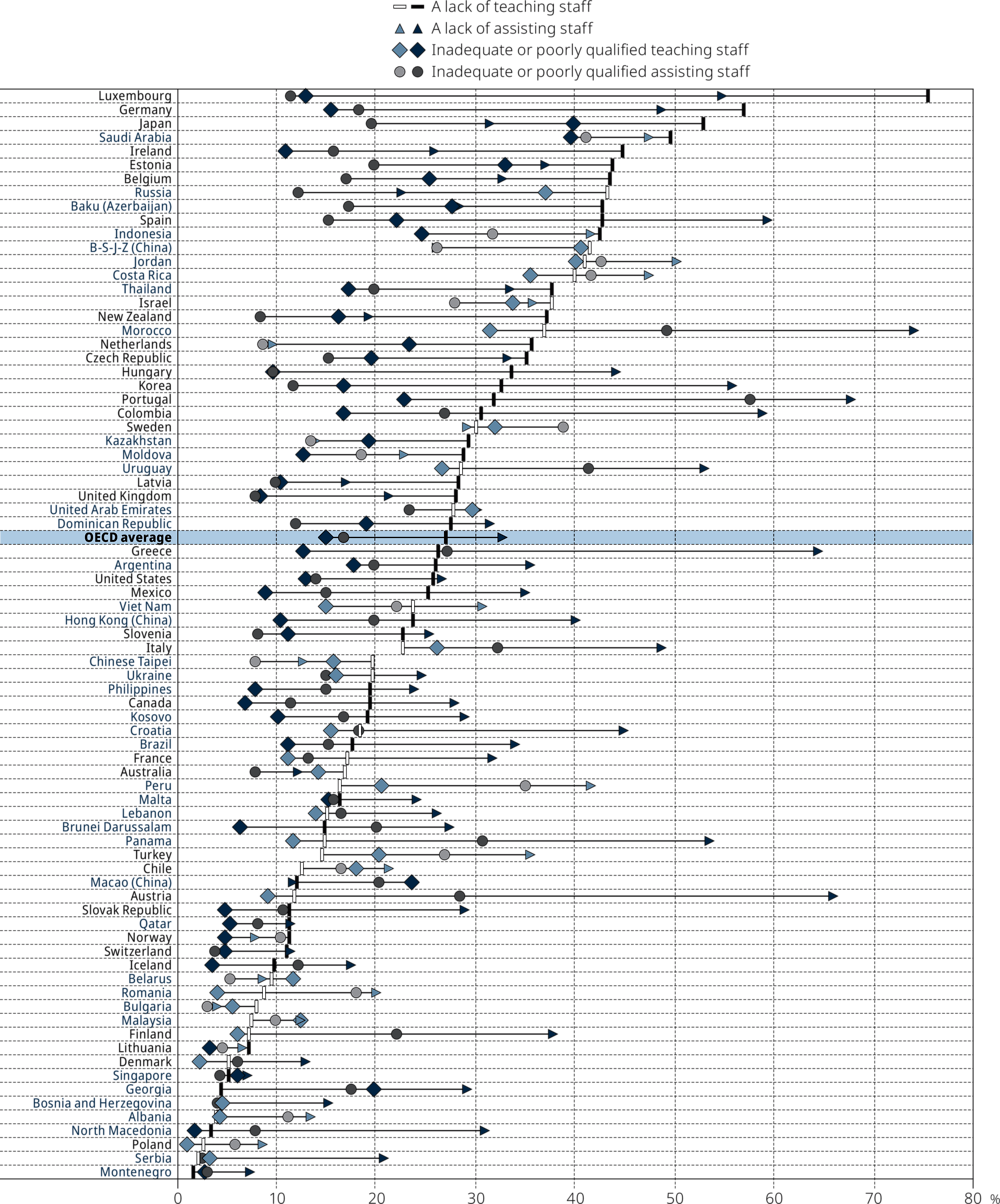
Countries and economies are ranked in descending order of the percentage of students in schools whose principal reported that the school’s capacity to provide instruction is hindered by a lack of teaching staff.
Note: Significant differences between “a lack of teaching staff” (”a lack of assisting staff”) and “inadequate or poorly qualified teaching staff” (”inadequate or poorly qualified assisting staff”) are shown in a darker tone (see Annex A3).
Sources: OECD, PISA 2018 Database, Tables V.B1.4.2 and V.B1.4.3.
In only three countries/economies, namely Georgia, Macao [China] and Montenegro, was the incidence of inadequate or poorly qualified teaching staff more prevalent than a lack of teaching staff. Only in Macao (China) was the incidence of inadequate or poorly qualified assisting staff greater than a lack of assisting staff (Table V.B1.4.3).
Figure V.4.3 also shows that some countries suffer more from a lack of teaching staff whereas others suffer more from a lack of assisting staff, according to school principals. In Germany, Japan, Luxembourg and Saudi Arabia, at least 50% of students were in schools whose principals reported that a lack of teaching staff hinders learning. In Austria, Colombia, Greece, Jordan, Korea, Luxembourg, Morocco, Panama, Portugal, Spain and Uruguay, at least 50% of students attended schools whose principal reported that instruction is hindered by a lack of assisting staff.
Shortages in teaching and support staff were less prevalent in 2018 than in 2015, on average across OECD countries (Table V.B1.4.2). For example, the share of students in schools whose principal reported that instruction is hindered by a lack of teaching staff decreased in 25 countries since PISA 2015, and by more than 15 percentage points in France, Greece, Macao (China), Chinese Taipei and Uruguay. Similarly, the share of students in schools whose principal reported that instruction is hindered by a lack of assisting staff decreased in 25 countries, and by the widest margins in Albania, Korea, Malta, Chinese Taipei and Turkey.
Perceived shortages of education staff, as measured by the combined index of shortage of education staff, were negatively related to student achievement in reading (Figure V.4.2). In 43 countries and economies, students attending schools with greater shortages scored lower in reading than students in schools with fewer shortages of staff (Table V.B1.4.1). In 29 countries and economies, no statistically significant differences in reading scores were found between students in schools with more or fewer shortages of education staff. In four countries, students attending schools with more shortages scored higher in reading than students in schools with fewer shortages of staff.
After accounting for students’ and schools’ socio-economic profile, in 17 countries and economies, students enrolled in schools with more shortages scored lower in reading (Figure V.4.2). In 58 countries/economies, no statistically significant differences in reading scores were found between students in schools with more or fewer shortages of education staff, after accounting for students’ and schools’ socio-economic profile. In the Republic of Moldova (hereafter “Moldova”), students attending schools with more shortages scored higher in reading than students in schools with fewer shortages of staff.
Teacher contracts
Teacher contracts, as examined here, refer to the type of work schedule teachers have, i.e. whether they work part time or full time in a school. Different working conditions between full-time and part-time teachers might influence not only their job satisfaction but also their role within the school and the quality of their teaching. Full-time teachers tend to enjoy greater professional recognition in schools and better salaries, receive more support from school managers, and have more access to professional development and teacher collaboration, compared to their part-time colleagues (Jameson and Hillier, 2008[10]). At the same time, however, some studies suggest that, in order to compensate for these disadvantages, part-time teachers often display greater professionalism, better time-management skills, and a high level of commitment to their students (Atherton and Kingdon, 2010[11]).
PISA asked school principals how many of the teachers in their school are employed full time and part time. A full-time teacher, as defined in PISA, is employed at least 90% of the time as a teacher for the full school year; all other teachers are considered to be part time.
About 87% of the teachers working in schools attended by 15-year-olds worked full time and 13% worked part time, on average across OECD countries in 2018 (Figure V.4.4). In 43 countries and economies, 90% or more of teachers worked full time. In every PISA-participating country/economy except Argentina, Brazil, Indonesia, Mexico, the Netherlands, Switzerland and Uruguay, more than 75% of teachers worked full time. In Argentina, Brazil and Uruguay, less than half of teachers in the schools attended by 15-year-olds worked full time (Table V.B1.4.4).
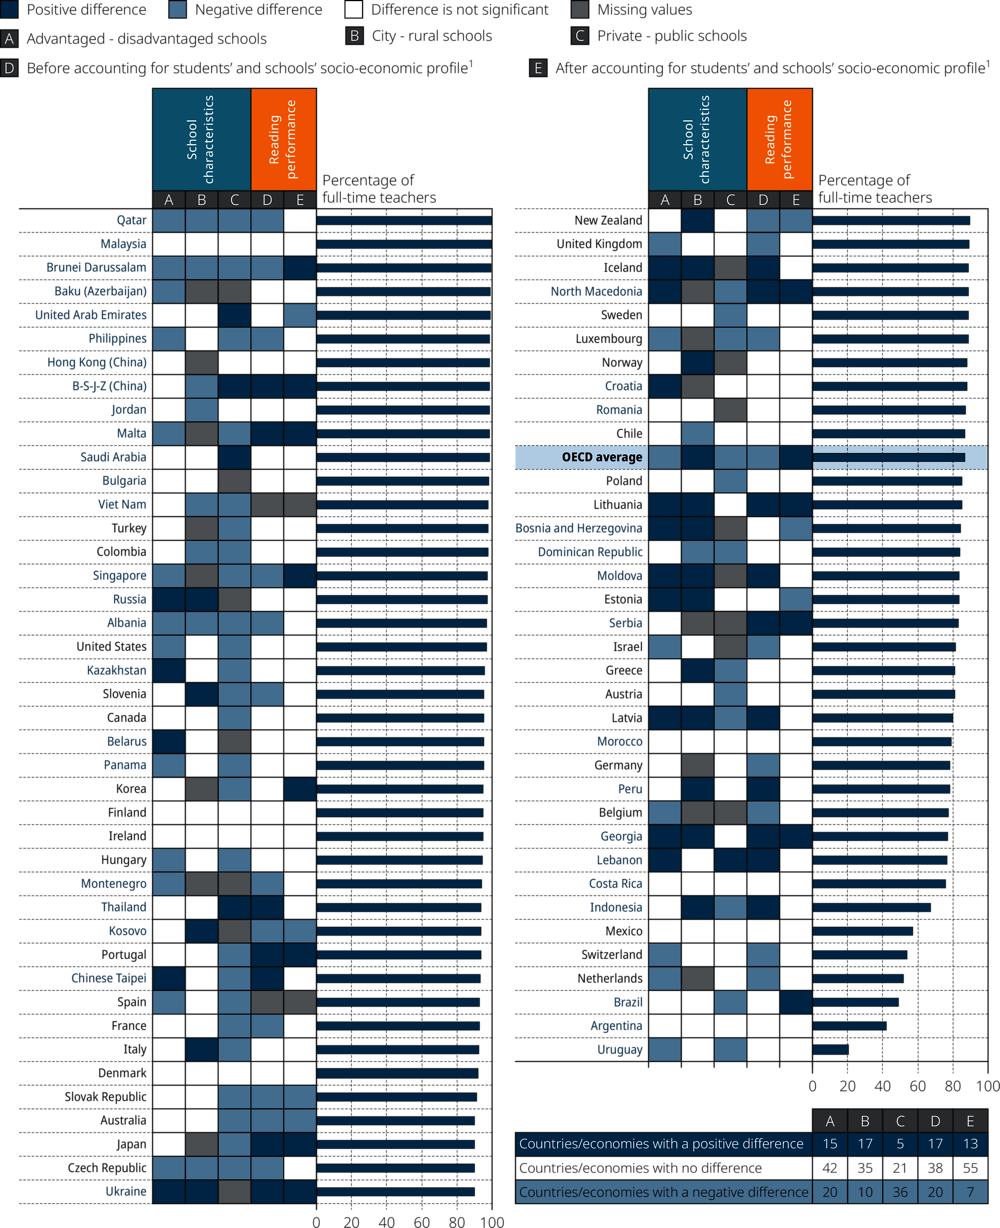
1. This analysis is restricted to schools with the modal ISCED level for 15-year-old students.
Countries and economies are ranked in descending order of the percentage of full-time teachers.
Source: OECD, PISA 2018 Database, Table V.B1.4.5.
On average across OECD countries, and in 20 countries and economies, the percentage of teachers working full time was greater in disadvantaged schools than in advantaged schools, but only in 5 countries (Israel, the Netherlands, Panama, Switzerland and Uruguay) was the difference greater than 5 percentage points. In 15 other countries and economies, advantaged schools had a larger share of full-time teachers than disadvantaged schools.
In 20 countries and economies, and on average across OECD countries, students in schools with a larger share of full-time teachers scored lower in reading, but they scored higher in another 17 countries and economies (Figure V.4.4). In 38 countries and economies, the prevalence of full-time teachers in a school was not associated with students’ reading performance.
After accounting for students’ and schools’ socio-economic profile, in 13 countries/economies there was a positive association between the share of full-time teachers and reading performance; in 7 other countries/economies, there was a negative association; and in 55 countries/economies there was no association (Figure V.4.4).
Teacher certification
Certified teachers are those licensed to teach in a school based on the standards defined by national or local institutions. The goal of teacher certification is to guarantee that schools are staffed with quality teachers; but critics argue that certification might be ineffective or impose burdensome requirements (Darling-Hammond, 2010[12]; Akiba et al., 2010[13]). In general, research finds a positive association between teacher certification and student achievement (Clotfelter, Ladd and Vigdor, 2006[5]; Goldhaber and Brewer, 2000[14]). It is less clear whether teacher certification improves the quality of teaching directly or if more able, persistent and motivated candidates are more likely to be certified (Boyd et al., 2007[15]).
PISA asked school principals how many of the teachers in their school were fully certified by an appropriate authority. In most PISA-participating countries and economies, most teachers were fully certified. On average across OECD countries, 82% of teachers working in schools attended by 15-year-olds were fully certified by the appropriate national or local authority. In 53 countries and economies at least 80% of teachers were fully certified, whereas in 23 countries less than 80% of teachers were fully certified (Table V.B1.4.6). In Colombia, Georgia, Mexico and the United Arab Emirates, less than half of teachers in schools attended by 15-year-olds were fully certified.
In 16 countries and economies in 2018, the share of fully certified teachers was larger in advantaged than in disadvantaged schools, but in 12 countries and economies the opposite was observed (Table V.B1.4.6). On average across OECD countries, 80% of teachers in disadvantaged schools and 83% of teachers in advantaged schools were fully certified.1
In 16 countries and economies, and on average across OECD countries, students in schools with a larger share of fully certified teachers scored higher in reading, but in 8 countries and economies they scored lower (Figure V.4.5).
1. The socio-economic profile is measured by the PISA index of economic, social and cultural status (ESCS). A socio-economically disadvantaged (advantaged) school is a school in the bottom (top) quarter of the index of ESCS in the relevant country/economy.
Notes: Significant differences in the change in reading performance are shown in a darker tone (see Annex A3). This analysis is restricted to schools with the modal ISCED level for 15-year-old students. Countries and economies are ranked in descending order of the change in reading performance per 10-unit increase in the percentage of teachers at school fully certified by the appropriate authority.
Source: OECD, PISA 2018 Database, Table V.B1.4.8.
After accounting for students’ and schools’ socio-economic profile, in 12 countries/economies and on average across OECD countries, students in schools with a larger share of fully certified teachers scored higher in reading while in 6 countries and economies they scored lower (Figure V.4.5).
Teacher professional development
Together with autonomy and participation in peer networks, teacher professional development is one of the pillars of teacher professionalism (OECD, 2016[16]). Professional development programmes aim to develop the skills, knowledge and dispositions of individual teachers, but in addition they can enhance schools’ capacity for organisational change and improvement (OECD, 2016[16]; OECD, 2009[17]; Borko, Jacobs and Koellner, 2010[18]; Borko, Elliot and Uchiyama, 2000[19]). Research suggests that professional development is more effective when it focuses on student learning, actively engages teachers in designing instructional strategies, supports collaboration amongst peers, uses models of effective practice, and provides coaching, feedback and enough time for teachers to implement and sustain changes (Darling-Hammond, Hyler and Gardner, 2017[20]; Lumpe et al., 2012[21]).
A programme of professional development, as defined in PISA, is a formal programme of at least one day designed to enhance teaching skills or pedagogical practices, and that may or may not lead to a recognised qualification. PISA asked school principals to report the percentage of all teaching staff in their school who had attended a programme of professional development in the three months prior to the PISA test.
Across OECD countries in 2018, the average 15-year-old student attended a school whose principal reported that 53% of teachers had participated in a programme of professional development in the three months prior to the PISA test (Figure V.4.6). The share was at least 80% in Australia, Singapore, Sweden, Thailand, the United Arab Emirates and the United States, and greater than 50% in 38 countries and economies. By contrast, fewer than one in four teachers in Belarus, Hungary, Kosovo, North Macedonia, Norway, Ukraine and Uruguay had attended a programme of professional development during that period.
1. The socio-economic profile is measured by the PISA index of economic, social and cultural status (ESCS). A socio-economically disadvantaged (advantaged) school is a school in the bottom (top) quarter of the index of ESCS in the relevant country/economy.
Note: Significant differences between advantaged and disadvantaged schools are shown in a darker tone (see Annex A3). Countries and economies are ranked in descending order of the percentage of teachers who attended a programme of professional development in the previous three months.
Source: OECD, PISA 2018 Database, Table V.B1.4.7.
The percentage of teachers who had attended a programme of professional development increased by two percentage points between PISA 2015 and PISA 2018, on average across OECD countries (Table V.B1.4.7). In 19 countries and economies the share of teachers who had attended such a programme was greater in PISA 2018 than in PISA 2015; the increase was greater than 20 percentage points in Ireland, Luxembourg, Malta and Mexico. By contrast, in 14 countries/economies, the share was smaller in 2018 than in 2015, and the reduction was greater than 20 percentage points only in Romania.
In 32 countries and economies in 2018, the share of teachers who had attended a programme of professional development was larger in disadvantaged than in advantaged schools (Figure V.4.6). On average across OECD countries, 55% of teachers in disadvantaged schools and 52% of teachers in advantaged schools had attended a programme of professional development in the 3 months prior to the PISA test. In PISA 2015, no such difference was observed, on average across OECD countries.
The relationship between teachers’ participation in professional development activities and students’ performance in reading is weak in most PISA-participating countries and economies (Table V.B1.4.8). After accounting for the socio-economic profile of students and schools, in nine education systems, students scored higher in reading when more teachers in their school had participated in professional development activities; in ten other systems, students scored lower in reading when their teachers had participated in such activities.
Class size
There are number of ways in which smaller classes are, in theory, good for instruction and learning. In classes with fewer students, teachers might be able to allocate more time, attention and support to each student. By contrast, in larger classes, at least some students might be disengaged from instruction (Finn, Pannozzo and Achilles, 2003[23]). Moreover, students attending remedial lessons are more likely to be in smaller classes than students who do not attend such lessons. However, research provides mixed evidence about whether smaller classes improve student outcomes (Dynarski, Hyman and Schanzenbach, 2013[24]; Fredriksson, Öckert and Oosterbeek, 2013[25]; Woessmann and West, 2005[26]; Blatchford and Russell, 2019[27]; Finn and Achilles, 1999[28]; De Giorgi, Pellizzari and Woolston, 2012[29]). Previous PISA reports have pointed out that some top-performing education systems have large classes, and suggest that investments in teacher quality are more effective than investing in smaller classes (OECD, 2014[30]).
PISA 2018 asked school principals to report the average size of language-of-instruction classes in the national modal grade for 15-year-olds. According to school principals, on average across OECD countries in 2018, there were 26 students per language-of-instruction class. While in Beijing, Shanghai, Jiangsu and Zhejiang (China) (hereafter “B-S-J-Z [China]”), Mexico, the Philippines, Turkey and Viet Nam there were 40 or more students per class, in Belgium, Finland, Iceland, Malta and Switzerland there were 20 or fewer students per class.
In PISA 2015, there were also 26 students per language-of-instruction class, on average across OECD countries (Table V.B1.4.12). However, since 2015, the average size of these classes shrank in 20 countries/economies (by 5 or more students in Georgia, Korea, Macao [China] and Turkey), while it grew in 9 countries/economies (by 2 or 3 students in Mexico, Moldova, Qatar and Spain). In 37 countries/economies, class size did not change between 2015 and 2018.
Policy makers must constantly balance expenditure on education with expenditure for many other public services. Yet despite the competing demands for resources, expenditure on education has increased over the past few years. Between 2010 and 2016, expenditure per primary, secondary and post-secondary non-tertiary student increased by 5%, on average across OECD countries with data available for both 2010 and 2016 (OECD, 2019[22]).
Financial resources can be allocated to salaries paid to teachers, administrators and support staff; maintenance or construction costs of buildings and infrastructure; and operational costs, such as transportation and meals for students.
School systems with greater total expenditure on education tend to be those with higher levels of per capita GDP. Spending on education and per capita GDP are highly correlated (r = 0.9 across OECD countries and r = 0.91 across all participating countries and economies in PISA 2018) (Tables B3.1.1 and B3.1.4).
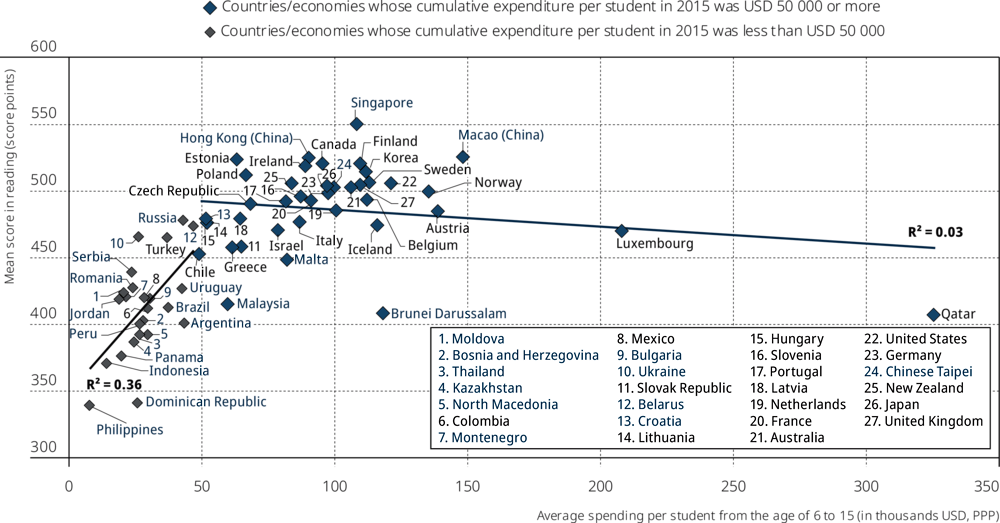
In 2018, total expenditure by educational institution per student from the age of 6 to 15 exceeded USD 100 000 (PPP-corrected dollars) in Austria, Belgium, Brunei Darussalam, Finland, Iceland, Korea, Luxembourg, Macao (China), the Netherlands, Norway, Qatar, Singapore, Sweden, Chinese Taipei, the United Kingdom and the United States. In Qatar, cumulative expenditure per student exceeded USD 325 000. In contrast, in the Dominican Republic, Georgia, Indonesia, Jordan, Kazakhstan, Moldova, Montenegro, Panama, Peru, the Philippines, Romania and Serbia, cumulative expenditure per student over this age period amounted to less than USD 25 000 (Table B3.1.1).
Amongst the countries and economies whose cumulative expenditure per student was under USD 50 000 (the level of spending in 24 countries/economies), higher expenditure on education was significantly associated with higher scores in the PISA reading test. But this was not the case amongst countries and economies whose cumulative expenditure was greater than USD 50 000, which include most OECD countries (Figure II.6.2). It seems that for this latter group of countries and economies, factors other than the level of investment in education are better predictors of student performance.
Teachers’ salaries
Staff compensation comprises the largest share of current expenditure at all levels of education. In primary, secondary and post-secondary non-tertiary education, four-fifths of staff compensation goes to teachers, with the remainder going to other staff (OECD, 2019[22]).
Higher salaries can help school systems attract the best candidates to the teaching profession, and signal that teachers are regarded and treated as professionals. But paying teachers well is only part of the equation. The relationship between reading performance and teachers’ salaries relative to per capita national income was statistically significant across OECD countries and across PISA-participating countries and economies in 2018 (Figure V.4.8). However, the correlation was entirely driven by Mexico and Lebanon, two countries where teachers’ PPP-corrected per capita salaries are higher than those in other countries/economies. After excluding these outliers, the relationship was not statistically significant.
Note: Only countries and economies with available data are shown.
Sources: OECD, PISA 2018 Database, Tables B3.1.1 and I.B1.4.
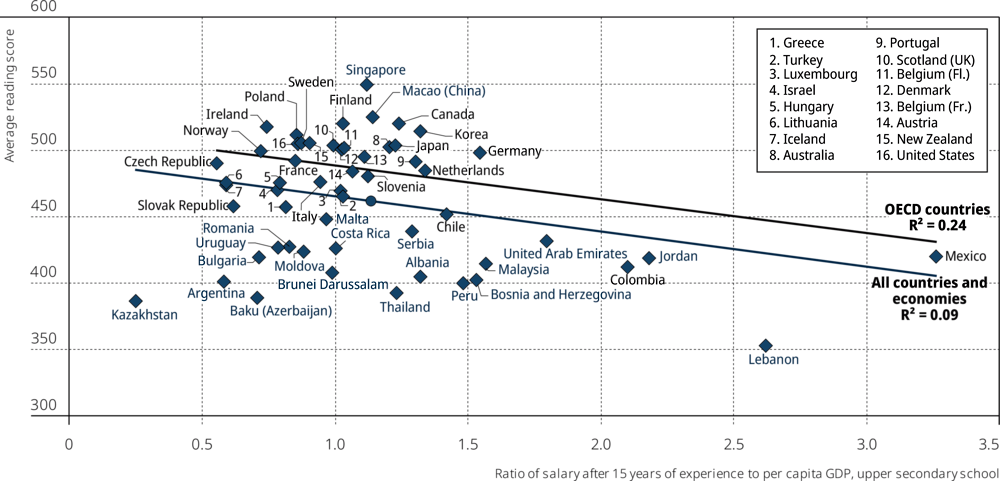
Sources: OECD, PISA 2018 Database, Tables I.B1.4 and B3.1.2.
This finding suggests that other factors, such as the quality of teaching, may be more closely associated with students’ performance at the system level. Intervening factors, such as the different criteria used by school systems for identifying and compensating their best teachers and the level of teachers’ pay in relation to the system’s resources, may also be at play here. For example, if countries do not have enough resources to invest in education, paying relatively high salaries might attract good teachers, but it also might limit the number of teachers the system can afford, thus contributing to shortages of teaching staff.
On average across OECD countries, smaller language-of-instruction classes were more frequently observed in socio-economically disadvantaged schools than in advantaged schools (four fewer students per class), in rural than in urban schools (five fewer students per class), in lower secondary than in upper secondary schools (two fewer students per class), in schools that offer a vocational rather than a general curriculum (two fewer students per class), and in public schools than in private schools (one fewer student per class) (Table V.B1.4.11).
In 45 countries and economies, the average language-of-instruction class was larger in advantaged schools than in disadvantaged schools. In Hungary, Latvia, Moldova and Thailand, language-of-instruction classes in advantaged schools were larger by about 10 students than those in disadvantaged schools. By contrast, in seven countries and economies, namely B-S-J-Z (China), Macao (China), the Philippines, Qatar, Singapore, the United Arab Emirates and the United Kingdom, language-of-instruction classes were smaller in advantaged schools.
On average across OECD countries, attending a language-of-instruction class with one more student was associated with a three-point improvement in reading scores; but after accounting for the socio-economic profile of students and schools, the gain in reading performance amounted to only one score point (Table V.B1.4.11). In 39 countries and economies, students in larger classes performed better than students in smaller classes, after accounting for students’ and schools’ socio-economic profile; but in no country/economy was the difference larger than 5 score points, and in 28 of them the difference amounted to only 2 points or less.
Availability and organisation of career guidance at school
Career guidance is intended to help people, whether students or adults out of school, make choices about their education and occupation, and help them manage their career (OECD, 2004[31]). Career guidance counsellors in the schools that 15-year-olds attend focus mostly on students’ academic pathways and prospects in the labour market; sometimes they also concentrate on students’ social and emotional well-being (Lazarus and Ihuoma, 2011[32]; Hooley, Tristram; Dodd, 2015[33]). Providing career guidance in school may be one way to help all teenagers, whatever their talents and aptitudes, to develop ambitious and realistic expectations about their future (OECD, 2019[34]). Students who receive career counselling focus more on their studies (Rupani, Haughey and Cooper, 2012[35]). Low-achieving and low-income students tend to benefit the most from career counsellors, mainly because these students are most likely to lack other sources of information and assistance (OECD, 2004[31]; Mulhern, 2019[36]). Career guidance could assist in countering gender imbalances in education choices (e.g. which courses students choose to pursue) and future careers (Taranu, Calineci and Taranu, 2014[37]). Regular teachers can also play an important role in career guidance, as students can feel more encouraged and supported by their teachers than by guidance counsellors (Alexitch and Page, 1997[38]).
PISA 2018 asked school principals whether career guidance counselling for 15-year-old students is available at their school and, if so, who had the main responsibility for providing it.
In all countries and economies that participated in PISA 2018, career guidance counselling was available for the majority of 15-year-old students. The only exception was Greece, where about half of students were enrolled in schools whose principal reported that career guidance is not available at their school (Table V.B1.4.13). In 50 countries and economies, career guidance counselling was available for at least 95% of students.
Only about 7% of students were in schools that do not offer career guidance, on average across OECD countries in 2018 (Table V.B1.4.14). However, the share was larger in some countries. In Argentina, Baku (Azerbaijan), Belgium, Brazil, Croatia and Italy, between 25% and 30% of students were in schools that do not offer career guidance, while in Austria, Bosnia and Herzegovina, France, Georgia, Israel, Kosovo, Saudi Arabia and Uruguay, between 16% and 24% of students did not have access to career guidance in school.
The percentage of students in schools whose principal reported that career guidance for 15-year-old students is not available at their school decreased in 13 countries and economies between 2006 and 2018, and increased in 5 countries (Colombia, Croatia, the Czech Republic, Greece and Slovenia). In Macao (China), Qatar, Chinese Taipei and Uruguay, the percentage of students in schools whose principal reported that career guidance is not available decreased by more than 20 percentage points during the period.
1. The socio-economic profile is measured by the PISA index of economic, social and cultural status (ESCS). A socio-economically disadvantaged (advantaged) school is a school in the bottom (top) quarter of the index of ESCS in the relevant country/economy.
Note: Only countries and economies where the share of students in schools where career guidance is not available is at least 1% are shown.
Countries and economies are ranked in descending order of the percentage of students in schools whose principal reported that career guidance for 15-year-olds is not available at their school.
Source: OECD, PISA 2018 Database, Table V.B1.4.14.
Students in advantaged schools were more likely than those in disadvantaged schools to be in a school where career guidance is unavailable, on average across OECD countries and also in 13 countries and economies. Belgium, Bosnia and Herzegovina, France, Greece, Israel, Italy and Switzerland were amongst the countries with the largest socio-economic disparities in access to career guidance in school. By contrast, in 10 countries and economies, students in advantaged schools had greater access to career guidance than those in disadvantaged schools.
On average across OECD countries, students in lower secondary schools (ISCED 2) had greater access to career guidance than students in upper secondary schools (ISCED 3) (Table V.B1.4.15). No differences were observed between students in general and vocational programmes, on average across OECD countries (Table V.B1.4.15).
The most common way to organise career guidance is to have one or more specific career guidance counsellors employed at school. On average across OECD countries, 47% of students attended a school that provides career guidance in this way (Table V.B1.4.13). In Finland, Ireland and Norway, almost all students attended a school with career guidance counsellors employed at school. However, in 43 countries and economies, fewer than one in three students attended a school with career guidance counsellors employed at school.
Assigning the main responsibility for career guidance to specific teachers (OECD average: 39%) or sharing the responsibility for career guidance amongst all teachers in a school (OECD average: 30%) were also common ways to deliver this service. In the Czech Republic, Germany, Hong Kong (China), Japan, Chinese Taipei and Thailand, at least 70% of schools assign the main responsibility for career guidance to specific teachers. Somewhat less common was to have one or more specific career guidance counsellors who regularly visit the school (OECD average: 18%), but this was the main way in which career guidance is provided in Denmark, Estonia and Morocco.
In most countries, career guidance is formally scheduled into students’ time at school, rather than sought voluntarily by students (Table V.B1.4.16). On average across OECD countries, around two in three students in schools that offer career guidance attended a school whose principal reported that career guidance is formally scheduled into students’ time at school; the remaining one-third of students seek career guidance voluntarily in their school, according to the school principal. In 57 education systems, more students were enrolled in schools where career guidance is formally scheduled into students’ time than in schools were it is sought voluntarily. In 21 education systems, more students were in schools where career guidance is sought voluntarily than in schools were it is formally scheduled into students’ time.
The share of students in schools where career guidance is formally scheduled into students’ time increased by 8 percentage points between 2006 and 2018, on average across OECD countries, and in 22 countries and economies; but this share decreased in 4 countries (Bulgaria, Canada, Greece and the Russian Federation) (Table V.B1.4.16).
Career guidance and student outcomes
This section explores how the availability of career guidance at school is related to three different student outcomes: reading performance, education expectations and career expectations. For a more comprehensive analysis of the education and career expectations of 15-year-old students, see PISA 2018 Results (Volume II): Where All Students Can Succeed (OECD, 2019[34]).
Within countries, the relationship between the availability of career guidance at school and student outcomes, such as reading performance or expected levels of educational and occupational attainment, is heterogeneous, depending on the country or economy (Figure V.4.10).
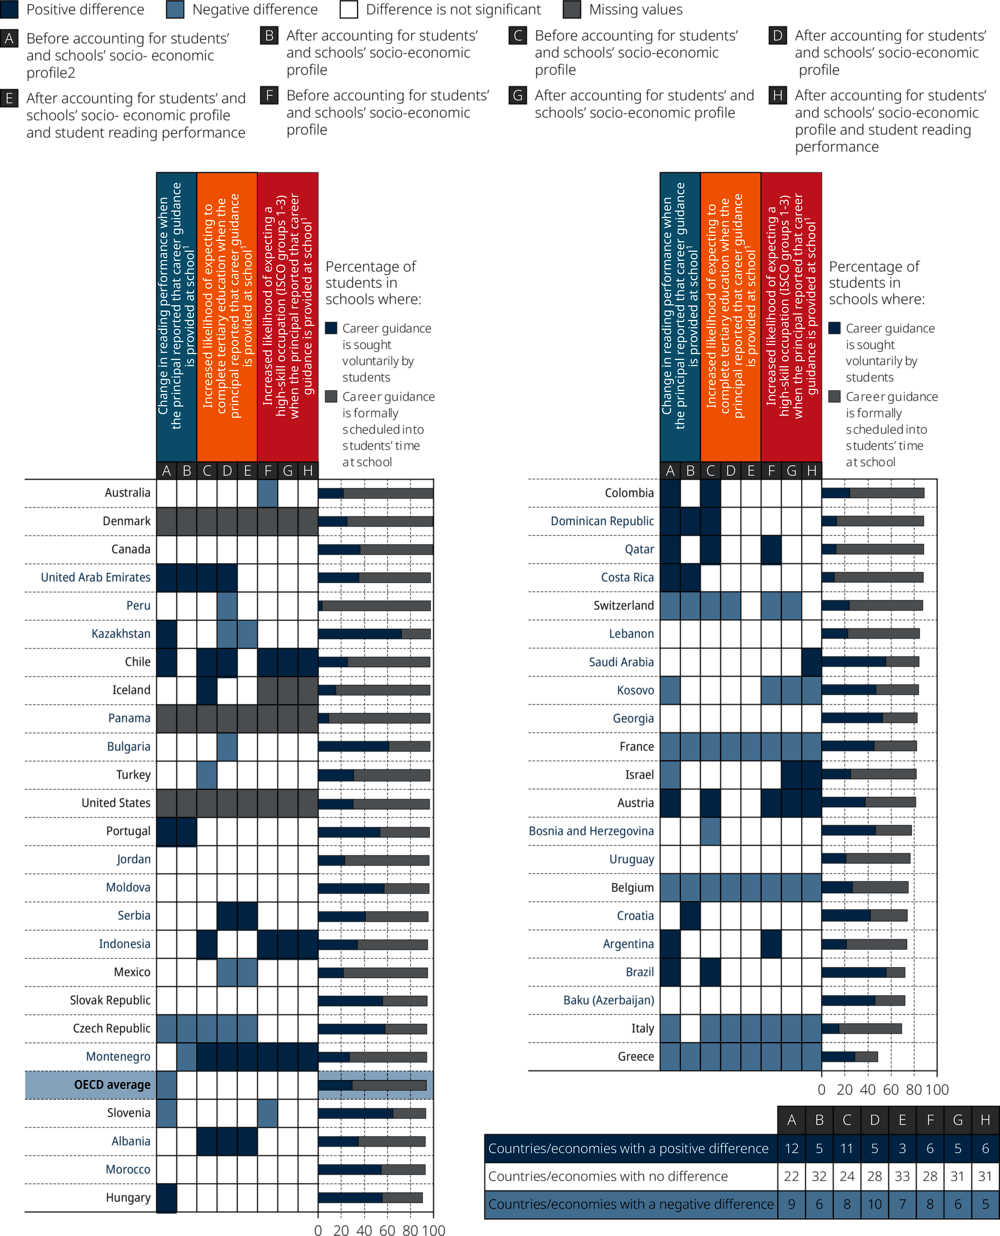
1. This analysis is restricted to schools with the modal ISCED level for 15-year-old students.
2. The socio-economic profile is measured by the PISA index of economic, social and cultural status (ESCS).
Countries and economies are ranked in descending order of the percentage of students in schools whose principal reported that career guidance of 15-year-old students is sought voluntarily by students.
Source: OECD, PISA 2018 Database, Table V.B1.4.13 and Table V.B1.4.17.
In 12 countries and economies, career guidance and reading performance were positively associated; in 9 countries, they were negatively associated (Table V.B1.4.17). After accounting for students’ and schools’ socio-economic profile, in Costa Rica, Croatia, the Dominican Republic, Portugal and the United Arab Emirates, students in schools that offer career guidance scored higher in reading, on average, while in Belgium, the Czech Republic, France, Greece, Montenegro and Switzerland, they scored lower. But in most countries/economies the association was not statistically significant.
In 11 countries, students in schools that offer career guidance were more likely to expect to complete tertiary education than students in schools that do not offer career guidance; but in 8 countries, the opposite was observed (Table V.B1.4.17). After accounting for students’ and schools’ socio-economic profile, in Albania, Chile, Montenegro, Serbia and the United Arab Emirates, students in schools that offer career guidance were more likely to expect to complete tertiary education. In another ten countries (Belgium, Bulgaria, the Czech Republic, France, Greece, Italy, Kazakhstan, Mexico, Peru and Switzerland) students in schools that do not offer career guidance were more likely to expect to complete tertiary education.
Similarly, in six countries, students in schools that offer career guidance were more likely to expect to work in a high-skilled occupation (ISCO groups 1-3), but in eight countries, they were less likely to expect to do so. After accounting for students’ and schools’ socio-economic profile, in five countries students in schools that offer career guidance were more likely to expect to work in a high-skilled occupation, while in six countries, they were less likely to expect to do so.
This section examines whether measures of human resources are related to education outcomes at the system level. Two education outcomes are considered: mean performance in reading and the level of equity in reading performance. As in previous PISA reports, equity in reading performance is measured by the percentage of variation in reading performance accounted for by the variation in students’ socio-economic status; the smaller the variation in performance explained by socio-economic status, the greater the equity in performance (OECD, 2018[39]; OECD, 2019[34]).
Figure V.4.11 shows system-level correlation coefficients between human resources, reading performance and equity in reading performance. Correlational analyses were conducted separately for OECD countries, and for all countries and economies that participated in PISA 2018. In addition, correlations were computed before and after accounting for per capita GDP, to account for the level of economic development of a country/economy.
![Figure V.4.11 [1/2]. Measures of human resources, student performance and equity](images/eps/g04-11-01.png)
1. The percentage of variance in student performance explained by PISA index of economic, social and cultural status was used as measure of inequity in performance. In a first step, the correlation coefficients between measures of vertical stratification and inequity were computed. In a second step, the sign of the correlation coefficients was reversed (i.e. multiplied by -1) to simplify reporting (i.e. report correlation with equity instead of with inequity).
Notes: Only statistically significant coefficients are shown. Values that are statistically significant at the 10% level (p < 0.10) are in italics. All other values are statistically significant at the 5% level (p < 0.05).
Correlation coefficients range from -1.00 (i.e. a perfect negative linear association) to +1.00 (i.e. a perfect positive linear association). When a correlation coefficient is 0, there is no linear relationship between the two measures.
Source: OECD, PISA 2018 Database, Table V.B1.4.18.
![Figure V.4.11 [2/2]. Measures of human resources, student performance and equity](images/eps/g04-11-02.png)
1. The percentage of variance in student performance explained by PISA index of economic, social and cultural status was used as measure of inequity in performance. In a first step, the correlation coefficients between measures of vertical stratification and inequity were computed. In a second step, the sign of the correlation coefficients was reversed (i.e. multiplied by -1) to simplify reporting (i.e. report correlation with equity instead of with inequity).
Notes: Only statistically significant coefficients are shown. Values that are statistically significant at the 10% level (p < 0.10) are in italics. All other values are statistically significant at the 5% level (p < 0.05).
Correlation coefficients range from -1.00 (i.e. a perfect negative linear association) to +1.00 (i.e. a perfect positive linear association). When a correlation coefficient is 0, there is no linear relationship between the two measures.
Source: OECD, PISA 2018 Database, Table V.B1.4.18.
Teacher certification is related to reading performance at the system level. The percentage of teachers fully certified by an appropriate authority was positively correlated with mean performance in reading, even after accounting for per capita GDP, across OECD countries and across all countries (Figure V.4.11). As shown in Figure V.4.12, differences in teacher certification accounted for about 13% of the differences in mean reading performance across all countries and economies.2 This finding is consistent with the school-level analyses that showed a positive association between teacher certification and student achievement, after accounting for students’ and schools’ socio-economic profile, in 12 countries/economies and on average across OECD countries. In six countries/economies, the relationship was negative, and for the remaining countries/economies it was not statistically significant (Table V.B1.4.8).
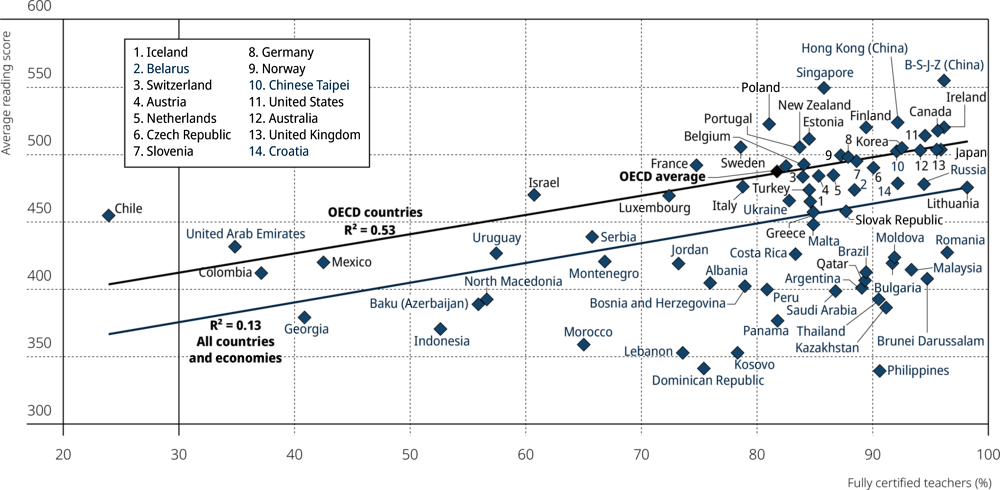
Sources: OECD, PISA 2018 Database, Tables I.B1.4 and V.B1.4.6.
Education systems with smaller language-of-instruction classes generally showed higher mean reading performance than systems with larger classes. There was a negative correlation between larger classes and mean performance in reading, even after accounting for GDP, across OECD countries and across all countries (Figure V.4.11). As shown in Figure V.4.13, differences in class size accounted for about 12% of the differences in mean reading performance across all countries and economies, and 26% of the differences across OECD countries.3,4

Sources: OECD, PISA 2018 Database, Tables I.B1.4 and V.B1.4.11.
However, caution is advised when interpreting this finding. As shown in Figure V.4.13, amongst countries and economies whose mean reading score was higher than 500 points (high performers), a dichotomy was observed between Western countries (i.e. European countries, Australia and Canada) and East Asian countries and economies with regard to class size. While amongst the 11 highest-performing Western countries the size of language-of-instruction classes ranges between 20 students (in Finland) and 27 students per class (in Canada), amongst the seven highest-performing East Asian countries and economies, it ranges between 26 students (in Korea) and 42 students per class in B-S-J-Z (China). Research continues to explore differences in classroom processes and educational context between East Asian and Western countries (Jeynes, 2008[40]; Jerrim, 2015[41]).
Furthermore, system-level findings on class size are in contrast with student-level analysis. As shown earlier in this chapter, in 39 countries/economies and on average across OECD countries, students attending larger language-of-instruction classes scored higher in reading, after accounting for students’ and schools’ socio-economic profile. In 3 countries/economies the relationship was negative, and in 33 countries/economies it was not statistically significant (Table V.B1.4.12). These mixed findings regarding class size suggest that there are important differences in the way class size is implemented in various countries. Further research is required to better understand the relationship between class size and student performance.
At the system level, countries that offer career guidance to a larger share of students generally performed better in PISA. Across OECD countries, even after accounting for per capita GDP, there was a negative correlation between the share of students in schools whose principal reported that career guidance for 15-year-old students is not available at school and mean performance in reading (partial r = -0.32) (Figure V.4.11). Across all PISA-participating countries and economies, the correlation with mean reading performance was statistically significant before accounting for per capita GDP, but not after; yet for mean mathematics performance and mean science performance, it was statistically significant even after accounting for per capita GDP (Table V.B1.4.18).5 However, student-level analyses showed that students in schools that offer career guidance scored higher in reading in only five countries, scored lower in six countries, and in most countries/economies the association was not statistically significant. Thus, further research is required to better understand the relationship between career guidance and student performance.
References
[13] Akiba, M. et al. (2010), “Preparing Teachers for Diversity: Examination of Teacher Certification and Program Accreditation Standards in the 50 States and Washington, DC”, Equity & Excellence in Education, Vol. 43/4, pp. 446-462, https://doi.org/10.1080/10665684.2010.510048.
[38] Alexitch, L. and S. Page (1997), “Evaluation of Academic and Career Counselling Information and Its Relation to Students’ Educational Orientation”, Canadian Journal of Counselling, Vol. 31/3, p. 205.
[11] Atherton, P. and G. Kingdon (2010), The relative effectiveness and costs of contract and regular teachers in India.
[27] Blatchford, P. and A. Russell (2019), “New ways of thinking about research on class size: an international perspective. Introduction to the special section”, International Journal of Educational Research, Vol. 96, pp. 120-124, https://doi.org/10.1016/j.ijer.2018.09.011.
[19] Borko, H., R. Elliot and K. Uchiyama (2000), “Professional development:a key to Kentucky’s educational reform effort”, Teaching and Teacher Education, pp. 969-987.
[18] Borko, H., J. Jacobs and K. Koellner (2010), “Contemporary approaches to teacher professional development”, in International Encyclopedia of Education, Elsevier Ltd, https://doi.org/10.1016/B978-0-08-044894-7.00654-0.
[15] Boyd, D. et al. (2007), The Effect of Certification and Preparation on Teacher Quality.
[5] Clotfelter, C., H. Ladd and J. Vigdor (2006), “Teacher-student matching and the assessment of teacher effectiveness”, Journal of Human Resources, Vol. 41/4, pp. 778-820, https://doi.org/10.3368/jhr.xli.4.778.
[12] Darling-Hammond, L. (2010), “Teacher education and the American future”, Journal of Teacher Education, Vol. 61/1-2, pp. 35-47, https://doi.org/10.1177/0022487109348024.
[20] Darling-Hammond, L., M. Hyler and M. Gardner (2017), Effective Teacher Professional Development.
[29] De Giorgi, G., M. Pellizzari and W. Woolston (2012), “Class size and class heterogeneity”, Journal of the European Economic Association, Vol. 10/4, pp. 795-830, https://doi.org/10.1111/j.1542-4774.2012.01073.x.
[24] Dynarski, S., J. Hyman and D. Schanzenbach (2013), “Experimental Evidence on the Effect of Childhood Investments on Postsecondary Attainment and Degree Completion”, Journal of Policy Analysis and Management, Vol. 32/4, pp. 692-717, https://doi.org/10.1002/pam.21715.
[28] Finn, J. and C. Achilles (1999), “Tennessee’s Class Size Study: Findings, Implications, Misconceptions”, Educational Evaluation and Policy Analysis, Vol. 21/2, p. 97, https://doi.org/10.2307/1164294.
[23] Finn, J., G. Pannozzo and C. Achilles (2003), The “Why’s” of Class Size: Student Behavior in Small Classes.
[25] Fredriksson, P., B. Öckert and H. Oosterbeek (2013), “Long-Term effects of class size”, Quarterly Journal of Economics, Vol. 128/1, pp. 249-285, https://doi.org/10.1093/qje/qjs048.
[14] Goldhaber, D. and D. Brewer (2000), “Does Teacher Certification Matter? High School Teacher Certification Status and Student Achievement”, Educational Evaluation and Policy Analysis, doi: 10.3102/01623737022002129, pp. 129-145, https://doi.org/10.3102/01623737022002129.
[33] Hooley, Tristram; Dodd, V. (2015), “The economic benefits of career guidance”, Careers England, http://hdl.handle.net/10545/559030.
[10] Jameson, J. and Y. Hillier (2008), “’Nothing will prevent me from doing a good job’. the professionalisation of part-time teaching staff in further and adult education”, Research in Post-Compulsory Education, Vol. 13/1, pp. 39-53, https://doi.org/10.1080/13596740801903521.
[6] Jennings, J. and T. DiPrete (2010), “Teacher Effects on Social and Behavioral Skills in Early Elementary School”, Sociology of Education, Vol. 83/2, pp. 135-159, https://doi.org/10.1177/0038040710368011.
[41] Jerrim, J. (2015), “Why do East Asian children perform so well in PISA? An investigation of Western-born children of East Asian descent”, Oxford Review of Education, Vol. 41/3, pp. 310-333, https://doi.org/10.1080/03054985.2015.1028525.
[40] Jeynes, W. (2008), “What We Should and Should Not Learn From the Japanese and Other East Asian Education Systems”, https://doi.org/10.1177/0895904807310042.
[32] Lazarus, K. and C. Ihuoma (2011), “The Role Of Guidance Counsellors In The Career Development Of Adolescents And Young Adults With Special Needs”, British Journal of Arts and Social Sciences, Vol. 2/1, pp. 2046-9578, http://www.bjournal.co.uk/BJASS.aspx.
[21] Lumpe, A. et al. (2012), “Beliefs about Teaching Science: The relationship between elementary teachers’ participation in professional development and student achievement”, International Journal of Science Education, Vol. 34/2, pp. 153-166, https://doi.org/10.1080/09500693.2010.551222.
[36] Mulhern, C. (2019), “Beyond Teachers: Estimating Individual Guidance Counselor’s Effects on Educational Attainment”, Harvard University, https://www.schoolcounselor.org/asca/media/asca/.
[4] Nye, B., S. Konstantopoulos and L. Hedges (2004), “How Large Are Teacher Effects?”, Educational Evaluation and Policy Analysis Fall, Vol. 26/3, pp. 237-257.
[22] OECD (2019), Education at a Glance 2019: OECD Indicators, OECD Publishing, Paris, https://dx.doi.org/10.1787/f8d7880d-en.
[34] OECD (2019), PISA 2018 Results (Volume II): Where All Students Can Succeed, PISA, OECD Publishing, Paris, https://dx.doi.org/10.1787/b5fd1b8f-en.
[8] OECD (2019), PISA 2018 Results (Volume III): What School Life Means for Students’ Lives, PISA, OECD Publishing, Paris, https://dx.doi.org/10.1787/acd78851-en.
[9] OECD (2019), Working and Learning Together: Rethinking Human Resource Policies for Schools, OECD Reviews of School Resources, OECD Publishing, Paris, https://dx.doi.org/10.1787/b7aaf050-en.
[39] OECD (2018), Equity in Education: Breaking Down Barriers to Social Mobility, PISA, OECD Publishing, Paris, https://dx.doi.org/10.1787/9789264073234-en.
[16] OECD (2016), Supporting Teacher Professionalism: Insights from TALIS 2013, TALIS, OECD Publishing, Paris, https://dx.doi.org/10.1787/9789264248601-en.
[30] OECD (2014), PISA 2012 Results: Students and Money (Volume VI): Financial Literacy Skills for the 21st Century, PISA, OECD Publishing, Paris, https://dx.doi.org/10.1787/9789264208094-en.
[7] OECD (2013), Synergies for Better Learning: An International Perspective on Evaluation and Assessment, OECD Reviews of Evaluation and Assessment in Education, OECD Publishing, Paris, https://dx.doi.org/10.1787/9789264190658-en.
[2] OECD (2010), “Effective teachers and trainers”, in Learning for Jobs, OECD Publishing, Paris, https://dx.doi.org/10.1787/9789264087460-6-en.
[17] OECD (2009), Creating Effective Teaching and Learning Environments: First Results from TALIS, TALIS, OECD Publishing, Paris, https://dx.doi.org/10.1787/9789264068780-en.
[1] OECD (2005), Teachers Matter: Attracting, Developing and Retaining Effective Teachers, Education and Training Policy, OECD Publishing, Paris, https://dx.doi.org/10.1787/9789264018044-en.
[31] OECD (2004), Career guidance and public policy : bridging the gap., Organisation for Economic Co-operation and Development.
[3] Rockoff, J. (2004), “The Impact of Individual Teachers on Student Achievement: Evidence from Panel Data”, The American Economic Review, Vol. 94/2, pp. 247-252, http://www.jstor.org/stable/3592891.
[35] Rupani, P., N. Haughey and M. Cooper (2012), “The impact of school-based counselling on young people’s capacity to study and learn”, British Journal of Guidance and Counselling, Vol. 40/5, pp. 499-514, https://doi.org/10.1080/03069885.2012.718733.
[37] Taranu, A., M. Calineci and A. Taranu (2014), “Diversity Management, Gender Approaches to Guidance and Counselling”, Journal of Research in Gender Studies, Vol. 4, https://heinonline.org/HOL/Page?handle=hein.journals/jogenst4&id=1080&div=&collection=; (accessed on 2 March 2020).
[26] Woessmann, L. and M. West (2005), “Class-Size Effects in School Systems Around the World: Evidence from Between-Grade Variation in TIMSS”, SSRN Electronic Journal, https://doi.org/10.2139/ssrn.308559.
Notes
← 1. According to school principals in France in 2018, 84% of teachers in advantaged schools were certified while only 70% of teachers in disadvantaged schools were. This discrepancy could partly be explained by the fact that vocational schools are over-represented amongst socially disadvantaged schools. The teachers in these schools should hold a specific diploma (CAPLP). In considering level of education, the proportions of teachers with at least a master’s degree are similar in advantaged and disadvantaged schools: around two teachers in five have at least such a level of qualification.
← 2. The correlation coefficient between the share of fully certified teachers and mean reading performance was higher across OECD countries (r = 0.73; partial r after accounting for per capita GDP = .0.68) than across all countries (r = 0.37; partial r = 0.25) (Figure V.4.11). However, across OECD countries the correlation was highly influenced by only three cases (Chile, Colombia and Mexico) with a comparatively small share of fully certified teachers. To ensure that these outliers were not driving the findings, the correlation was conducted again without including countries where less than 45% of teachers were fully certified, namely Chile, Colombia, Georgia, Mexico and the United Arab Emirates. For OECD countries, the correlation without outliers weakened but remained statistically significant and similar in strength to the correlation across all countries (r = 0.40; partial r = 0.41). For all countries and economies, the correlation without outliers did not change much with respect to the correlation with all countries/economies (r = 0.40; partial r = 0.25). Source: OECD, PISA 2018 Database, Tables V.B1.4.6, I.B1.4 and II.B1.2.3.
← 3. The negative correlation between the size of language-of-instruction class and mean reading performance was stronger or as strong across OECD countries (r= -0.51; partial r after accounting for per capita GDP = -0.40) as across all countries (r = -0.34; partial r = -0.39) (Figure V.4.11). However, across OECD countries the correlation was influenced by two countries (Mexico and Turkey) that have comparatively large classes. To ensure that these outliers were not driving the findings, the correlation was conducted again without including countries/economies where classes were larger than 40 students, namely B-S-J-Z (China), Mexico, the Philippines and Turkey. For OECD countries, the correlation without outliers weakened but remained statistically significant before accounting for per capita GDP (r = -0.35); however, the partial correlation after accounting for per capita GDP was not statistically significant (partial r = -0.25; p = 0.14). For all countries and economies, the correlation without outliers was stronger than or similar to the correlation with all countries/economies (r = -0.40; partial r = -0.40). Source: OECD, PISA 2018 Database, Tables V.B1.4.11, I.B1.4 and II.B1.2.3.
← 4. The negative correlation between the size of language-of-instruction class and mean reading performance was not influenced by enrolment in upper secondary education. After accounting for the percentage of students enrolled in upper secondary education, the partial correlation coefficient remained statistically significant across OECD countries (partial r = -0.46), and across all countries/economies (partial r = -0.32).
← 5. Changes between 2006 and 2018 in the unavailability of career guidance were significantly correlated with changes in mean reading performance, across all countries and economies (Table V.B1.4.19). However, the association was entirely driven by only 4 countries/economies where the percentage of students in schools whose principal reported that career guidance for 15-year-old students is not available at school increased or decreased by 30 percentage points or more (Table V.B1.4.14). After dropping these cases, the association was not statistically significant.