copy the linklink copied!Doctors (by age, sex and category)
In 2017, more than one third of all doctors in OECD countries were over 55 years of age, up from one-fifth in 2000 (Figure 8.5). The share of doctors over 55 increased in all countries between 2000 and 2017%.
While some countries saw only a small increase, such as Norway (+2 percentage points), Australia (+3 percentage points), and the United Kingdom (+4 percentage points), others saw a dramatic ageing of their medical workforce. In Italy, the share of older doctors increased by 36%, with 55% of all doctors aged 55 or over by 2017. In France the doctor population is ageing almost as rapidly, with a 30% increase in older doctors between 2000 and 2017; other countries such as Israel, Spain and Austria are not far behind (Figure 8.5).
Ageing of the medical workforce is a concern, as doctors aged 55 and over are generally expected to retire in the following decade and need to be replaced in order to prevent a decline in overall physician numbers. Many doctors do keep working beyond age 65, and several OECD countries have reformed their pension systems and increased the retirement age to take into account the longer average life expectancy (OECD, 2016[1]). While few studies have examined the impact of these pension reforms specifically on doctors, it is possible that such steps will prolong the working lives of doctors, which could have a significant impact on future replacement needs.
In 2017 almost half of all doctors in OECD countries were female, at between one-third and two-thirds of all doctors in most OECD countries. In some countries, the gender balance was skewed more dramatically: in Japan and Korea only one-fifth of doctors were women in 2017, while in Latvia and Estonia three quarters of doctors were female (Figure 8.6). In most OECD countries the share of female doctors increased between 2000 and 2017, while in countries such as Lithuania, Estonia and Latvia – which traditionally have far more female than male doctors – the ratio of male-to-female doctors remained stable. The most significant increases in the share of female doctors were reported for the Netherlands (+19 percentage points) and Spain (+18 percentage points). In countries where the number of female doctors has increased, this is probably driven by rising female labour force participation and higher numbers of young women enrolling in medical school, but may also be affected by the retirement of older and more commonly male generations of doctors.
Up to and including the 2015 issue of Health at a Glance, the category ‘generalist’ did not distinguish between general practitioners/family doctors and non-specialised physicians who work in hospitals and other settings. It is now possible to distinguish between these two categories of phyisicans, and as of 2017, general practitioners/family doctors represented 23% of all physicians. The share of general practitioners/family doctors as a percentage of all doctors ranged from around half in Chile, Canada and Portugal, to just 5% in Greece and Korea (Figure 8.7). The numbers of generalists remains difficult to compare, however, due to variation between countries in the ways doctors are categorised. For example, in the United States, general internal medicine doctors often play a role similar to that of general practitioners/family doctors in other countries, yet they are categorised as specialists. In other countries, such as Japan, general practitioners/family doctors are very uncommon, and the majority of physician consultations are with specialists.
In many countries, general practitioners/family doctors play a key role in guaranteeing good access to health care, managing chronic conditions and keeping people out of hospital (see indicator on “Avoidable hospital admissions” in Chapter 6). Accordingly, many countries have taken steps to increase the number of training places in general medicine in response to concerns about shortages of general practitioners. However, in most OECD countries, specialists earn more than general practitioners, which provides financial incentives for doctors to specialize (see indicator on the “Remuneration of doctors”).
The definition of doctors is provided under the previous indicator. In some countries, the data are based on all doctors licensed to practice, not only those practising (Chile, Greece and Portugal; and also Israel and New Zealand for doctors by age and gender). Not all countries are able to report all their physicians in the two broad categories of specialists and generalists. This may be due to the fact that specialty-specific data are not available for doctors in training or for those working in private practice. A distinction is made in the generalists category between general practitioners/family doctors and non-specialist doctors working in hospital or in other settings. In Switzerland, general internal medicine doctors and other generalists are included under general practitioners.
References
[1] OECD (2016), Health Workforce Policies in OECD Countries: Right Jobs, Right Skills, Right Places, OECD Health Policy Studies, OECD Publishing, Paris, https://dx.doi.org/10.1787/9789264239517-en.
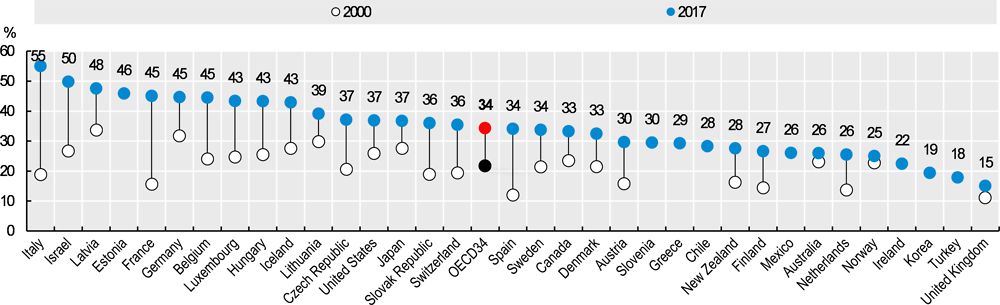
Source: OECD Health Statistics 2019.
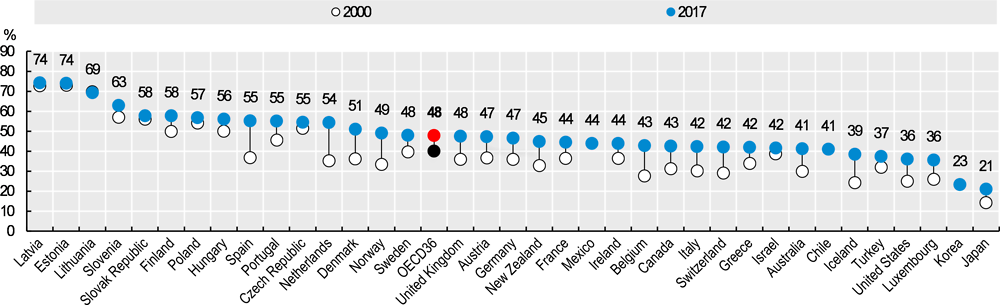
Source: OECD Health Statistics 2019.
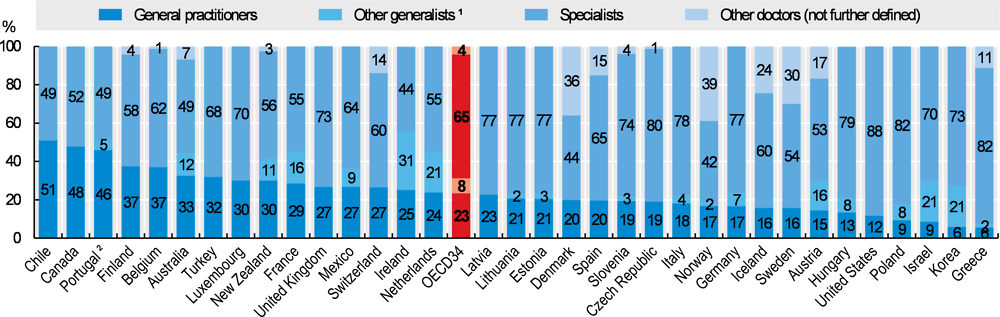
1. Includes non-specialist doctors working in hospital and recent medical graduates who have not yet started post-graduate specialty training. 2. In Portugal, only about 30% of doctors employed by the public sector work as GPs in primary care, the other 70% work in hospitals.
Source: OECD Health Statistics 2019.
Metadata, Legal and Rights
https://doi.org/10.1787/4dd50c09-en
© OECD 2019
The use of this work, whether digital or print, is governed by the Terms and Conditions to be found at http://www.oecd.org/termsandconditions.