
General government expenditures
Governments are responsible for the provision of various goods and services to their populations. Some of these are under their exclusive jurisdiction, for example the justice system, whereas others, like healthcare, may be provided by both government and private entities. In addition to providing services, governments also strive to redistribute income across society, through social benefits and subsidies. The level of public provision of goods and services varies significantly between countries depending on their policy choices, current priorities and their political systems and traditions. Across OECD countries, government expenditures are primarily allocated to the provision of public services and income transfers. Government expenditures tend to be more stable over time than government revenues, which are more dependent on economic cycles. Through public spending, governments provide people with a reliable safety net, guaranteeing them certain entitlements and protecting them from economic fluctuations.
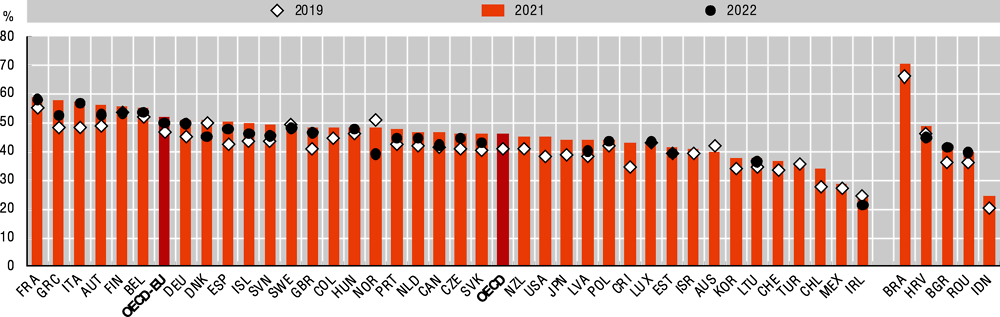
General government expenditures amounted to 46.3% of GDP on average across OECD countries in 2021. France (59.1%), Greece (57.7%) and Italy (57.3%) were the countries with the largest share of government expenditures relative to GDP. Between 2019 and 2021 general government expenditures as a percentage of GDP increased by 5.4 percentage points, from 40.9% in 2019 (Figure 11.1). This increase is largely explained by the COVID-19 pandemic, which led to significant economic disruption. This prompted large-scale fiscal stimuluses, including increased spending on healthcare, social welfare programmes, and support for businesses and individuals affected by the pandemic, while at the same time GDP was falling.
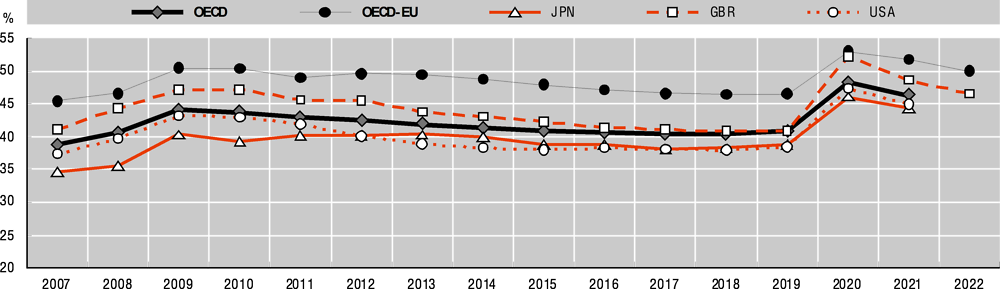
Government expenditures peaked in 2020 in the OECD and the largest OECD economies due to the COVID-19 pandemic (48.4% of GDP on average across OECD countries) and fell in 2021 and 2022. However, levels are still much higher than they were before COVID-19 (Figure 11.2). In 35 out of 38 OECD countries, government expenditures as a percentage of GDP increased between 2019 and 2021, with Greece (9.6 p.p.) and Italy (8.8 p.p.) reporting the largest increases. Between 2021 and 2022 public spending decreased as a share of GDP in 26 out of 27 countries with available data; the exception was Luxembourg, where it increased by 0.4 p.p. (Figure 11.1).
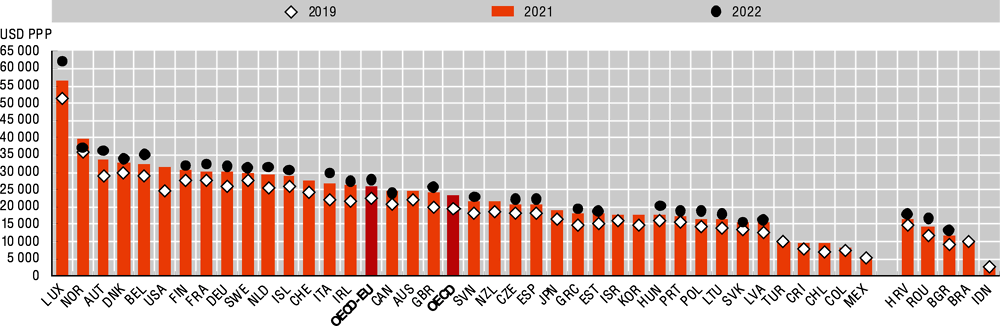
In 2021, across OECD countries, general government spending per capita averaged USD 23 432 PPP, ranging from USD 5 637 PPP in Mexico to USD 56 357 PPP in Luxembourg. Between 2019 and 2021 spending per capita increased on average by USD 3 695 PPP. The largest increases occurred in the United States (USD 6 663 PPP) and Luxembourg (USD 4 925 PPP) (Figure 11.3).
The annual growth rate of real government expenditure per capita was 12.5% on average across OECD countries in 2020. The growth rate slowed in 2021 to 0.64% on average, much smaller than in 2020. Among countries with available data, spending per capita started falling in 2022: 21 of 27 countries reported negative growth, with Norway recording the biggest downturn (-17.0%) (Online Figure G.6.1).
Methodology and definitions
General government expenditures data are from the OECD National Accounts Statistics (database), which are based on the System of National Accounts (SNA), a set of internationally agreed concepts, definitions, classifications and rules for national accounting. The 2008 SNA framework has been implemented by all OECD countries (see Annex C for details on reporting systems and sources). In SNA terminology, general government consists of central, state and local governments and social security funds. Expenditures encompass intermediate consumption, compensation of employees, subsidies, property income (including interest spending), social benefits, other current expenditures (mainly current transfers) and capital expenditures (capital transfers and investments). Gross domestic product (GDP) is the standard measure of the value of the goods and services produced by a country during a period. Government expenditures per capita were calculated by converting total government expenditures to USD using the OECD/Eurostat purchasing power parities (PPP) for GDP and dividing by population of the country. PPP is the number of units of country B’s currency needed to buy the same quantity of goods and services in country A.
Further reading
OECD (2023), OECD Economic Outlook, Interim Report March 2023: A Fragile Recovery, OECD Publishing, Paris, https://doi.org/10.1787/d14d49eb-en.
Figure notes
Data for Chile and Türkiye are not included in the OECD average.
11.1 and 11.3. Data for Türkiye, Brazil and Indonesia are for 2020 rather than 2021.
G.6.1 (Annual growth rate of real government expenditures per capita, 2019-20, 2020-21 and 2021-22) is available online in Annex G.
Source: OECD National Accounts Statistics (database).
Source: OECD National Accounts Statistics (database).
Source: OECD National Accounts Statistics (database).