copy the linklink copied!Doctors (overall number)
Across OECD countries in 2017 the number of doctors ranged from 2.5 or less per 1 000 population in Turkey, Korea, Poland, Mexico, Japan and Chile, to five or more in Portugal, Austria, and Greece. However, numbers in Portugal and Greece are over-estimated as they include all doctors licensed to practise. On average, there were 3.5 doctors per 1 000 population (Figure 8.3). In Indonesia, India and South Africa there were significantly fewer doctors per 1 000 population – less than one – while in China the number of doctors increased rapidly from 1.25 per 1 000 population in 2000 to 2 per 1 000 population in 2017.
Targeted education and training policies, as well as greater retention rates and in some countries immigration of doctors, have meant that both the absolute and per capita numbers of doctors have increased in almost all OECD countries since 2000. The only exception is Israel, where a 25% increase in the absolute number of doctors was still not enough to keep pace with total population growth of about 40% between 2000 and 2017. Overall, in most OECD countries the number of doctors increased steadily between 2000 and 2017, and did not appear vulnerable to external shocks. However, the 2008-09 recession had a profound impact in Greece, where the number of doctors increased until 2008 before stagnating from 2012.
In some countries there were particularly rapid expansions in the number of doctors between 2000 and 2017 (Figure 8.4). This was the case in Korea, Mexico and the United Kingdom, where despite outpacing average per capita growth in doctors, there were still fewer doctors per 1 000 than the OECD average in 2017. In other countries, such as Australia,Denmark and Austria, increases both outpaced OECD average growth, and left these countries with more doctors per capita than the OECD average. In Australia, where the number of doctors per capita went from below the OECD average in 2000, to above it in 2017, this increase was driven by a significant rise in the number of graduates from domestic medical education programmes (see indicator on “Medical graduates”).
At the other end of the spectrum, the number of doctors per capita grew much more slowly or remained stable since 2000 in Belgium, France, Poland, and the Slovak Republic. In these four countries, the number of domestic students admitted to medical schools has increased in recent years. This should contribute towards replacing those doctors who will be retiring in the coming years, as long as new doctors end up working in their country of training (OECD, 2019[1]).
Concerns about shortages of health professionals are not new in OECD countries, but these concerns have grown in many countries, especially as the “baby-boom” generation of doctors and nurses starts to retire. Over the past decade, concerns about the ageing medical workforce moving towards retirement have prompted many OECD countries to increase the number of students in medical and nursing education programmes (OECD, 2016[2]). While some countries, such as Australia, have already started to see the benefits of earlier increases in medical education places, the long duration of doctors’ training means that it takes a decade or more to feel the impact of increasing intake into medical education.
In most OECD countries, there are also concerns about shortages of general practitioners (see the indicator on “Doctors by age, sex and category”) and an undersupply of doctors in rural and remote regions (see the indicator on “Geographic distribution of doctors” in Chapter 5). These issues have been driven or exacerbated by the ageing of general practitioners and of the population in general.
The data for most countries refer to practising doctors, defined as the number of doctors providing care directly to patients. In many countries, the numbers include interns and residents (doctors in training). The numbers are based on head counts. The Slovak Republic and Turkey also include doctors who are active in the health sector even though they may not provide direct care to patients, adding another 5-10% of doctors. Chile, Greece and Portugal report the number of physicians entitled to practice, resulting in an even larger over-estimation of the number of practising doctors. Belgium sets a minimum threshold of activities for general practitioners to be considered to be practising (500 consultations per year), thereby resulting in an under-estimation compared with other countries that do not set such minimum thresholds. Data for India may be over-estimated as they are based on medical registers that are not updated to account for migration, retirement or death; nor do they take into account doctors registered in multiple states.
References
[1] OECD (2019), Recent Trends in International Migration of Doctors, Nurses and Medical Students, OECD Publishing, Paris, https://dx.doi.org/10.1787/5571ef48-en.
[2] OECD (2016), “Education and training for doctors and nurses: What’s happening with numerus clausus policies?”, in Health Workforce Policies in OECD Countries: Right Jobs, Right Skills, Right Places, OECD Publishing, Paris, https://dx.doi.org/10.1787/9789264239517-6-en.
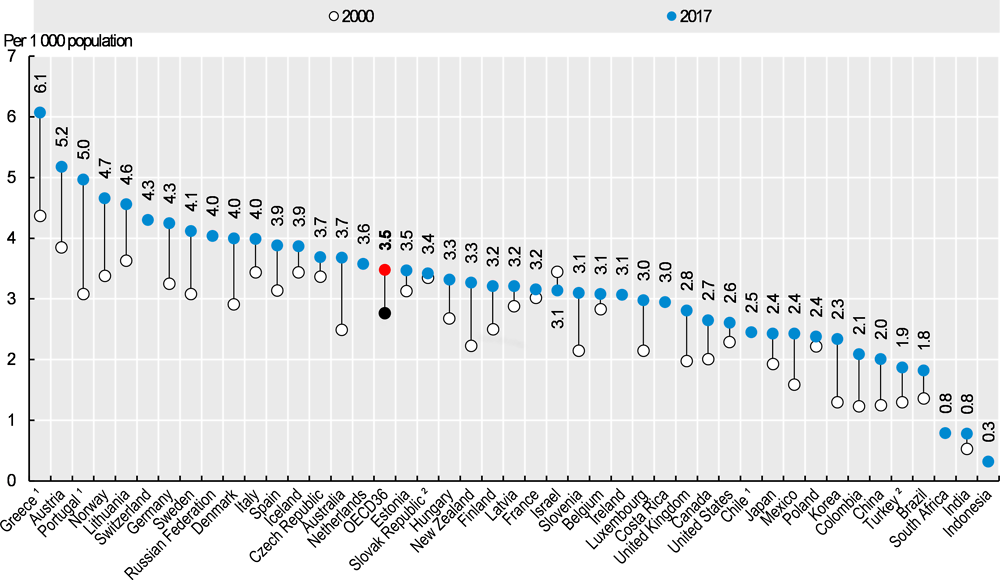
1. Data refer to all doctors licensed to practice, resulting in a large over-estimation of the number of practising doctors (e.g. of around 30% in Portugal). 2. Data include not only doctors providing direct care to patients but also those working in the health sector as managers, educators, researchers, etc. (adding another 5-10% of doctors).
Source: OECD Health Statistics 2019.
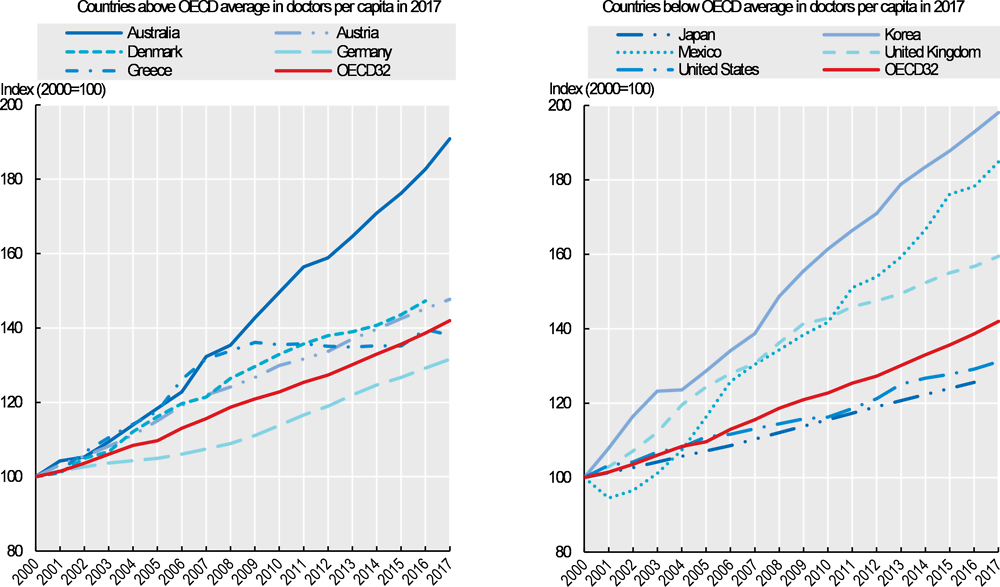
Source: OECD Health Statistics 2019.