
Annex B. Methodology of the SIGI
The Social Institutions and Gender Index (SIGI) measures discriminatory social institutions in key areas that affect women’s and girls’ lives. Produced by the Development Centre of the Organisation for Economic Co-operation and Development (OECD) since 2009, the SIGI documents the persistence and prevalence of gender discrimination across countries at different stages of development. The SIGI aims to support policy making by providing quality data to policy and decision makers, experts and researchers, international and philanthropic organisations, as well as the public at large.
The SIGI is a composite index that builds on a framework of 4 dimensions, 16 indicators and 25 underlying variables (for the fifth edition) (Figure A B.1).
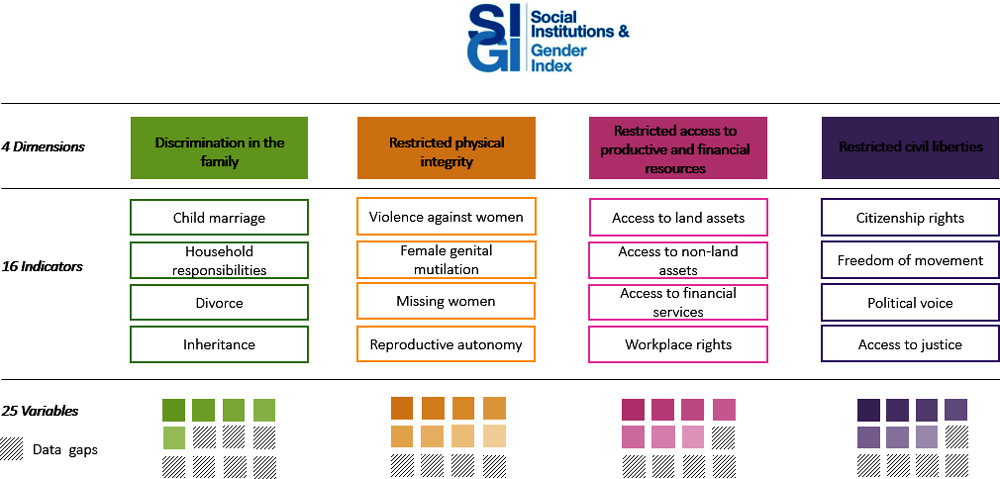
The four dimensions of the SIGI cover the major socio-economic areas that affect women and girls throughout their lifetime:
The “Discrimination in the family” dimension captures social institutions that limit women’s decision-making power and undervalue their status in the household and the family.
The “Restricted physical integrity” dimension captures social institutions that increase women’s and girls’ vulnerability to multiple forms of violence and limit their control over their bodies and reproductive autonomy.
The “Restricted access to productive and financial resources” dimension captures women’s restricted access to and control over critical productive and economic resources and assets.
The “Restricted civil liberties” dimension captures discriminatory social institutions restricting women’s access to, and participation and voice in, the public and social spheres.
Variables included in the SIGI conceptual framework
Each dimension of the SIGI comprises four indicators (Figure A B.1). Theoretically, each indicator builds on three variables. The first variable aims to measure the level of discrimination in formal and informal laws, while the second and the third variables aim to measure the level of discrimination in social norms and practices:
Legal variables describe the level of gender-based discrimination in legal frameworks. Data for these variables are collected by the OECD Development Centre via a legal questionnaire (the SIGI 2023 Legal Survey) consisting of 173 questions. The survey was first filled by legal experts and professional lawyers from national and international law firms, before being reviewed by the Gender team of the OECD Development Centre and sent to governments for validation of the data. The cut-off date for the legal information collected was 31 August 2022.
Attitudinal variables describe the level of discrimination in social norms. Data for these variables are compiled from secondary data sources. The cut-off date for the attitudinal data was 31 December 2022.
Practice variables describe the level of discrimination in terms of prevalence and parity. Data for these variables are compiled from secondary data sources. The cut-off date for the practice data was 31 December 2022.
Treatment of missing data
In theory, the computation of the SIGI should be based on 48 variables (16 indicators each composed of 3 variables). However, because of data gaps, discrepancies exist between the conceptual framework and the number of variables used to calculate the SIGI. In total, the fifth edition of the SIGI in 2023 is based on 25 variables – including 15 legal variables, 9 practice variables and 1 attitudinal variable (Table A B.1). These variables were selected based on the following criteria:
Conceptual relevance: The variable should be closely related to the conceptual framework of discriminatory social institutions and measure what it is intended to capture.
Underlying factor of gender inequality: The variable should capture an underlying factor that leads to unequal outcomes for women and men.
Data quality, reliability, and coverage: The variable should be based on high-quality, reliable data. Ideally, the data should be standardised across countries/territories and have extensive coverage across countries/territories.
Distinction: Each variable should measure a distinct discriminatory institution and should add new information not measured by other variables.
Statistical association: Variables included in the same dimension should be statistically associated, and thereby capture similar areas of social institutions without being redundant.
Variables that measure important concepts covered by the SIGI but that could not be used to calculate the SIGI because of their low geographical coverage, are featured in the Gender, Institutions and Development Database (GID-DB). The GID-DB is a repository of legal, attitudinal and practice data measuring gender-based discrimination. For the fifth edition of the SIGI, this database includes 53 variables, including the 25 variables used to compute the SIGI (Table A B.1).
Geographical coverage of the fifth edition of the SIGI
For the fifth edition of the SIGI, the OECD Development Centre collected data for 179 countries.
Legal data cover 178 countries. Following the takeover of Afghanistan by the Taliban in August 2021, available legal sources were no longer valid, and no comprehensive and reliable legal sources could be found to assess the new legal framework of the country. Nevertheless, attitudinal and practice variables for Afghanistan were collected and included in the GID-DB.
The coverage of attitudinal and practice data varies for each variable.
Because of data gaps in one or more of the 25 variables used to compute the SIGI, SIGI scores could not be calculated for 39 countries (Table A B.2). In other words, a full set of data for the 10 attitudinal and practice variables included in the computation of the SIGI is available for 140 countries (78% of the total number of countries included in the GID-DB).
The regional coverage of the GID-DB and the SIGI is as follow:
The statistical methodology of the SIGI consists in aggregating the levels of discrimination as measured by the variables into 16 indicators, which are in turn aggregated into 4 dimensions. These 4 dimensions are then aggregated into the SIGI score. At each stage of the aggregation process, the same aggregation formula is used.
The current methodology was developed in 2017 following an extensive process of consultation with gender and statistical experts and was first applied for the fourth edition of the SIGI published in 2019 (Ferrant, Fuiret and Zambrano, 2020[18]). In 2020, the methodology was reviewed during an Expert Group Meeting, and an internal quality review was undertaken in 2021 with the support of OECD’s Statistics and Data Directorate. The fifth edition of the SIGI in 2023 is the second time this methodology is applied.
Data cleaning and manipulation
The SIGI relies on secondary data for the attitudinal and practice variable with varying data sources depending on the country/territory and the variable in question.
To ensure comparability across countries and adherence to the SIGI framework, quantitative data are first cleaned. This includes, for instance, ensuring that the population base is the same, or ensuring that the most recent datapoint is selected when relying on data from various sources.
In order to fit the SIGI scale that ranges from 0 to 100, with 0 being the best outcome and 100 being the worst, all quantitative variables are rescaled following a min-max normalisation process, which varies depending on the type of variable.
Variables measuring absolute levels of women’s deprivation: These variables do not have a male counterpart. Examples include the prevalence rate of female genital mutilation or the share of women facing unmet needs for family planning. These variables are expressed so that 0% corresponds to the best outcome for women – e.g. no women having experienced female genital mutilation – and 100% as the worst possible outcome for women – e.g. all women of reproductive age who want to delay a pregnancy with unmet needs for family planning.
Variables measuring relative levels of achievement or deprivation of women compared to men as the fraction of women among a particular sub-population: For these variables, the best possible outcome is 50%, indicating equality between men and women. These variables are capped at 50% and rescaled following a min-max normalisation process so that scores range from 0 to 100 with 0 being the best outcome for gender equality and 100 the worst possible outcome.
Case 1: The worst possible outcome is 100%, indicating that women account for the entire population deprived or facing discrimination. In this case, discrimination exists as long as women’s share is above 50%. No penalties are applied if women perform better than men and if their share drops below 50%. Examples include the gender gap in safety feeling, i.e. the share of women among those not feeling safe when walking alone at night, or the gender gap in bank account ownership, i.e. the share of women among bank account owners.
Case 2: The worst possible outcome is 0%, indicating that women account for the entire population deprived or facing discrimination. In this case, discrimination exists as long as women’s share is below 50%. No penalties are applied if women perform better than men and if their share exceeds 50%. Examples include the gender gap in management positions or among members of national parliaments.
Variables measuring the relative levels of achievement or deprivation of women compared to men as the female-to-male ratio: These variables are calculated as the value for women divided by the value for men. For these variables, the best possible outcome is 1, indicating equality between men and women. The worst possible outcome is the maximum value of the ratio across all countries covered. These variables are capped at 1, meaning that discrimination exists as long as the female-to-male ratio is above 1. No penalties are applied if women perform better than men and if the ratio drops below 1. These variables are rescaled following a min-max normalisation process so that scores range from 0 to 100 with 0 being the best outcome for gender equality and 100 the worst possible outcome. Examples include the boy-to-girl ratio where, because the natural birth ratio stands at 105 boys per 100 girls, the variable is capped at 105.
The SIGI relies on primary data collection for the legal variables, measuring gender-based discrimination in formal and informal laws. The SIGI 2023 Legal Survey consists of 173 questions, among which 114 are used to create the legal variables (see Annex C).
The information captured by the SIGI 2023 Legal Survey is encoded to build 15 legal variables across each indicator of the SIGI conceptual framework – the only indicator that does not have a legal variable is the Missing women indicator as there are no laws that can be measured for this type of discrimination against girls.
A coding manual was created to quantify the level of legal discrimination based on the information collected via the SIGI 2023 Legal Survey. The coding manual ensures consistency across variables, guarantees objectivity in the selection criteria for scoring, and allows for comparability across countries as well as over time. A five-level classification (0, 25, 50, 75 and 100) serves as the basis to encode the legal information and reflects the level of discrimination in formal and informal laws: 0 denotes equal legal protections between women and men, without legal or customary exceptions, and 100 denotes a legal framework that fully discriminates against women’s and girls’ rights (Table A B.3).
Scores of legal variables take into account all applicable legal frameworks in the country whether formal or informal, including those that may only apply to part of the population. In many countries across the world, parallel, dual, plural or federal legal frameworks exist, all of which can further co-exist with informal law and justice systems. The SIGI methodology takes this legal plurality into account by assessing whether all women have the same rights under the respective applicable formal laws. The SIGI methodology further assesses whether informal laws create exceptions to the formal law(s).
Construction of indicators, dimensions and the SIGI
Following the cleaning and rescaling of attitudinal and practice data, as well as the encoding of legal data, quantitative and qualitative variables are grouped into a unique database, which serves to build the indicators, dimensions and the SIGI.
The computation of the SIGI relies on the use of the same formula in three different stages to aggregate variable into indicators, indicators into dimensions and dimensions into the SIGI. The formula was developed in 2017, during the revision process that produced the current methodology (Ferrant, Fuiret and Zambrano, 2020[18]).
Aggregation of variable into indicators
In theory, each indicator of the SIGI relies on three distinct variables, each measuring a different area where discrimination can occur: a legal variable, an attitudinal variable and a practice variable. Because of data gaps, this is not always possible and certain indicators rely on only one or two variables. Underlying variables are equally weighted within a given indicator. For instance:
Scores for an indicator can only be calculated if data are available for all underlying variables. In case of missing data, the indicator score is left to missing.
Aggregation of indicators into dimensions
Each dimension builds on four indicators that are equally weighted. For instance:
Scores for a dimension can only be calculated if data are available for all underlying indicators. In case of missing data in one or more indicators – resulting from missing data in the underlying variables – the dimension score is left to missing.
Aggregation of dimensions into the SIGI
The four dimensions are aggregated into the SIGI score for each country. Dimensions are equally weighted:
SIGI scores can only be calculated if data are available for all underlying dimensions. In case of missing data in one or more dimensions – resulting from missing data in the underlying variables – the country does not obtain a SIGI score.
References
[8] European Commission (2016), Special Eurobarometer 449: Gender-based violence, https://data.europa.eu/data/datasets/s2115_85_3_449_eng?locale=en (accessed on 16 May 2023).
[18] Ferrant, G., L. Fuiret and E. Zambrano (2020), “The Social Institutions and Gender Index (SIGI) 2019: A revised framework for better advocacy”, OECD Development Centre Working Papers, No. 342, OECD Publishing, Paris, https://doi.org/10.1787/022d5e7b-en.
[15] Gallup (2021), Gallup World Poll, https://www.gallup.com/topic/world-poll.aspx.
[16] IPU Parline (2022), Global data on national parliaments. Monthly ranking of women in national parliaments, https://data.ipu.org/women-ranking?month=1&year=2023.
[17] OECD Development Centre/OECD (2023), “Gender, Institutions and Development (Edition 2023)”, OECD International Development Statistics (database), https://doi.org/10.1787/7b0af638-en (accessed on 27 April 2023).
[1] OECD Development Centre/OECD (2023), SIGI 2023 Legal Survey, https://oe.cd/sigi.
[12] The DHS Program (2022), DHS STATcompiler, https://www.statcompiler.com/en/ (accessed on 15 May 2023).
[9] UNICEF (2022), Female Genital Mutilation (FGM) Statistics, https://data.unicef.org/topic/child-protection/female-genital-mutilation/ (accessed on 16 May 2023).
[2] UNICEF (2022), “Percentage of boys aged 15-19 years who are currently married or in union”, UNICEF Data Warehouse (database), https://data.unicef.org/resources/data_explorer/unicef_f/?ag=UNICEF&df=GLOBAL_DATAFLOW&ver=1.0&dq=.PT_M_15-19_MRD..&startPeriod=2011&endPeriod=2021 (accessed on 16 May 2023).
[3] UNICEF (2022), “Percentage of girls aged 15-19 years who are currently married or in union”, UNICEF Data Warehouse (database), https://data.unicef.org/resources/data_explorer/unicef_f/?ag=UNICEF&df=GLOBAL_DATAFLOW&ver=1.0&dq=.PT_F_15-19_MRD..&startPeriod=2011&endPeriod=2021 (accessed on 16 May 2023).
[4] UNICEF (2022), “Percentage of women (aged 20-24 years) married or in union before age 18”, UNICEF Data Warehouse (database), https://data.unicef.org/resources/data_explorer/unicef_f/?ag=UNICEF&df=GLOBAL_DATAFLOW&ver=1.0&dq=.PT_F_20-24_MRD_U18..&startPeriod=2012&endPeriod=2022 (accessed on 16 May 2023).
[10] United Nations (2022), 2022 Revision of World Population Prospects, https://population.un.org/wpp/ (accessed on 16 May 2023).
[11] United Nations (2022), Family Planning Indicators, https://www.un.org/development/desa/pd/data/family-planning-indicators (accessed on 16 May 2023).
[6] United Nations (2022), SDG Indicator Database, https://unstats.un.org/sdgs/dataportal/database (accessed on 1 June 2023).
[7] WHO (2022), Proportion of females 15-49 years who consider a husband to be justified in hitting or beating his wife, https://www.who.int/data/maternal-newborn-child-adolescent-ageing/indicator-explorer-new/mca/proportion-of-females-15-49-years-who-consider-a-husband-to-be-justified-in-hitting-or-beating-his-wife (accessed on 16 May 2023).
[14] World Bank (2022), World Bank Enterprise Surveys, https://www.enterprisesurveys.org/en/data.
[13] World Bank (2021), The Global Findex Database, https://www.worldbank.org/en/publication/globalfindex/Data.
[5] World Values Survey (2022), “World Values Survey Trend File (1981-2022) Cross-National Data-Set”, World Values Survey (database), https://doi.org/10.14281/18241.23 (accessed on 1 June 2023).