
Employment in general government
Governments across the OECD perform a wide range of functions, all of which depend on a dedicated and skilled public sector workforce. Governments decide which services should be delivered directly through public organisations and which through various forms of partnerships with the private or not-for-profit sectors. The roles and functions of the public sector relative to other sectors therefore vary across OECD countries, affecting the relative size of public employment. For example, in some countries, the large majority of health care providers, teachers and emergency workers are directly employed by the government. In others, these workers are mainly employed by private or non-profit organisations.
The size of general government employment varies significantly among OECD countries (Figure 12.1). Nordic countries such as Norway, Sweden and Denmark report the highest levels of general government employment, close to 30% of total employment in 2021. In contrast, Japan and Korea report the lowest levels among OECD countries, with general government employment below than 10% of total employment.
Overall, the share of general government employment has remained relatively stable over time, with a small increase between 2019 and 2021 during the COVID-19 pandemic. The OECD average was 18.1% in 2019, close to 2007 value, and slightly increased to 18.6% in 2021, a rise of 0.5 percentage points. The largest increase was in Latvia where the share of general government employment rose by 1.5 p.p. between 2019 and 2021, followed by Costa Rica and Estonia, where it rose by 1.4 p.p. On the other hand, general government employment fell as a share of total employment in Poland (-0.4 p.p.), and France (-0.2 p.p.) over the same period.
The increase in the share of general government employment between 2019 and 2021 was due to a combination of general government employment increasing (by an average of 1.5% per year) and total employment falling slightly by -0.1% per year (Figure 12.2). General government employment grew in all but 3 OECD countries (Costa Rica, Italy and the United States), while total employment grew in only 14 OECD countries. Even in countries where the total employment rose, it tended to grow more slowly than general government employment. For example, in Korea general government employment grew at an annual rate of 4.6% while total employment only grew at 0.4%. In Mexico, general government employment grew by 1.2% while total employment shrank by -3.2%. Total employment and government employment both fell in Costa Rica, Italy and the United States, but total employment fell faster. Only France and Poland experienced a faster increase in total employment than in general government employment, resulting in a reduction of the share of government workers. In France, general government employment grew by 0.5% annually compared to 0. 9% for total employment, while in Poland, general government employment only grew by 0.1% compared to 1.3% for total employment.
Methodology and definitions
Data are derived from the OECD National Accounts Statistics (database), which are based on the System of National Accounts (SNA), a set of internationally agreed concepts, definitions, classifications and rules for national accounting. General government employment covers employment in all levels of government (central, state, local and social security funds) and includes core ministries, agencies, departments and non-profit institutions that are controlled by public authorities. The data represent the total number of persons directly employed by those institutions. Total employment covers all persons engaged in productive activity that falls within the production boundary of the national accounts. The employed comprise all individuals who, during a specified brief period, were in either paid employment or self-employment.
Further reading
OECD (2023), Public Employment and Management 2023: Towards a More Flexible Public Service, OECD Publishing, Paris, https://doi.org/10.1787/5b378e11-en.
OECD (2021), Public Employment and Management 2021: The Future of the Public Service, OECD Publishing, Paris, https://doi.org/10.1787/938f0d65-en.
Figure notes
Total employment refers to domestic employment. Data for Costa Rica, Iceland, Japan and Korea are not included in the OECD average. Data for Chile, Colombia and New Zealand are not available. Comparable data for Australia are not available. Data for Japan do not include social security funds.
12.1. Data for Costa Rica, Switzerland and Romania are for 2020 rather than 2021.
12.2. Data for Iceland are not available. Data for Costa Rica, Switzerland and Romania refer to 2019-20.
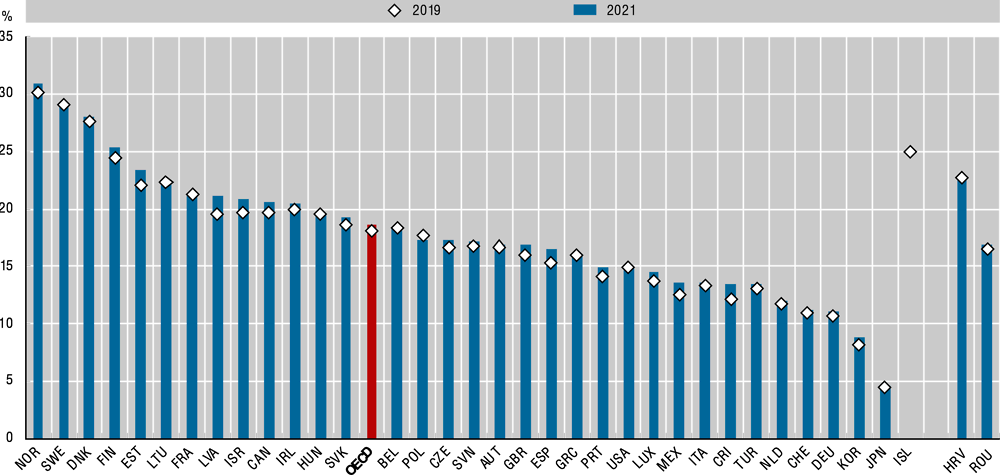
Source: OECD National Accounts Statistics (database). Data for Iceland, Japan, Mexico, Türkiye and the United States are from the International Labour Organization (ILO), ILOSTAT (database), Public employment by sectors and sub-sectors of national accounts.
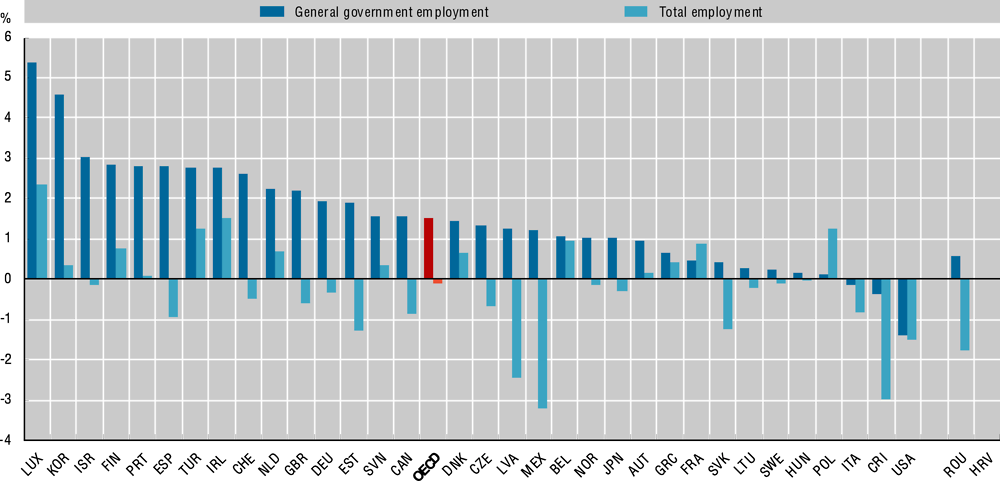
Source: OECD National Accounts Statistics (database). Data for Japan, Mexico, Türkiye and the United States are from the International Labour Organization (ILO), ILOSTAT (database), Public employment by sectors and sub-sectors of national accounts.