copy the linklink copied!Chapter 6. The local dimension of SME and entrepreneurship policy in Ireland
This chapter presents information on the local dimension of SME and entrepreneurship policy in Ireland. Despite its small size, Ireland’s economic geography is characterised by significant differences in the vitality of the local entrepreneurship ecosystems underpinning SME and entrepreneurship development across the country. It points to the importance of an increased local focus in SME and entrepreneurship policy with the aim of promoting local entrepreneurship, innovation and industrial diversification based on existing local strengths. It also discusses mechanisms for reinforcing the vertical and horizontal alignment of SME and entrepreneurship policy in Ireland.
copy the linklink copied!Spatial variations in the local context for SME and entrepreneurship activity
Chapter 2 identified important local variations in numbers of SMEs, SME innovation rates and new firm formation rates within Ireland. In respect of SME innovation and new firm formation rates, these differences exacerbate rather than reduce core-periphery differences in the country. They are affected by important differences within Ireland in terms of the local entrepreneurship ecosystem conditions for SME and entrepreneurship development. These include local differences in areas including industry composition, worker skills, and presence of foreign firms. There are also a number of local concentrations of activities in key sectors across regions in Ireland, such as Medical Devices in Galway, Pharmaceuticals in Cork and Information and Communication Technology (ICT) in Dublin, which form a potential basis for further enterprise development at the local level.
The spatial variation in employment and output
Spatial variations in employment
Ireland is a small country with a population below 5 million with large variations in regional employment and GVA in terms of both volume and composition. The Dublin region clearly dominates a large part of the economy. The South-West of the country with Cork also represents an important economic centre. About 30% of the country’s employees reside in Dublin, and another 14 % in the South-West region (see Figure 6.1). In addition, a significant number of people live outside Dublin and Cork but commutes into these cities for work. For example, in 2016 over 130 000 people living outside Dublin commuted into the city and its suburbs for work. The corresponding figure for Cork was over 40 000.1
Regional shares of employees have been relatively stable since the beginning of the 2000. Over a longer time horizon, the Mid-East has grown considerably in terms of residents with employment due to the expansion of the commuter belt around the Dublin region (Morgenroth 2018).
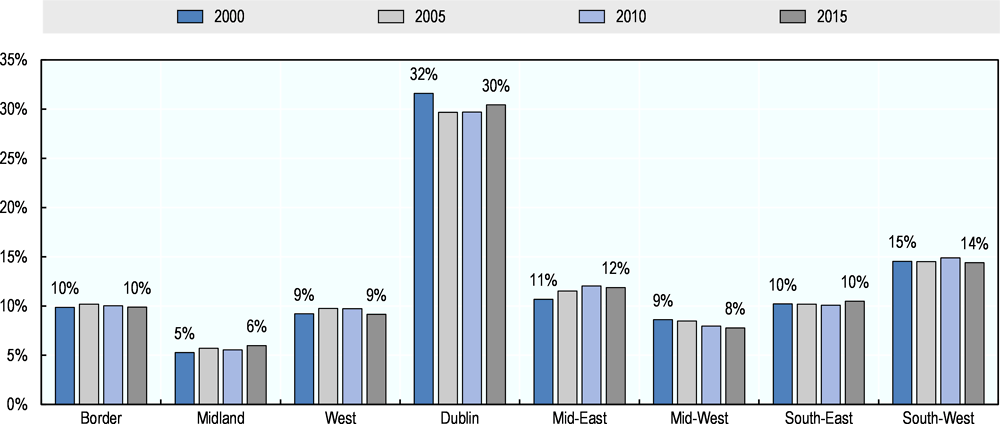
Source: CSO
The National Planning Framework (NPF) as part of Project Ireland 2040, aims to guide the future development of Ireland to 2040 and to influence the spatial patterns of a projected 1 million increase in Ireland’s population over this period2. The NPF and the National Development Plan have been developed in conjunction to link spatial planning policy and infrastructure capital investment.
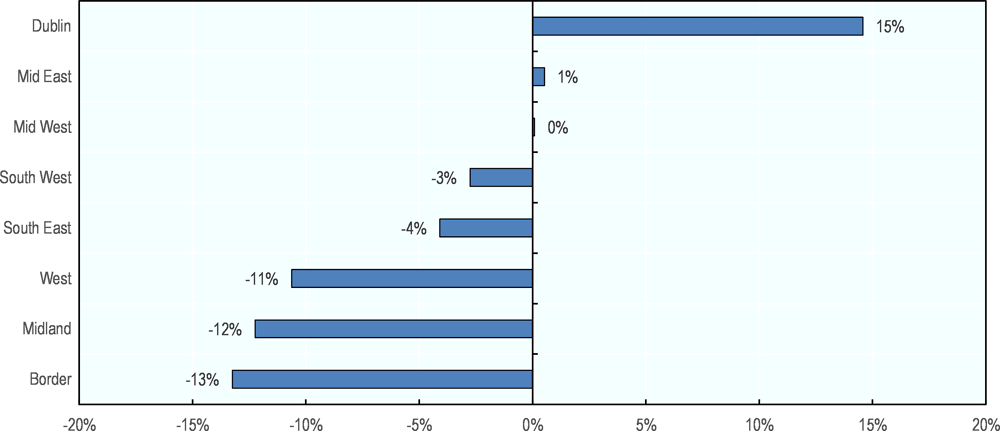
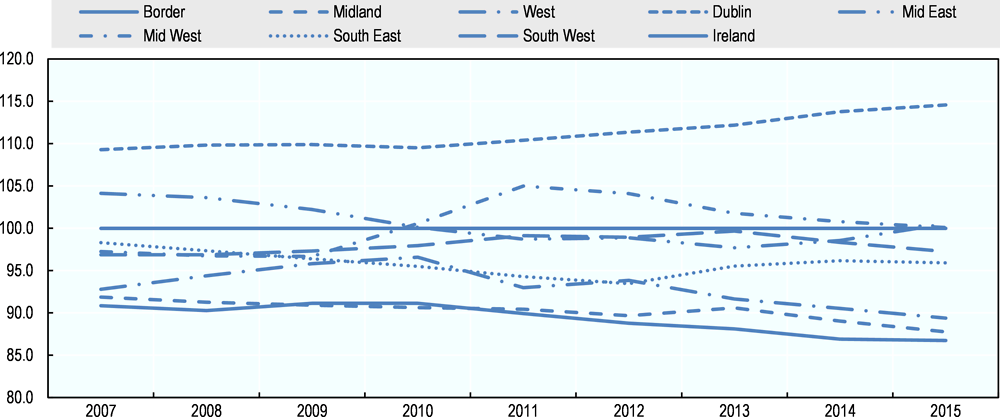
Figure 6.5 and Figure 6.4 present data on disposable income per person by NUTS 3 region.3 Figure 6.3 shows the percentage deviation from the state average by region whereas Figure 6.4 presents indices of the same variable from 2007-15 (state = 100). Disposable income data include total household income plus social transfers minus taxes and is useful as a complement data on GVA to illustrate regional variations in economic activity and income.
Also on this indicator, Dublin is far above the state level (15%) and has consistently developed better than Ireland as a whole since 2007 (see Figure 6.4). The South-West is 3% below the state average in 2015 and also shows a weaker development in recent years. The Mid-West and Mid-East are on par with the state average, although it is clear from Figure 6.4 that the development in the Mid-West is also relatively weak. Border, Midland and West are over 10% below the state average. The data on disposable income per person thus show similar patterns as the data on GVA per capita, with the possible exception that the performance of the South-West is somewhat lower whereas Mid-East and Mid-West perform somewhat better when looking at disposable income data.
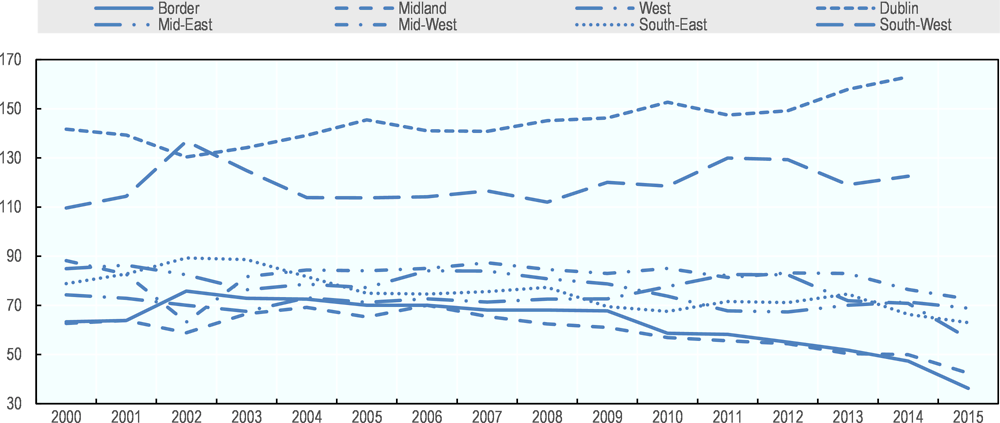
Source: CSO
The role of agglomerations
The performance of Dublin and the South-West region reflects the importance of agglomeration in the Irish economy (see Box 6.1). The two major urban areas are particularly attractive for productive activities and skilled workers. Available data show for example that a significant fraction of multinational activity in the country occur in Dublin and South-West (Whittle, 2018). Morgenroth (2018) cites data from 2012, which illustrates that, these regions together account for over 60 % of the total output produced by multinationals in industry in the whole of Ireland. Foreign multinational firms in high-value added and innovative industries have also been shown to prefer to locate in urban centres in Ireland (Barrios et al 2006).
In addition, there is recent evidence that agglomeration factors are important in explaining innovation outcomes in Irish firms. Crowley and McCann (2015) find that firms located outside Dublin are less likely to introduce product or service innovations as well as organisational innovations. This result holds even after controlling for many other possible reasons for a firm’s innovation outcomes, such as its innovation efforts, size and age and whether it is domestic or foreign. Regional disparities between regions in Ireland are among the highest in the OECD (OECD, 2016) and have been growing since 2000 (Figure 6.2). The regions with the two largest urban centres, i.e. Dublin and the South-West, perform significantly better than other regions. In recent years, the Dublin and South-West regions show levels of GDP per capita of the order of 60% and 20% respectively above state-level. At the same time, the Border and Midland regions display less than half of the overall GDP per capita in Ireland.
Agglomerated areas with high density of people and economic activity offer several productivity gains for workers and firms located within them. These effects are often categorised into matching, learning, and sharing. Matching implies that the density of firms and workers imply thick markets for skills and thereby matching efficiency in the labour market. Sharing means that agglomerated areas can sustain indivisible public goods that can be shared by firms and workers in the city, such as marketplaces, production facilities and advisory services. Learning is facilitated by the large number of people and firms supporting the generation, diffusion, and accumulation of knowledge, ideas, and information (Duranton and Piga, 2004).
Existing research shows that these types of benefits dissipate rather quickly with distance and thus operate within the confines of city regions. For example, Rice et al (2006) study the relationship between proximity to economic mass and productivity in the United Kingdom and find that proximity to an area with a large population of working age is beneficial for productivity. However, the positive effects decline rapidly with travel time and cease to be important beyond about 80 minutes of travel time. This means that even in small countries such as Ireland, in which major urban centres may be reached within a daytime business trip, proximity and agglomeration are issues of importance in the context of the overall supply- and demand-side conditions for innovation and growth of SMEs and entrepreneurship activity.
Investments in physical infrastructure that reduce travel times and increase the connectivity between small and rural regions and larger agglomerations is therefore also relevant from the viewpoint of local conditions for SME and entrepreneurship activity. The role of high-quality infrastructure for the competitiveness of businesses all over Ireland is for example emphasised by the National Competitiveness Council.
Spatial variations in industry and skill structures
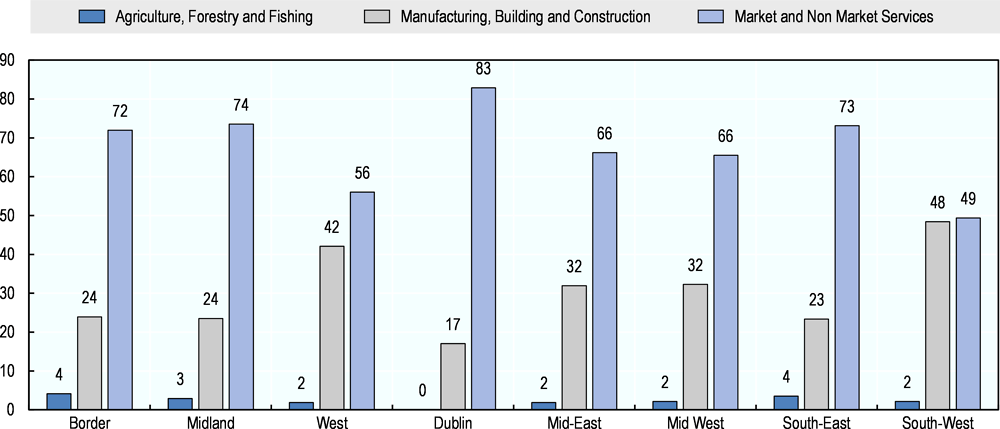
Spatial variations exist also in the overall composition of GVA between regions. Figure 6.5 reports the fraction of GVA attributed to (i) agriculture, forestry and fishing, (ii) manufacturing, building and construction and (iii) market and non-market services by NUTS 3 region. Although the majority of the regional GVA is attributed to market and non-market services in all regions, there are still substantial difference between regions: Dublin and the South-West, the two regions with the highest GVA per capita, differ for example markedly in the composition of their GVA. Over 80 % of Dublin’s GVA comes from services, whereas in the South-West, the contribution of manufacturing and building and construction to total GVA is almost as large as the contribution of services. This reflects South-West’s concentration of manufacturing activity, such as in pharmaceuticals and chemicals (see e.g. InterTradeIreland 2015).
The Border, Midland and South-East regions show a rather similar composition of GVA with 3-4% attributed to agriculture, about a quarter (24%) to manufacturing, building and construction and 72-74% to services. The Mid-East and Mid-West have also a similar structure with a contribution of services in the order of 66% and relative high contribution of manufacturing, building and construction (32%). The West has a relatively low contribution of services (56%) and a contribution of manufacturing, building and construction of over 40%.
Source: CSO.
The industry composition of Irish regions’ employment also varies markedly. Table 6.1 shows how important different industries are across NUTS 3 regions in Ireland. For each region, as well as Ireland as a whole, the table reports the fraction of employment by industry based on data for 2016. There are rather clear differences between regions in terms of the importance of various industries in employment.
In the Border and Mid-West regions 7% of employment is in Agriculture while Agriculture is of very minor importance in Dublin. Extraction and Mining is unimportant in all regions, though about 1% of the employment in Midland is in extraction and mining. Manufacturing is relatively important in the South-West, West and Mid-West regions, although as many as five regions have an employment share in manufacturing that is higher than it is for Ireland as a whole.
Many basic services industries, like Accommodation and Food, Retail, Wholesale, Personal services and Health and Social Work, are of similar importance across regions. The employment in these sectors is in principle proportional to the size of the regional economies. On the other hand, more advanced services like Information and Communication, Finance and Insurance as well as Professional services are of significantly greater importance in the Dublin region than in other regions in Ireland. Dublin’s fraction of Ireland’s total employment in Information and Communication as well as Finance and Insurance is for example in the order of over 50%.
The table also reports the fraction of the people in the labour force that is unemployed. The Border and Midland regions show the highest fraction of unemployed (16%) whereas the fraction of unemployed is lowest in the South-West (11%) and Dublin (12%) regions.
Even though manufacturing is rather important in many regions in Ireland, there are sharp regional variations in terms of which manufacturing industries they are specialised in. Table 6.2 shows, for each region, the main specialisations in manufacturing by region. Specialisation is measured by comparing each industry’s employment share in a region with the same industry’s employment share in Ireland as a whole. The Dublin region is not included in the table because the regions has no particular specialisation in any manufacturing industry.
The table shows that the different regions in Ireland are specialised in different types of manufacturing activity. For instance, the West is specialised in Medical and dental instruments, Mid-East in Paper, paper products and furniture, the Border region in Fish, Meat and Electrical equipment and the South-West in Computers and peripheral equipment. The specialisation index is presented within brackets. It shows for example that in the South-West region, the share of employment in Computers and peripheral equipment is over three times higher in the South-West that it is in Ireland as a whole.
The geographic concentration of sectors in Ireland has also been noted in recent research papers. For example, O’Connor et al (2017) identify 10 main globally competitive groups of traded activities in Ireland by export values in 2012.
They further show that there are distinct patterns in the spatial concentration of activities across NUTS 3 regions in Ireland. For example, the Dublin region stands out with a unique concentration in some of the most productive clusters in Ireland, like Business Services.4
A consequence of regional industry specialisations is that there are spatial variations in the local availability of skills, resources, and experiences associated with very different industries. Industries represent structures that facilitate and stimulate the development and accumulation of knowledge, technology and knowhow, for example embodied in workers that may be pertinent for a range of related industries (Boschma 2017, Xiao et al 2018).
The concept of industry “relatedness”
A growing body of empirical work finds that relatedness is important in explaining patterns of industry dynamics across regions. Industries are for example more likely to enter and develop in a region when they are related to pre-existing industries in that region (Neffke et al. 2011). Likewise, new technologies are more likely to occur in regions with an already established presence of related technologies (Kogler et al. 2013, Rigby 2015). This illustrates that there is an industry-component in the local conditions for development and growth of SMEs and entrepreneurship, and that the existing local industry structure is one determinant of the nature of entrepreneurship and industry dynamics in a region.
Chapter 5 provides recommendations on the establishment of cluster policies in Ireland. The Norwegian Cluster model in Box 6.2 provides an example of how such clusters can be strengthened, even without rolling out a fully-fledged cluster policy.
Description of the approach
Norwegian Innovation Clusters is a government-supported cluster programme that aims to support clusters with a growth potential. Cluster goals are to increase innovation capability and value creation in different clusters. The programme is organised by Innovation Norway in joint effort with SIVA (the Industrial Development Co-operation of Norway) and the Norwegian Research Council.
Through annual open calls clusters compete to be part of the programme. Strict criteria exist to take part in the programme. These include cluster resources; potential for growth and position in the industry but also that the initiative is founded on the participation and leadership of the enterprises’ common interest and their common ownership to the cluster project. Cluster collaboration must be organised in a way to ensure participants’ co-operation patterns.
Clusters are supported on three levels:
-
Arena: Clusters that are in an early phase of organised cluster collaboration. The support period is 3-5 years with EUR 200 000 – 300 000 and currently 19 supported clusters;
-
Norwegian Centres of Expertise: These are mature clusters with national position. The support period is 5-10 years with EUR 500 000 – 600 000 and currently 14 supported clusters;
-
Global Centres of Expertise: These are mature clusters in global positions. The support period is up to ten years with EUR 1 million and currently 3 supported clusters in the blue maritime, subsea and node area.
Support is provided in the form of co-funding (50%) of basic cluster activities through a cluster facilitator and targeted support schemes on cluster sustainability, entrepreneurship, innovation and the support of “change agents.” Networking and advisory services are also part of the package.
Success factors
First, clusters are based on a strategic collaboration between companies, knowledge providers and the public sector. An evaluation from Technopolis (2017) has shown that participation in a cluster project had significant effects on collaboration between firms. When comparing collaboration links before and after enrolment in a cluster, collaboration between cluster firms in the same cluster doubled in the Arena projects. Similar collaboration had more than doubled in the NCE projects. There has also been a significant increase in collaboration between cluster firms and R&D institutions in the same cluster.
Second, a broad array of areas of collaboration has been established, ranging from branding and communication to joint infrastructure, building attractiveness, new educational programmes, partner search and collaborative innovation. Often, cluster resources are combined with external knowledge through strategic alliances.
Third, different policies from the Ministry of Trade and Fisheries and the Ministry of Local Government and Modernisation have been linked and implemented in strategic co-operation with the innovation agency Innovate Norway and the Research Council of Norway. Linking roles and resources has been key to secure successful implementation.
Obstacles and responses
During the implementation of the programme, it has been realised that the organisation and functioning of the program could be improved through organisational changes. As a result, an advisory board has been introduced to select clusters into the programme and regional account managers have been installed. Whilst advisory services were initially targeting individual clusters, they now incorporate several clusters at once to support linkage building between the clusters.
Relevance to Ireland
Ireland is a world leader in key innovative sectors and that the fact that Ireland has a number of strong geographic clusters concentrations has been noted in recent research papers (see for example O’Connor et al (2017)) despite the absence of a dedicated national cluster policy. Whilst Ireland might not want to roll out a fully-fledged national cluster programme, there are reasons for the government to consider enhancing collaborative innovation projects, internationalisation projects as well as cluster-to-cluster projects to support cross-fertilisation between clusters. Building on “related diversification” by bringing together complementary skills of different industry strengths to create new activities across sectors and technologies can and should be facilitated at all levels of government, including federal, regional assembly level and local government levelsauthorities, who have an important role to play as “agents of change”.
Further Information
Norwegian Innovation Clusters: http://www.innovationclusters.no/english.
The regional skill structure
The spatial variations in employment by industries leave footprints in the composition of skills across regions. Table 6.3 shows employment by four occupational categories across the eight NUTS 3 regions in Ireland. The figures show each region’s share of the total employees in Ireland by each occupation category. The table also reports each region’s share of the total number of employees in Ireland as a point of reference.
In relative terms, Dublin has the largest concentration of people working as Business and Legal professionals, followed by the Mid-East and this reflects the concentration of knowledge-intensive and advanced business services and various headquarter activities, The vast majority of workers with skills and experiences that pertains to business services, marketing, finance, management consulting, advertising and business analysis are concentrated in these two regions. The same applies to workers with occupations related to ICT, confirming Dublin’s status as the main economic hub in Ireland.
Regions where manufacturing is relatively important, like the South-West, West and Mid-West, have a rather high fraction of Engineers and Technicians relative to total employees. This illustrates the role of engineers and technicians in manufacturing activity.
copy the linklink copied!Mechanisms for tailoring and alignment of local and national SME and entrepreneurship policy
Key actors for SME and entrepreneurship policy at sub-national level
Ireland is the second least decentralised country in the OECD with regard to public spending. About 10 % of the public expenditure is conducted by subnational governments (OECD 2016). However, national government departments and agencies have important regional presence and a number of locally differentiated programmes for SME and entrepreneurship development.
Enterprise Ireland regional offices
Enterprise Ireland operates a network of nine regional offices in Ireland. This supports its collaborations with LEOs and regional functions of other agencies as well as providing a local presence to deliver services and events to SMEs. Enterprise Ireland has also recently launched a Regional Plan called Powering the Regions within the context of its Build Scale, Expand Reach 2017-20 corporate strategy. It includes nine specific regional plans building on local sector strengths and regional research and education assets. It also includes six national initiatives to strengthen regional enterprise development infastructures and supports – including a target of achieving a 30% increase in company uptake of EI productivity and resilience programmes, nationwide support for entrepreneurship, an action plan for enterprise growth in cities, rural and urban centres, supporting additional co-working and incubation spaces in regional locations, supporting second-site locations of Irish companies in the regions, and developing food FDI in the regions.5
Local Enterprise Offices (LEO)
The key policy actors for regional and local SME and entrepreneurship policy are the Local Enterprise Offices (LEO), whose main mission is to provide local enterprise supports to start-ups and small businesses employing fewer than 10 employees. Chapter 5 provides more information regarding the main activities of the LEOs.
IDA Ireland offices
IDA is the investment promotion agency and plays a key role in attracting high value investments and R&D activities to Ireland by working with industry, academia, government agencies and regulatory authorities. The agency funds in-company R&D and identifies support opportunities from other funding organisations. The R&D fund provides grant-aid to clients establishing new R&D facilities, expanding existing ones, or embarking on R&D projects. IDA and EI have a joint initiative called “Global Sourcing Initiative” that aims to link up Irish SMEs to foreign MNEs as a way to integrate them into the global value chains of MNEs and strengthen their exports. LEOs provide IDA and EI with information about potential local partner firms.
Network of Regional Skills Fora
DES has also developed a Regional Skills Forum with nine regional skills managers in the different regions of Ireland. Their role is to facilitate collaboration between local firms and the education training to address skills. Enterprise Ireland collaborates with the Department of Education and Skills (DES) to organise workshops throughout Ireland focusing on identifying the skills firms need to support their business growth plans, engaging with DES’s Regional Skills Managers to address the critical skill needs of their business. The Spotlight on Skills programme aims to link SMEs more closely to regional education providers.
Programmes
In addition to the main actors, there are several programmes designed to promote and strengthen the SMEs and start-up ecosystem locally in Ireland. Examples are the previously mentioned Micro Finance Institution, the Western Development Commission (WDC), the Regional Enterprise Development Fund (REDF), elaborated in earlier sections of this publication and LEADER.
LEADER is a multi-annual programme which provides a EUR 250 million contribution over the period 2014-20 towards promoting the social and economic development of rural areas. LEADER funding is provided through Local Action Groups (LAGs) based on Local Development Strategies produced for each area and in line with horizontal funding themes developed at a national level. So far, EUR 220 million of the available funding has been allocated to the 28 LEADER sub-regional areas. Each LAG is responsible for deciding how this allocation is distributed to LEADER projects over the duration of the Programme based on the objectives in their Local Development Strategy. Funding under LEADER is available for a range of defined themes and sub-themes, which include enterprise development, rural tourism and job creation. This funding theme focuses on driving continued local economic development, including diversification of the rural economy and the creation of employment opportunities. Support to SMEs is delivered through this theme and actions funded include investment support, sector specific training programmes for aspiring entrepreneurs, start-up businesses and established SMEs, marketing initiatives and feasibility studies to explore business ideas.
Coordination and tailoring mechanisms to align local and national policies
Alignment and tailoring in the LEO system
In the current institutional set-up and policy logic, one of the key tasks of LEOs is to identify in every local authority indigenous firms who show a potential for export and can be channelled up to Enterprise Ireland for further assistance on internationalisation efforts. Focus is placed on the identification of local export potential and ambition.
Each LEO has quantitative targets on the number of local firms that are expected to qualify for Enterprise Ireland programmes. Enterprise Ireland then engages with established client companies through teams of sectoral focused development advisors using what is referred to as a company-led diagnostic approach. The agency works with established clients throughout the country on a one-on-one basis and has a network of market and sector advisers from ten offices located throughout the country. The idea of this network is that is should enable the agency to connect and collaborate at a local level with enterprise development partners.
Data on employment in Irish-owned firms assisted by EI or Udarás na Gaeltachta by region in 2017 (see Table 6.4) show that the spatial distribution of employees in indigenous firms that are assisted by EI, or Udarás na Gaeltachta follow the overall distribution of total employment in Ireland very closely.
Nonetheless, the main model for the local dimension of SME and entrepreneurship policy, the system of LEOs, is first and foremost a model for the delivery of national policy in different local areas, rather than a model for adapting and tailoring policy for varying local conditions.
Given the significant heterogeneity in local conditions for SME and entrepreneurship activity and the overall divide between the major urban regions (Dublin and South-West) and the rest of the country, the relatively downplayed role of local tailoring in the LEO system is surprising. In part, this may be a reflection of the centralised structure in Ireland. Other countries, even relatively small ones have developed more tailored policy approaches, as the example from Denmark illustrates (see Box 6.3).
Description of the approach
The Rural Growth Pilot (RGP) is a recent programme under the public Danish Innovation Fund (Innovationsfonden). It is built on experience from previous projects that suggests that the recruitment of graduates (individuals with a university Master’s degree) generally has a positive impact on the growth of SMEs that do not already employ graduates. In the RGP programme, this idea is extended to SMEs in rural areas that tend to have relatively low growth and innovation levels.
The programme supports businesses by providing financial support over a one to two-year period to hire a graduate. The support amounts to DKK 150 000 (EUR 20 000) per year for a maximum of two years (EUR 5.3 million total over a four-year period). The support is premised on an application where the firm provides an idea for a new product, market, production method or service, as well as a description of the role of the graduate in its development. It is a requirement that the graduate employee has a different skillset from the current employees.
Success factors
The design of the RGP programme follows a set of policy goals that are considered important in the current Danish political arena, i.e. job creation in rural areas to counter urbanisation, the creation of jobs for graduates, and stimulating SME growth. The programme design is based on solid experiences from previous programmes and a theory of change that sees the infusion of new skills and knowledge into SMEs as a driver of innovation and growth. Firms self-select into the programme. If few companies apply, the programme resources are released for other business support interventions.
Obstacles and responses
A critical factor in the success of the programme has been to raise awareness among rural companies regarding the existence of the programme and its application. Both regional universities as well as municipalities have been influential in promoting the programme locally to companies. Successful examples of hired graduated have been showcased locally to provide companies with an idea of how an innovation project can look like.
Relevance to Ireland
Lack of skills as well as skills mismatch are high on the policy agenda across Irish regions. The Irish network of Regional Skills Fora created as part of the national Government’s National Skills Strategy would provide an excellent platform to communicate local skills needs to universities and help employers to utilise resources in the region to develop innovation projects.
Further Information
Innovation Fund Denmark: https://innovationsfonden.dk/en
The Limerick for Engineering group is a good example of how partnering between local industry, LEOs, IDA, Regional Skills Forum, local universities and other organisations in a region can breed a local initiative to solve skills shortages of firms in a region, in this case the local availability of engineering talent.
Regional Enterprise Plans
A key mechanism to tailor SME and entrepreneurship policy to local conditions in Ireland is the system of Regional Enterprise Plans (REPs). The current REPs were launched by DBEI in early 2019 and are a continuation and refresh of the previous Regional Action Plans for Jobs (RAPJ) 2015-2017/8 developed for each of the eight NUTS 3 regions in Ireland. These regional plans are published by DBEI and as, a ‘bottom-up’ initiative, are designed to complement national level policies and programmes emanating from the top-down. In particular, there is strong alignment with Ireland’s national enterprise policy, Enterprise 2025 Renewed and the Future Jobs Ireland 2019 framework. Each region has a Steering Committee, composed of representatives from the private sector, as well as the local authorities, enterprise agencies (including LEOs) and other public bodies. Each REP contains a small number of high level “Strategic Objectives” and sets out actions under each of the objectives for the two years to 2020 that should be implemented to strengthen the ecosystem for enterprise development, including SMEs and entrepreneurship, so as to create jobs in the regions. As the REPs cover NUTS 3 regions that in themselves comprise several local authorities, LEOs and other actors, design and implementation requires co-ordination among a rather large number of organisations. Collaboration is a key principle of the REPs, so as to derive added value in actions undertaken and derive economies of scale through pooling of scarce resources
The system of REPs provides an institutional setting to address local tailoring and to align national policy with local needs and preconditions.
The Regional Enterprise Development Fund
Another way in which tailoring does occur in the SME and entrepreneurship policy system is through the formation of local projects in response to the Regional Development Enterprise Fund (RDEF), which was launched by the Irish government in 2015 to support the ambition and implementation of the REPs (and previously the RAPJ). The third Call under the Fund was launched in June 2019. This competitive fund has three streams that support major strategic change projects, regional strengthening projects and enterprise clustering initiatives. The programme documentation states that their goal is to support “significant regional initiatives to build on sectoral strengths and/or to better leverage identified resources to improve enterprise capability.”6
The implementation and development of the original fund of up to EUR 60 million was managed by EI with support from DBEI. The third competitive call of EUR 45 million is also managed by EI. Furthermore, in 2016, EI awarded EUR 5 million in funding for regional projects under a LEO Fund and a Community Enterprise Initiative (ended in 2017). The latter had as one of its goals to support “Establishment of hubs, accelerators, networks and clusters or other partnerships based on regional strengths, opportunities and uniqueness.”7 Several of the awarded projects were projects in which LEOs in different local authorities collaborated to draw on regional strengths. For example, the LEOs in Westmeath, Laois, Offaly and Longford were granted project funds to work on a Midlands Engineering Cluster Programme aiming to create a new synergy between engineering enterprises, educational institutions and support agencies in the region.
copy the linklink copied!Conclusions and policy recommendations
The following suggestions could develop and strengthen the local dimension of SME and entrepreneurship policy.
Develop data infrastructure
A prerequisite for tailoring and adaption of policy to local conditions is that local conditions are analysed and assessed. This in turn requires access to data infrastructure concerning the frequency as well as nature of local SME and entrepreneurship activity. Current data availability of local SME and entrepreneurship activity is limited. There is a particular need to better understand spatial heterogeneity in characteristics and performance of start-ups and SMEs, as well as the linkages between local firms through e.g. local labour flows.
Reduce complexity and identifiy of tailoring mechanisms
Currently, there is a wide variety of programmes, agencies, departments and funds involved in the development and delivery of measures and actions at the local dimension. One recommendation is to undertake a mapping and assessment of the complexity of the support system and explicate the functions and roles of the various agencies/organisation. The objective of such an exercise would to be to first identify possibilities to reduce complexity and possible overlaps in the support system, and second to develop design mechanisms for co-ordination and horizontal alignment between the policy actions of the various agencies, organisations and departments that bear on the local dimension.
Connect rural SMEs and entrepreneurs to urban ecosystems
A characteristic of the Irish economic geography is that many urban centres outside Dublin, Cork and other larger agglomeration in Ireland are small in size. In addition, a large part of the country is remote from even small urban centres. Against this backdrop, local SME and entrepreneurship policy in small and remote local areas may benefit from a combination of inward and outward looking policy strategies. One strategy is to compensate remoteness and a possible lack of local resources by connecting local entrepreneurs to resources and strategic actors in larger cities or urban areas. An example of a policy initiative with such element is the Startup Sweden which is initiated and managed by the Swedish Agency for Economic and Regional Growth. In essence, this is a bootcamp programme for promising digital start-ups, in part to get practical advice know-how in business development from other startups as well as from experts in various fields. Although the policy initiative is not developed specifically for firms in remote locations, it is an example of a policy logic that aims to leverage networks and connect firms to a broader ecosystem across the country. Such a policy initiative could complement Enterprise Ireland’s regular programmes for high-potential firms, and expand the number of high-potential firms throughout the Irish economy.
Improve coordination and horizontal alignment
An example where improved co-ordination would offer additional benefits is the Global Sourcing initiative of EI and IDA, which aims to link up indigenous firms with global value chains of foreign MNEs. It seems natural that there is also an alignment with the National Standards Authority of Ireland (NSAI), which works with certification of production and production system, to help local SMEs to meet the requirements to become potential suppliers to MNEs. This is further discussed in Chapter 7.
Recognise the broader role of local SME and entrepreneurship activity
The Regional Enterprise Plans puts forward a focus on SMEs and entrepreneurship almost exclusively from the perspective of the role of growth of SMEs and entrepreneurship in creating jobs and export revenues. This follows the overall focus of Enterprise Ireland on fostering new indigenous export firms and high-potential startups. However, SMEs and entrepreneurship have a broader role in local development than jobs and exports, and this could be reflected more in policy making, including by recognising more explicitly that all forms of SME and entrepreneurship play an important role in shaping the local economy, even firms where the direct job contribution or growth potential is limited.
In addition, entrepreneurial activity can be a relevant “spillover mechanism” that operate at the local level. For example, employee spinoff from established firms have been shown to be an important source of new high-growth firms in many countries and regions. Regions hosting resourceful and entrepreneurial incumbents act as indirect training grounds for new entrepreneurs. In the Irish context, entrepreneurship in the form of employee spinoffs constitute one type of potentially relevant “spillover mechanism” from foreign firms, feeding new successful indigenous ventures.
The local dimension of SME and entrepreneurship policy in Ireland could be expanded by a stronger focus on supporting local SME and entrepreneurship activity to expand and to diversify around core regional strengths, for example by supporting businesses that experiment with new commercial applications of a core technology. There is a strong case for supporting local SME and entrepreneurship activity that build on local strengths to experiment with new business niches, technologies and markets (McCann and Ortega-Argiles 2011). Such a focus expands on the traditional cluster argument by linking it with industry dynamics and innovation through the emphasis on diversification driven by SME and entrepreneurship activity. In the current system the selection mechanism by which local firms’ progress to the regular support programmes of Enterprise Ireland focuses largely on the quality of the firms’ business plan and potential for growth, with limited recognition of perspectives related to the regional embeddedness and relatedness to the regional industry structure.
-
Improve data and information on local entrepreneurship ecosystem conditions particularly with respect to constraints to cluster development.
-
Map and assess the functions and roles of the various agencies and organisations in the local enterprise support system and identify possibilities to reduce complexity, enhance coordination and increase opportunities for local tailoring.
-
Create a mechanism to involve the Regional Skills Fora and LEOs in new collaborations to address the challenge of raising SME innovation capacity at a regional level.
-
Set up a collaboration between LEOs, Enterprise Ireland, education providers, IDA and NSAI to organise training and awareness building of local SMEs on the role of standards and certification in growth and internationalisation.
-
Include a focus within SME and entrepreneurship policy on the further development and diversification of local and regional enterprise specialisations and capabilities.
-
Develop approaches to connect SMEs and entrepreneurs in remote regions with broader entrepreneurship ecosystems in urban centres and larger cities.
Note: There are key recommendations in other chapters that are important to consider in the context of addressing spatial disparities and SME and entrepreneurship development in the regions. These include: Regional competence centres (Chapter 7); Ecosystem support hubs (Chapter 4); Rebalancing of expenditure (Chapter 4) and Networks and cluster policy (Chapter 5).
References
Andersson, M., & Klepper, S. (2013). Characteristics and performance of new firms and spinoffs in Sweden. Industrial and corporate change, 22(1), 245-280.
Audretsch, David B., Erik E. Lehmann, and Susanne Warning. "University spillovers and new firm location." Research policy34.7 (2005): 1113-1122.
Avnimelech, G., & Feldman, M. (2010). Regional corporate spawning and the role of homegrown companies. Review of Policy Research, 27(4), 475-489.
Baltzopoulos, A., Braunerhjelm, P., & Tikoudis, I. (2015). Spin-offs: Why geography matters. Journal of Economic Geography, 16(2), 273-303.
Baptista, R., Lima, F., & Mendonça, J. (2011). Establishment of higher education institutions and new firm entry. Research Policy, 40(5), 751-760.
Barrios, S., Görg, H., & Strobl, E. (2006). Multinationals' location choice, agglomeration economies, and public incentives. International Regional Science Review, 29(1), 81-107.
Boschma, R. (2017). Relatedness as driver of regional diversification: A research agenda. Regional Studies, 51(3), 351-364.
Carias, C., & Klepper, S. (2010). Entrepreneurship, the initial labor force, and the location of new firms. In International Schumpeter Society Conference (pp. 21-24).
Crowley, F., & McCann, P. (2015). Innovation and productivity in Irish firms. Spatial Economic Analysis, 10(2), 181-204
Dahl, M. S., & Sorenson, O. (2012). Home sweet home: Entrepreneurs' location choices and the performance of their ventures. Management science, 58(6), 1059-1071.
Duranton, G., & Puga, D. (2004). Micro-foundations of urban agglomeration economies. In Handbook of regional and urban economics (Vol. 4, pp. 2063-2117). Elsevier.
Eriksson, T., & Kuhn, J. M. (2006). Firm spin-offs in Denmark 1981–2000—patterns of entry and exit. International Journal of Industrial Organization, 24(5), 1021-1040.
Expert Group on Future Skills Needs (2016), Regional Labour Markets Bulletin 2016, https://dbei.gov.ie/en/Publications/Publication-files/Regional-Labour-Markets-Bulletin-2016.pdf
Gompers, P., Lerner, J., & Scharfstein, D. (2005). Entrepreneurial spawning: Public corporations and the genesis of new ventures, 1986 to 1999. The journal of Finance, 60(2), 577-614
InterTradeIreland (2015), Mapping the potential for all-island sectoral eco-systems, https://intertradeireland.com/insights/publications/mapping-the-potential-for-all-island-sectoral-ecosystems/
Klepper, S. (2001). Employee startups in high‐tech industries. Industrial and corporate change, 10(3), 639-674.
Klepper, S. (2009). Spinoffs: A review and synthesis. European Management Review, 6(3), 159-171.
Kogler, D. F., Rigby, D. L., & Tucker, I. (2013). Mapping knowledge space and technological relatedness in US cities. European Planning Studies, 21(9), 1374-1391.
Kogler, D. and Whittle, A. (2018) ‘The Geography of Knowledge Creation: Technological Relatedness and Regional Smart Specialization Strategies’. In: Paasi, A., Harrison, J. and Jones, M. (eds.), Handbook on the Geographies of Regions and Territories. London: Edward Elgar.
Lindelöf, P., & Löfsten, H. (2004). Proximity as a resource base for competitive advantage: University–industry links for technology transfer. The Journal of Technology Transfer, 29(3-4), 311-326.
McCann, P., & Ortega-Argilés, R. (2011). Smart specialisation, regional growth and applications to EU cohesion policy. IEB Working Paper 2011/14.
McCoy, D., Lyons, S., Morgenroth, E., Palcic, D., & Allen, L. (2018). The impact of broadband and other infrastructure on the location of new business establishments. Journal of Regional Science.
Morgenroth, E. (2018). Prospects for Irish regions and counties: Scenarios and implications. Economic and Social Research Institute (ESRI).
Neffke, F., Henning, M., & Boschma, R. (2011). How do regions diversify over time? Industry relatedness and the development of new growth paths in regions. Economic Geography, 87(3), 237-265.
O’Connor, S., Doyle, E., & Brosnan, S. (2017). Clustering in Ireland: development cycle considerations. Regional Studies, Regional Science, 4(1), 263-283.
OECD (2016), Regional Outlook 2016:pridyctive regions for inclusive socities, Paris
Rice, P., Venables, A. J., & Patacchini, E. (2006). Spatial determinants of productivity: analysis for the regions of Great Britain. Regional science and urban economics, 36(6), 727-752.
Rigby, D. L. (2015). Technological relatedness and knowledge space: entry and exit of US cities from patent classes. Regional Studies, 49(11), 1922-1937.
Xiao, J., Boschma, R., & Andersson, M. (2018). Industrial diversification in Europe: The differentiated role of relatedness. Economic Geography, 1-36.
Notes
← 1. https://www.cso.ie/en/releasesandpublications/ep/p-cp6ci/p6cii/p6www/
← 3. https://www.cso.ie/en/releasesandpublications/er/cirgdp/countyincomesandregionalgdp2015/
← 4. Using an alternative methodology, Whittle (2018) found similar results demonstrating the majority of complex technologies are produced in the greater Dublin region.
← 5. See https://www.enterprise-ireland.com/en/Publications/Reports-Published-Strategies/Enterprise-Ireland-Regional-Plan.pdf
← 6. https://www.enterprise-ireland.com/en/start-a-business-in-ireland/information-store-for-start-ups/regional-enterprise-development-fund.html
← 7. https://www.enterprise-ireland.com/en/start-a-business-in-ireland/information-store-for-start-ups/community-enterprise-centre-manager-grant-call-for-applications.html
Metadata, Legal and Rights
https://doi.org/10.1787/e726f46d-en
© OECD 2019
The use of this work, whether digital or print, is governed by the Terms and Conditions to be found at http://www.oecd.org/termsandconditions.