Key Policy Insights
Luxembourg is one of the most prosperous economies in the OECD. Thanks to overall sound policies and institutions, the financial sector remains competitive and has made inroads into new areas, such as fintech and green finance. Dynamic job creation has reduced unemployment and enabled Luxembourg to integrate numerous immigrants, who have become an essential pillar of the labour force while embracing the opportunity of a better life. A very large number of residents in neighbouring countries have also found work in Luxembourg, illustrating the high interconnectedness of the economy. The strong fiscal position is well illustrated by a long-standing AAA rating and the large accumulation of government financial assets.
Well-being benefits from high income levels, but also relies on many other strengths (Figure 1). Most people enjoy a healthy work-life balance and supportive social connections. Housing is generally spacious and well-equipped. Gender inequalities are comparatively low, especially as regards wages (Figure 2).
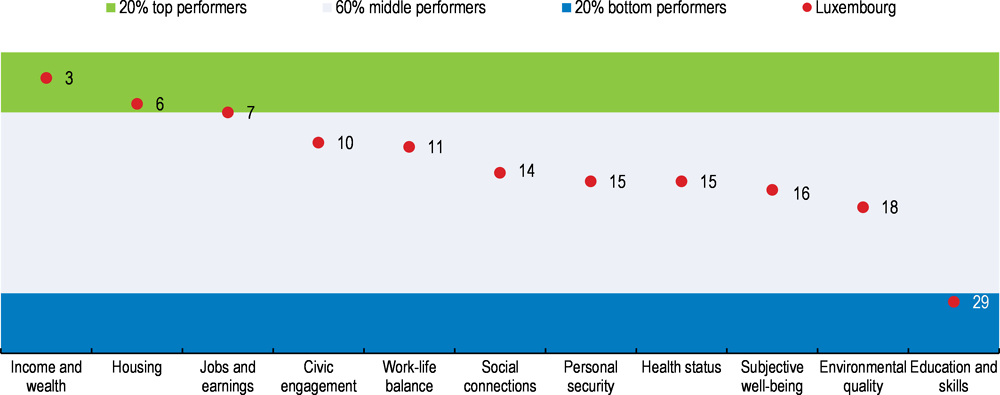
Note: Each well-being dimension is measured by one to four indicators from the OECD Better Life Index set. Normalised indicators are averaged with equal weights.
Source: OECD (2018), OECD Better Life Index, www.oecdbetterlifeindex.org.
However, prosperity and quality of life cannot be taken for granted, and face some risks. For example, important challenges remain in education and skills, partly due to the large diversity of the resident population. Furthermore, though most immigrants find a job, they tend to earn less than the native-born and are more exposed to poverty, which weighs on the poverty rate for the population as a whole (Figure 3). The provision of multilingual education and 20 hours per week of free care for children aged 1-4, introduced in 2017, is a worthy policy initiative to address these challenges, which were extensively analysed in the 2017 OECD Economic Survey of Luxembourg.
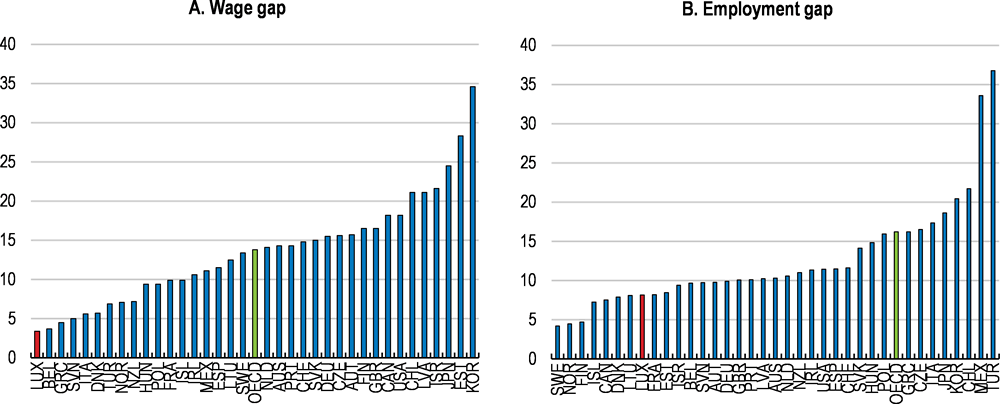
Note: The gender wage gap is defined as the difference between median earnings of men and women relative to median earnings of men, for full-time employees. The employment gap is defined as the difference in percentage points between the employment rates of men and women.
Source: OECD Labour Force Statistics (database).
This Survey focuses on three main challenges. The first relates to housing, which is analysed in the thematic chapter. Strong population growth and supply constraints have made housing prices surge, which worsens affordability problems and creates vulnerabilities for some households and for some banks. The second main challenge is sluggish productivity growth, which has been lasting for several years. The third challenge is to achieve a more sustainable and inclusive growth. Environmental quality has deteriorated due to transport emissions and congestion related to cross-border commuting and urban sprawl. Facilitating labour market integration of older people is also an issue, notably since under unchanged policies ageing will create a long-term fiscal challenge.
Against this background, this Survey has three main messages:
-
Tackling housing supply constraints, such as land hoarding, and increasing the supply of social rental housing are key to improving housing affordability.
-
Reviving productivity growth will require supporting viable non-frontier firms to catch up, inter alia through digitalisation and related upskilling, and to help frontier firms to innovate more.
-
Growth, equity and sustainability would all benefit from fiscal reforms to address rising pension expenditure and tilt revenues towards environmental and property taxation.
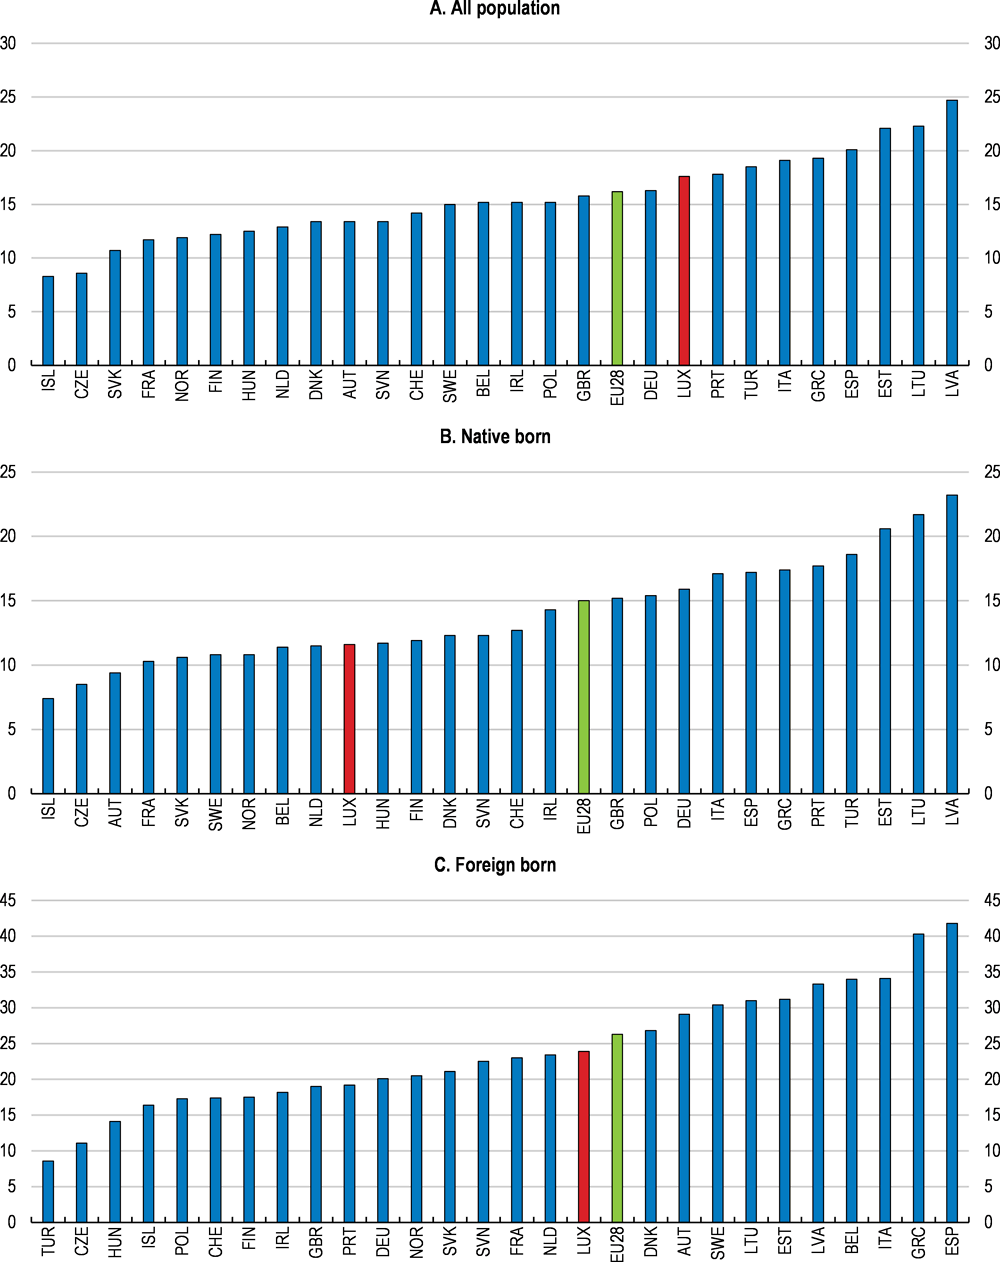
Note: The at-risk-of-poverty rate is the share of people with an equivalised disposable income (after social transfers) below the at-risk-of-poverty threshold, which is set at 60 % of the national median equivalised disposable income after social transfers.
Source: Eurostat, "Income and living conditions".
Growth has been solid, but there are risks ahead
After somewhat lower figures in 2016-2017, mainly caused by disappointing developments in the non-financial sector, GDP growth rebounded in 2018, outperforming the euro area average (Table 1 and Figure 4, Panel A). The lasting effects of the 2017 cuts in personal income taxation, high household confidence and a strong labour market have all boosted private consumption. The unemployment rate has declined to just above 5%, although it remains elevated among young workers (Figure 4, Panel B).
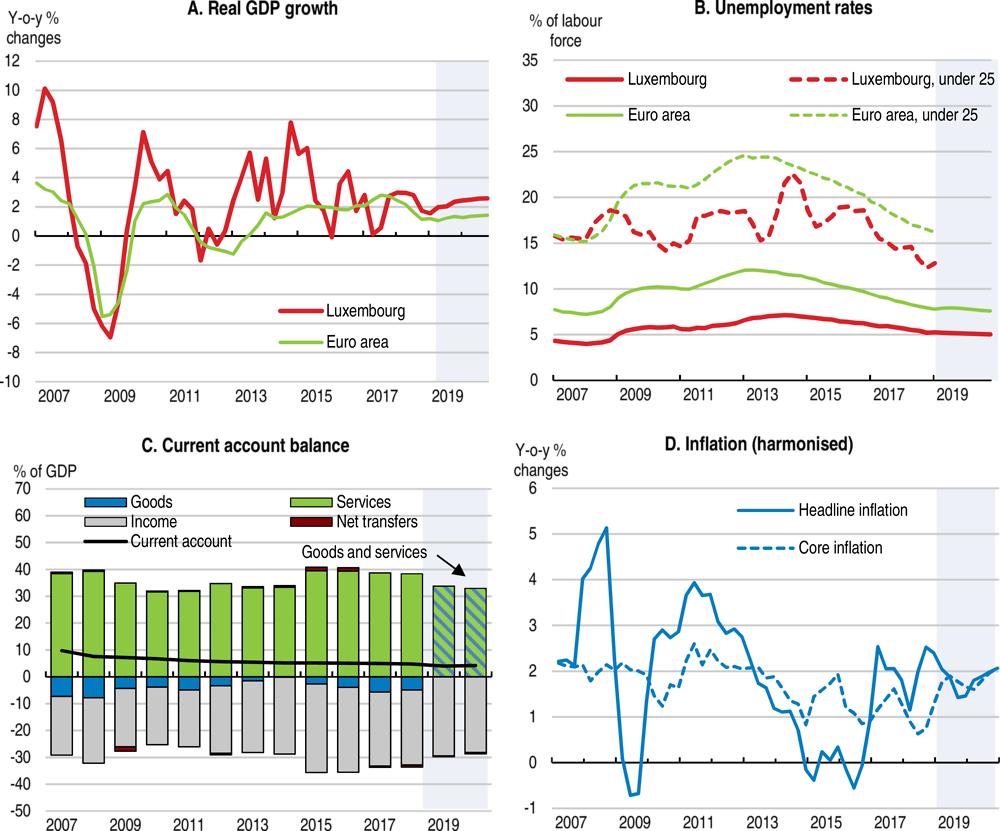
Source: OECD Economic Outlook (database); Eurostat, Employment and Unemployment (Labour Force Survey) Statistics; OECD National Accounts Statistics.
However, growth has slowed down towards the end of 2018, in line with developments in the euro area as a whole. Prospects of subdued euro area growth in the near future are likely to affect Luxembourg, given the very strong trade and financial linkages with euro area partners (Figure 5). In case of a downturn, the government should allow automatic stabilisers to operate and, if the downturn intensifies, implement a countercyclical fiscal expansion, taking advantage of Luxembourg’s ample fiscal space. Building on recent measures, further lowering labour taxation at modest income levels would provide short-run stimulus and foster labour market inclusiveness by reducing unemployment among low-skilled workers.
Risks are both of internal and external nature and have become tilted to the downside (Table 2). At home, rising real estate prices and mortgage indebtedness have stoked vulnerabilities in asset markets and in the resident non-financial sectors; indicators point to historically high risk in the credit and housing markets (Figure 6). As a consequence, house price reversals or steep interest rate hikes could affect some banks. On the external front, rising trade tensions could lower GDP growth by about 1pp in 2019 (STATEC, 2018b). The impact of Brexit is uncertain. On the one hand, potential disruptions could harm the financial sector in case of a “hard Brexit”; on the other hand, some financial firms have already announced the reallocation of their activities to Luxembourg.
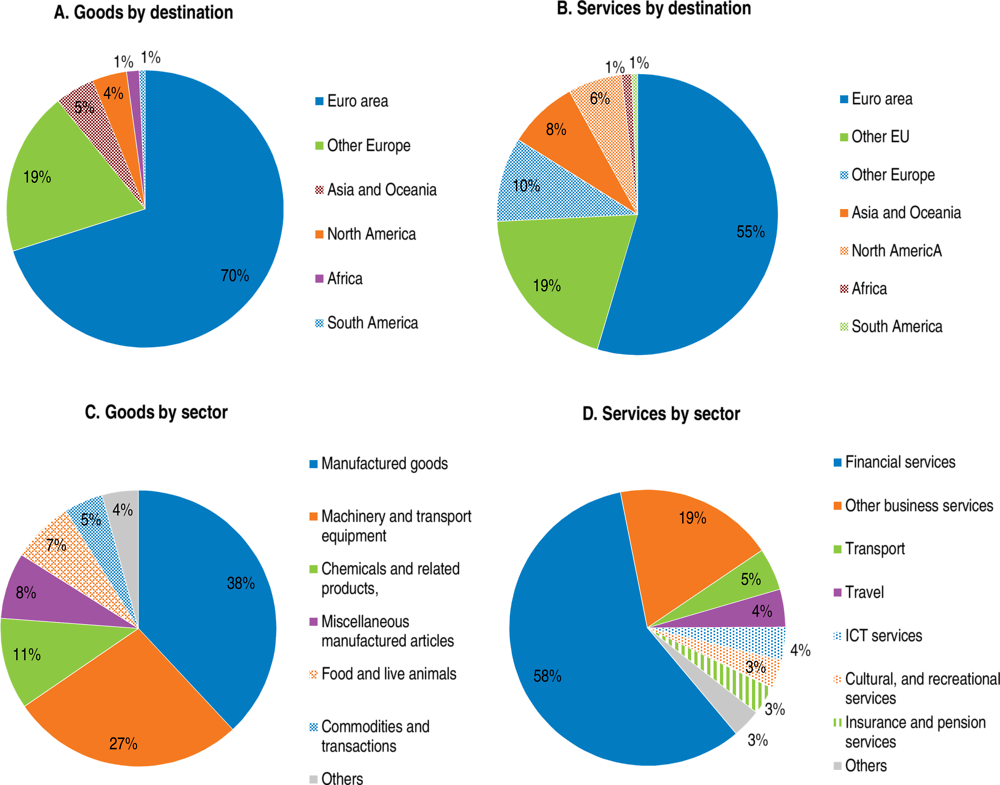
Note: In Panel C, Others include crude materials, beverages and tobacco, mineral fuels and lubricants, and animal and vegetable oils. In Panel D, Others include intellectual property charges, insurance and pension, construction services, maintenance services, and manufacturing services. In 2017, goods made up 13% of exports while services made up 87% of exports.
Source: OECD International Trade Statistics.
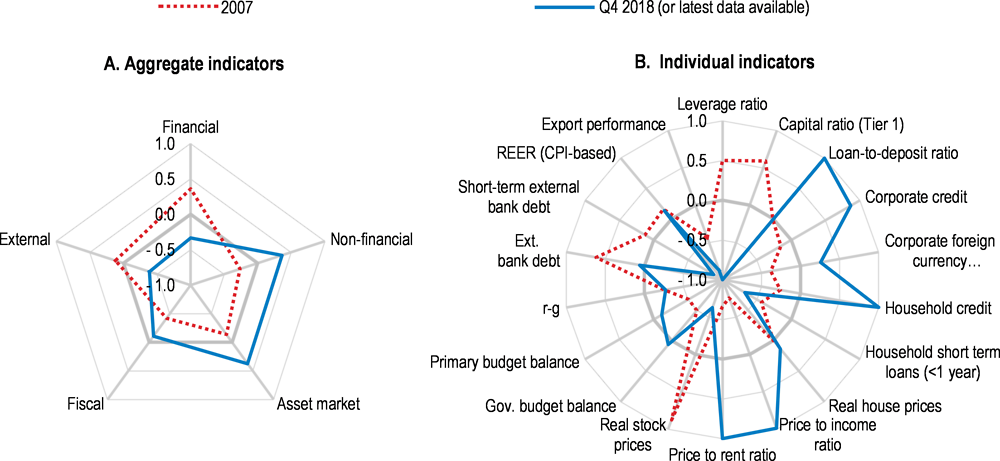
Note: Each aggregate macro-financial vulnerability dimension is calculated by aggregating (simple average) normalised individual indicators from the OECD Resilience Database. Individual indicators are normalised to range between -1 and 1, where -1 to 0 represents deviations from long-term average resulting in less vulnerability, 0 refers to long-term average and 0 to 1 refers to deviations from long-term average resulting in more vulnerability.
Source: Calculations based on OECD (2019a), OECD Resilience Database, February.
Strengthening financial regulation to address risks
External risks to the large financial sector call for enhanced monitoring
The financial sector is the most important pillar of Luxembourg’s economy, accounting in 2017 for 28% of GDP and 10% of total employment (Figure 7). As such, the financial sector is also a major driver of the country’s macroeconomic performance (Figure 8). Luxembourg’s attractiveness for finance is explained by its stable macroeconomic and political environment, multilingual and multicultural society, favourable overall tax settings, efficient legal framework, openness and technological readiness, as well as by its capacity to attract and retain talent, thus creating a pool of labour with the required skills and expertise (Global Competitiveness Report, 2017).
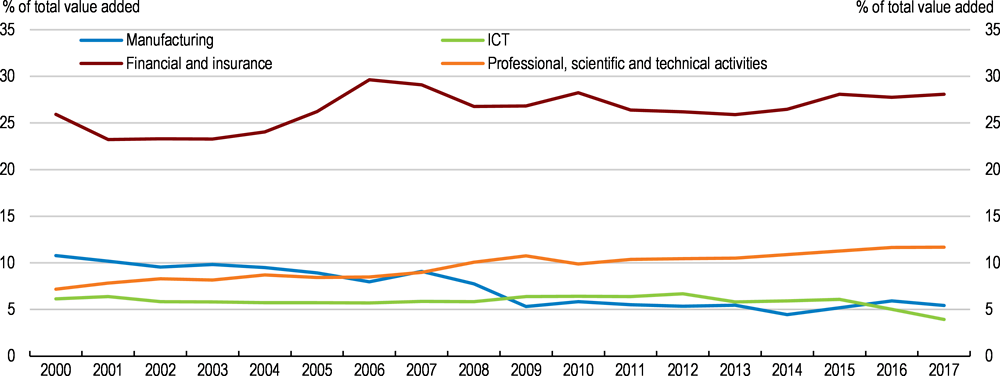
Source: OECD National Accounts database.
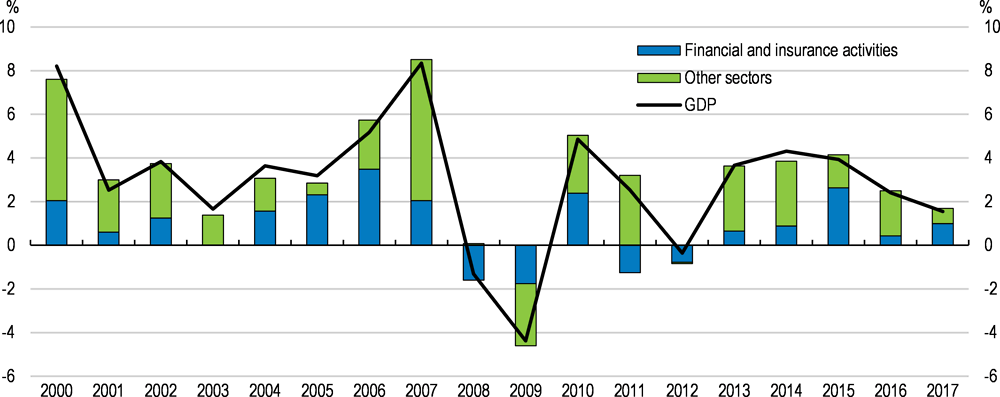
Source: OECD National Accounts database.
Luxembourg investment funds rank second worldwide in terms of assets held, after the US, and operate on global financial markets. Indeed, actors from around the world invest in funds domiciled in Luxembourg, which in turn invest in various markets and asset classes abroad. The banking sector mainly comprises international banks with many cross-border activities. Many of these banks are foreign-owned with parent companies abroad, such that at the end of 2017, 83% of total inter-bank credit consisted in intra-group lending (BCL, 2018). Finally, these various actors are strongly inter-connected since investment funds hold deposits and claims over depository banks, although, according to the financial supervisor, the Commission de Surveillance du Secteur Financier (CSSF), internal stress testing shows that this interconnection does not represent a major channel of risk.
Linkages of credit institutions and investment funds to international markets expose the domestic economy to external financial shocks. In particular, heightened financial volatility and tensions on global stock markets could affect the fund industry. Assets under management have been growing rapidly since the global financial crisis, due to decreased bank intermediation, the expansion of the ECB balance sheet and the low interest rate environment, which created abundant liquidity and motivated search for higher yield (Figure 9). However, the financial market volatility observed in 2018 weighed on the expansion of the sector compared to previous years, illustrating its sensitivity to the materialization of external risks (STATEC, 2018b).
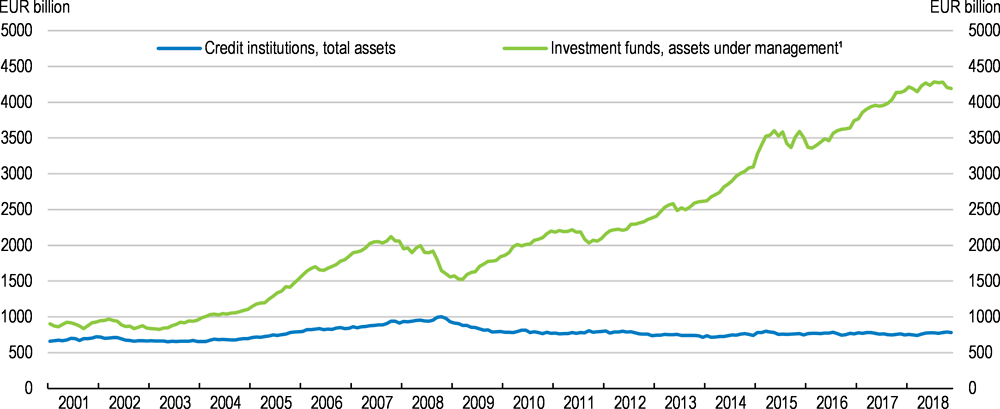
1. Undertakings for collective investment (UCI), net assets.
Source: Banque centrale du Luxembourg, Statistical tables.
The financial sector’s exposure to external risks warrants substantial surveillance and monitoring. In addition to the supervision conducted by the ECB, the CSSF has been increasing its staff and runs on-site inspections and fund-bank stress tests twice a year, which is welcome, in addition to engaging in international institutions. Efforts to monitor and supervise must continue to keep pace with the financial sector’s size and complexity. For example, regarding the fund industry, authorities must keep up on-site inspections and pursue efforts to close remaining data gaps, so that supervision on an individual fund basis can be enhanced. Furthermore, credit risks on intra-group exposures in the banking sector should continue to be closely monitored. These exposures build up through liquidity transfers to parent banks abroad, under an exemption from large exposure limits for intra-group exposures. The supervisor should continue to verify that these exemptions still comply with the conditions set out by law , assess the risk arising from the resulting intra-group exposure, and recall the exemption if need be.
Macroprudential tools can help contain soaring house prices
Housing prices have been increasing strongly since the crisis (Figure 10), which is likely to reflect structural factors, as discussed in the thematic chapter. Strong economic and demographic growth has been pushing up demand. Owing to low interest rates and tax deductibility of mortgage interest payments, this demand has been increasingly financed by indebtedness. As residential real estate construction has remained subdued due to supply constraints, this has resulted in steep price rises.
Source: OECD Analytical House Price Indicators.
Mortgage debt represented 91% of total household liabilities in 2014 (Girshina et al., 2017). Rising debt has made Luxembourg’s debt-to-income (DTI) ratio comparatively high, at 176% in 2017 against 108% for the EU average (BCL, 2018). The same holds for the debt-service-to-income (DSTI) ratio (17%, against 14% for the OECD average). In contrast, at 34%, the loan-to-value (LTV) ratio is below the OECD average (43%), reflecting households’ high assets, which are partly a consequence of rising house prices.
One way to assess vulnerabilities linked to the real estate market is to determine the share of households whose debt burden exceeds some commonly accepted thresholds. These households could be vulnerable to real estate price drops, income losses or interest rate hikes, as most outstanding loans are variable-rate ones (BCL, 2018). In Luxembourg, the share of vulnerable households on the basis of the debt-to-income and debt-service-to-income ratios is internationally high, while the opposite is true for the loan-to-value ratio (Figure 11).
For all three indicators, however, Luxembourg’s shares are among the highest when focussing on households in the bottom wealth quintile. Moreover, younger households are more likely to be financially vulnerable (Giordana and Ziegelmeyer, 2017). As regards bank vulnerabilities, exposures to the real estate market represent 50% of GDP (ESRB, 2016) and are concentrated in a small number of domestic banks, including some identified as systemically important (BCL, 2018). However, according to the CSSF, regular stress testing shows that banks would withstand extreme mortgage default rates and house price declines as observed in the context of the 2008 crisis without the need of recapitalization.
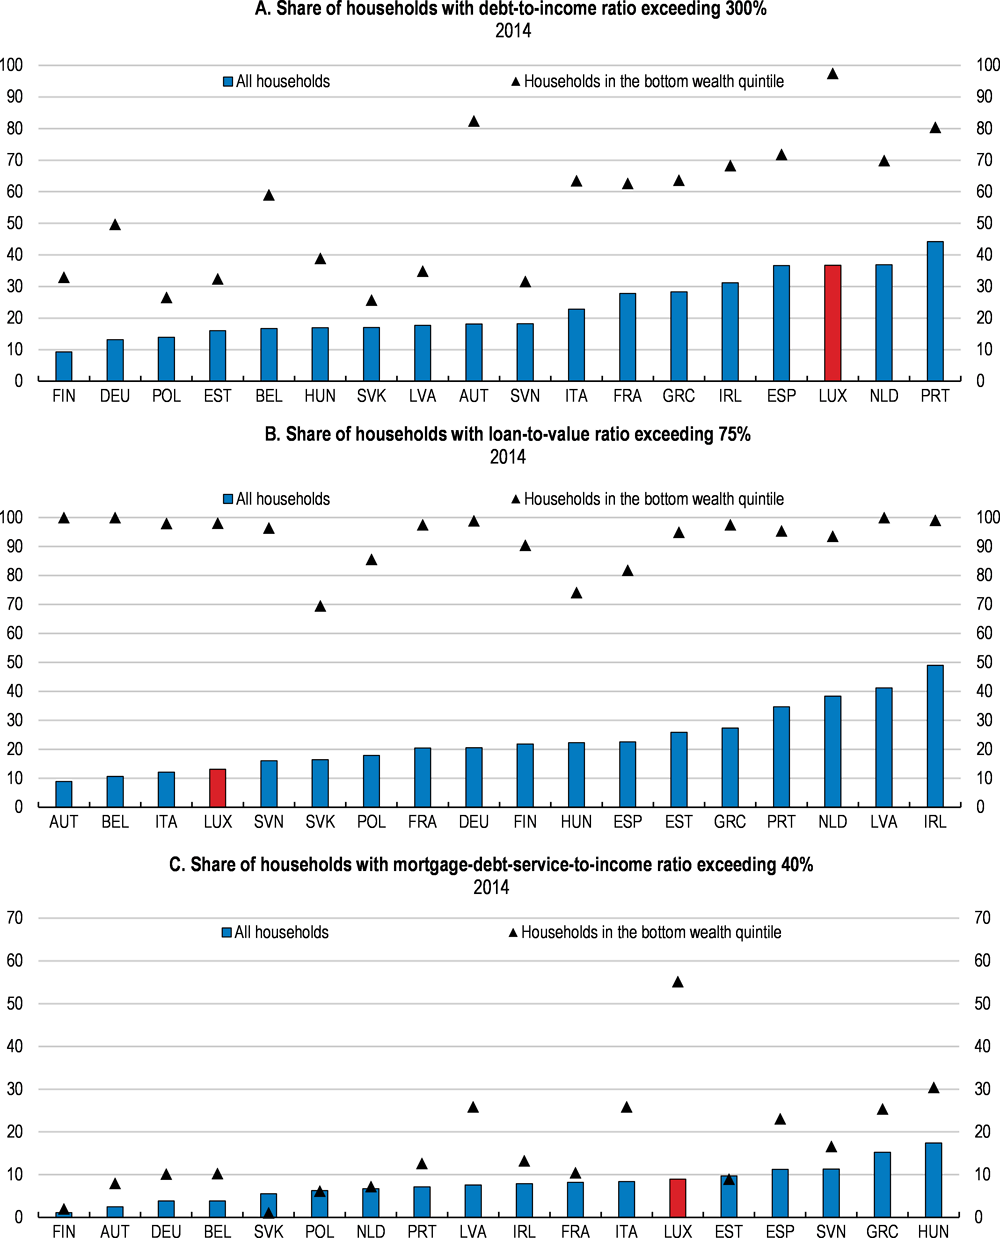
Note: Computations of these shares only include households with mortgage on their main residence. The debt-to-income ratio calculates outstanding debt on main residence divided by annual household gross income. The loan-to-value ratio computes the outstanding stock of main residence mortgages divided by the current value of the main residence. The debt-service-to-income ratio represents monthly debt service payment on main residence (including interest and principal, excluding taxes) divided by monthly household gross income. The thresholds of respectively 300%, 75% and 40% are commonly used in the literature on household financial vulnerabilities, for example in studies covering Luxembourg (Giordana and Ziegelmeyer, 2017), the euro area (ECB, 2013) or the UK (IMF, 2011).
Source: HFCS database, LWS database, OECD Affordable Housing Database.
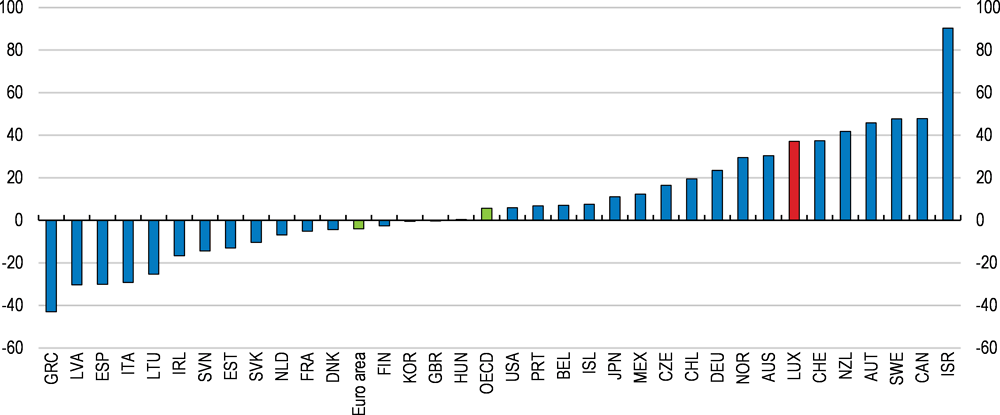
Sustained increases in housing prices and household indebtedness warrant expanding the macroprudential toolkit. In 2016, the ESRB issued a warning to Luxembourg, considering that the existing policies were insufficient to contain risks and financial vulnerabilities in the residential real estate market (ESRB, 2016). In the light of fast-paced credit growth, Luxembourg has been stepping up its macroprudential capital requirements, upon recommendations of the Comité du Risque Systémique (CdRS). Since 2012, banks must use a 75% (instead of the standard 35%) risk weight for the part of a new mortgage loan above an LTV of 80%. In 2014 Luxembourg introduced a capital conservation buffer of 2.5%, in 2016 an O-SII (Other Systemically Important Institutions) buffer, and at the end of 2018 the counter-cyclical capital buffer was raised to 0.25%. However, there are currently no measures focussing specifically on borrower risks in Luxembourg, while this type of instrument has been increasingly adopted in OECD countries (Figure 12). The relatively recent implementation of these measures makes it difficult to assess their impact. However, a growing empirical literature points to the effectiveness of LTV and DSTI ratios to contain mortgage lending and house price increases (Cerutti et al., 2017; IMF, 2014; Lim et al., 2011; Kuttner and Shim, 2013).
A 2018 draft law would enable the CSSF to set limits to mortgage credit, including DTI, LTV and DSTI caps, upon the recommendation of the Conseil du Risque Systémique (CdRS) and after consulting with the central bank. The draft law received a favourable opinion from the ECB and is pending Parliament approval. Like other European countries facing tensions in their housing markets, Luxembourg should move ahead in the implementation of this type of borrower-based macro-prudential instruments.
Additionally, the authorities should be prepared to use remedial measures in the event of a serious housing market downturn, which could depress household consumption through negative wealth effects, and produce financial stress. For instance, the authorities could consider a temporary cut in transaction taxes for houses sold in a given (low) price range. Such policy has been found effective in the UK to uphold consumer spending and minimise house price falls (Best and Kleven, 2017).
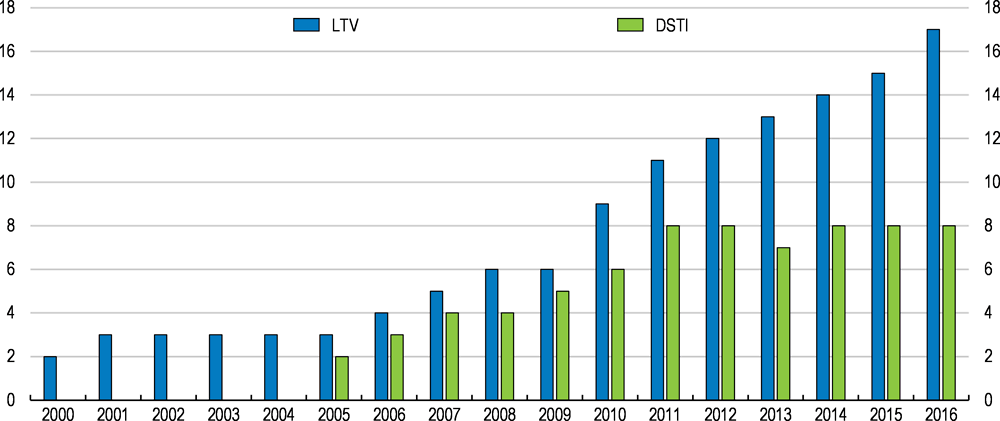
Source: OECD Resilience database.
Luxembourg has become a gateway for fintech and big tech firms
Luxembourg has succeeded in attracting prominent fintech and big tech companies. Licensed by the Minister of Finance (upon advice from the CSSF) to perform different activities (e.g. those of banking, payment or e-money institutions), these companies then service customers all over Europe. Some of these firms offer online checking accounts and payment services with lower fees than those charged by incumbent banks. Others operate trading platforms for virtual assets (or cryptoassets). Others still are exploring the use of blockchain (or distributed ledger technology) to cut costs in the fund distribution (ILNAS, 2018).
It is still early to assess the contribution of these strands of innovative finance to economic activity through conventional metrics, like value added or employment. But they clearly have the potential to help preserve and enhance Luxembourg’s competitive edge in financial services. At the same time, fintech and big tech activities raise important regulatory issues, often with a cross-border dimension, which calls for action at the EU level.
Large cryptoasset trading platforms raise unfair trading concerns
Cryptoasset trading platforms allow buying and selling cryptoassets as well as the conversion of cryptoassets into fiat currency. Luxembourg is home to two entities of two large groups active in trading, Bitstamp and bitFlyer, which also operate as payment institutions. Bitstamp, for instance, ranks third among cryptoasset trading platforms with respect to the Bitcoin trading against the Euro, with around 10% of global market share. Bitstamp Europe S.A. (the Luxembourg entity) operates as a payment institution only and does not have any cryptoasset trading platform in Luxembourg, whereas bitFlyer Europe S.A. (the Luxembourg entity), in addition to payment services, operates a cryptoasset trading platform.
The CSSF was the first EU supervisor to have granted a license of a payment institution to these platforms, covering the fiat currency part of their activities, thus requiring compliance with legislation to prevent money laundering and terrorist financing, as well as with relevant regulation in other areas (e.g., governance, internal control). However, the payment regulations in Europe do not cover risks related to cryptoasset trading, such as market manipulation and insider trading. There is growing evidence of price manipulation in the bitcoin markets (Gandal et al., 2018; Griffin and Shams, 2018). In this context, a recent report based on questionnaires sent to major platforms operating in the US (Office of the New York Attorney General, 2018) found that often those platforms have not implemented any formal policy to detect market manipulation and it is not clear either whether those platforms prevent insider trading. Furthermore, there is no European or Luxembourg regulation setting rigorous standards for listing a new cryptoasset, and platforms themselves do not have such standards either.
There is therefore a case for regulation of trading activities of cryptoasset trading platforms, but still no international “best practices” in this domain. The EU authorities have not yet decided whether to consider cryptoassets as transferable securities and, hence, the EU financial rules (e.g. MiFID II, the Market Abuse Directive) do not apply to their trading (ESMA, 2019). The authorities in Luxembourg have always been in favour of trying to fit the new business models into existing European regulation (such as the directive on payment services PSD2), rather than developing specific regulation on their own while waiting for a common EU solution. Other jurisdictions have designed a specialized license (e.g BitLicense in New York, amended Payment Services Act in Japan and the recently adopted PACTE law in France), and China has banned these platforms altogether (in 2017). Numerous consultations and reports suggest that policy makers are in the process of learning about this new asset class (e.g. ESMA, 2018, 2019; OECD, 2019a; Le Moign, 2018).
To foster learning on how best to ensure fair trading, the CSSF should have the legal capacity to conduct inquiries into the activities of trading platforms. As of now, the legal power of the CSSF is limited to issuing warnings to retail investors about cryptoasset related risks and it does not have any supervisory power over these cryptoasset activities. Eventually, trading platforms should be subject to regulation similar to the regulation of other market operators, preferably at the EU level, to prevent regulatory competition (ESMA, 2019). In addition, the CSSF should continue, in line with the warnings issued in 2018, to disseminate information to investors about the risks of virtual currencies.
Enforcement against international corruption needs to be stepped up
Luxembourg is regarded as one of the least corrupt countries in the world, according to different indices of perception of corruption (Figure 13). Fighting corruption is important for ethical, political and economic reasons. On the economic front, it undermines the business climate, distorts competition and can be a major driver of public spending inefficiency. Across the EU, Luxembourg residents are among those who perceive corruption to be less of a problem both in public institutions and as part of the country’s business culture (European Commission, 2017).
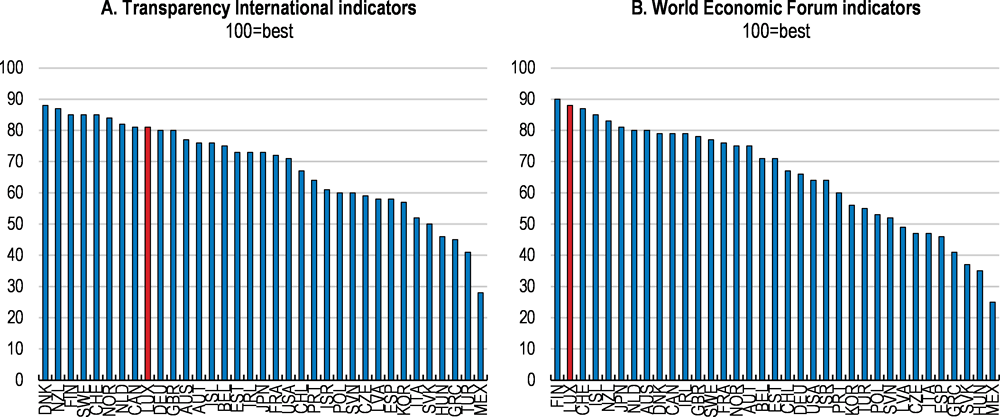
Note: “Transparency International indicators” refers to the average of five sub-indicators available for all OECD countries in the “Corruption Perception Index”; “WEF indicators” refers to the World Economic Forum’s Executive Opinion Survey.
Source: Transparency International; and World Economic Forum.
However, the large magnitude of capital flows involving Luxembourg poses associated risks of economic crime, especially of a cross-border nature. A case in point is bribery of foreign public officials. Luxembourg’s enforcement of the OECD Anti-Bribery Convention remains very modest, with only one criminal case concluded over 1999-2017, and only one individual sanctioned (OECD, 2018f). The authorities claim that recent draft legislation will, when approved, implement two OECD recommendations for combatting this form of corruption. They have also mentioned that Luxembourg has adequately responded to requests for mutual legal assistance from other countries, sanctioned one case in 2018, and investigated two more cases that are still ongoing. Progress on enforcement will be assessed by the OECD Working Group on Bribery, with the next evaluation of Luxembourg scheduled for 2021.
Luxembourg faces an inherent high risk of money laundering of foreign proceeds. The legal framework to fight money laundering has been upgraded with the transposition into national law of the 4th EU Anti-Money Laundering Directive, which was completed in 2018. Active enforcement is key for risk mitigation, and should be informed by the national risk assessment exercise completed in 2018. In this context, a register of beneficial owners of corporate and other legal entities, which will help detection, has been set up by recent legislation (January 2019), and will be accessible to the authorities as of September this year. A draft bill setting up a separate register of beneficial owners of trusts and other types of legal arrangements is under preparation as part of the transposition of the 5th EU Anti-Money Laundering Directive.
Fiscal reforms for inclusive growth and sustainability
The fiscal position is strong, but ageing poses a long-term challenge
Luxembourg has a fiscal surplus, which has been on an upward trend since the crisis (Figure 14). After a slight decline in 2017, due to expansionary measures included in the tax reforms and the loss of e-commerce VAT, the surplus exceeded 2% of GDP in 2018, far above Luxembourg’s Medium Term Objective for 2016-2019 (-0.5% of GDP). Gross public debt is among the lowest in the OECD, at 21% of GDP by end-2018. The government’s objective to keep the public debt ratio below 30% and preserve the AAA rating in the 2018-2023 legislature appears well within reach. Being a small open economy, it is important for Luxembourg to maintain ample fiscal space. However, there is significant budgetary room for manoeuvre, which could be used to support the economy in case of a downturn characterised by weak demand.
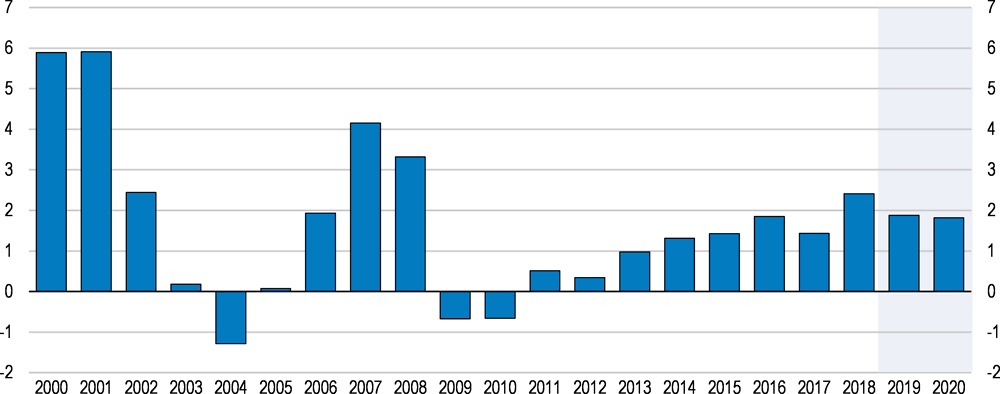
Source: OECD Economic Outlook (database).
The pension system enjoys a comfortable situation in the short to medium term, with a sizeable surplus of contributions over outlays and considerable accumulated assets. Luxembourg has a detailed monitoring system in place, including a reassessment of the financing of the general pension scheme every 5 years. In the future, when some conditions are met, the authorities will be under a legal obligation to implement reforms, to be decided and fully specified at the time. For instance, as per the 2012 pension reform, the automatic indexation of pensions to wage developments is to be reduced (to an adjustable extent) when contributions no longer cover pension expenditure. The 2012 reform also outlines other possibilities, such as a suspension of end-of-the-year pensions (“allocation de fin d’année”). Another mechanism is an increase in contributions, to be decided when the reassessment taking place every 5 years concludes that, under current parameters, the financial viability of the system is no longer guaranteed according to pre-defined thresholds.
However, the relatively high replacement rates and low effective retirement age of the pension system (OECD, 2017a) will entail considerable fiscal pressure in the long run. Under the current parameters, ageing-related costs are projected to rise substantially (EC, 2018a; Figure 15): for instance, public expenditure on pensions is estimated to reach 18% of GDP by 2070, against 11% on average in the EU. In this no-policy-change scenario, there would be a large impact on public debt (Figure 16). Soaring pension costs stem from an increasing dependency ratio (due to rising longevity) which is not compensated, unlike in other EU countries, by an increasing retirement age or decreasing replacement rates (EC, 2018a).
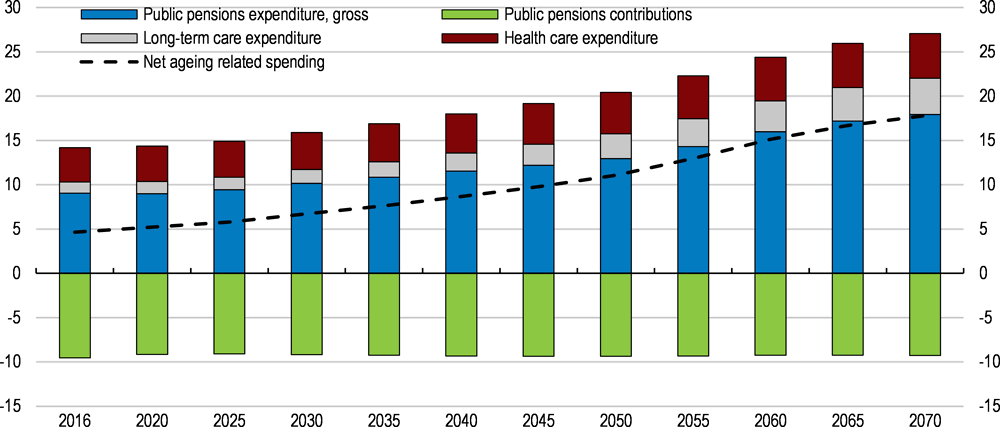
Note: Costs are interpolated based on projected figures for every 5 years, assuming no change in the current parameters of the pension system. Net ageing-related costs amount to public expenditure on pensions, long-term care and health care minus pension contributions.
Source: European Commission (2018a).
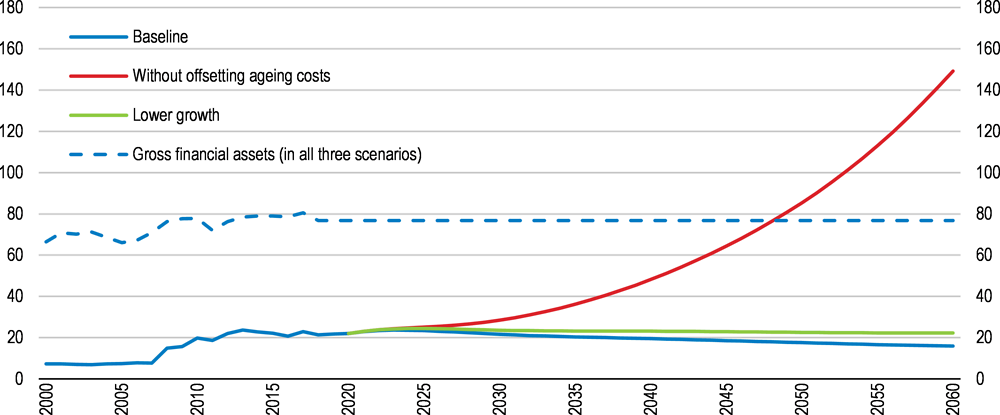
Note: The baseline consists of the Economic Outlook No. 105 projections up to 2020, and the long-term projections of the Economic Outlook No. 105 database afterwards. These long-term projections include a primary balance gradually converging from 2 to 1% of GDP over the long-term, a real GDP growth rate close to 2.5% and a real interest rate close to 1%. The "Lower growth" scenario assumes real GDP growth lower by 1% each year compared to the baseline. The "Without offsetting ageing costs" scenario assumes no change in the current parameters of the pension system, and hence increased net ageing-related costs (reaching 17.8% of GDP by 2070), in line with European Commission (2018a). All three scenarios assume that over the projection horizon general government gross financial assets remain constant as a fraction of GDP, which implies that the change in the general government gross debt-to-GDP ratio is larger than what would be implied by government net lending and nominal GDP growth only.
Source: Adapted from OECD (2018), OECD Economic Outlook: Statistics and Projections (database), June; Guillemette, Y. and D. Turner (2018), "The Long View: Scenarios for the World Economy to 2060", OECD Economic Policy Paper No. 22., OECD Publishing, Paris; and European Commission (2018a), "The 2018 Ageing Report - Economic and budgetary projections for the 28 EU Member States (2016-2070)" Directorate-General for Economic and Financial Affairs.
To contain these costs and ensure long-term sustainability, Luxembourg should adapt its pension system, with the involvement of social partners and, if needed, gradual phasing-in of reforms. Unlike in many other European countries, there are no plans to link the retirement age to changes in life expectancy (OECD, 2017b), and therefore creating this link should be considered. Furthermore, the gap between the statutory and effective retirement age (65 against 61 in 2016) indicates that there is scope to restrict early retirement schemes. Increasing the retirement age can have a regressive impact since more educated and richer people tend to live longer; however, when the increase is linked to longevity, the overall impact depends on how even across socio-economic groups gains in life expectancy are (OECD, 2017c). Compensatory measures could be taken (or kept) for those who started to work at a very young age since they are also those who tend to have a lower life expectancy. In parallel or as an alternative to a higher retirement age, the generosity of the replacement rate could be reviewed (IMF, 2019a).
Further adjusting corporate taxation to a globalised world
As a highly open economy, Luxembourg is sensitive to taxation developments at the European and global levels. Luxembourg has been supportive of initiatives for greater tax transparency and for tackling tax avoidance, such as the OECD/G20 Base Erosion and Profit Shifting (BEPS) project. Notably, the country was among the 49 “early adopters” of the OECD’s Common Reporting Standard for the automatic exchange of financial account information, with the first such exchange, which now covers almost 100 partner countries, taking place in 2017. Additionally, Luxembourg has been found “largely compliant” with the OECD standard for exchange of information on request, and agreed to implement provisions against tax avoidance in bilateral tax treaties. Furthermore, in line with efforts under the BEPS project and at the EU level, Luxembourg has since 2016 made substantial progress as regards exchange of information on tax rulings with partners’ tax administrations (OECD, 2018a). Past tax arrangements may have contributed to very low effective tax rates on large corporations (Wright and Zucman, 2018).
Hybrid mismatches can cause undue tax advantages, arising from cross-country differences in the tax classification of payments, entities or business activities. This will be the case, for example, if an entity of a multinational firm located in a specific country makes a tax-deductible payment to another entity of the same multinational in another country, where this revenue is not taxed. Luxembourg transposed into law the Anti-Tax Avoidance Directive 1 (ATAD 1), entering into force in 2019, which inter alia neutralises hybrid mismatches between EU member states. The authorities should continue to implement tax transparency rules, in particular through the transposition into law of the ATAD 2 rules. They include rules on hybrid mismatches which extend the scope of ATAD 1 rules by covering mismatches with third countries.
To partly offset the broadening of the tax base induced by these developments, the corporate income tax rate was decreased to 18% in 2018 and cut by a further 1% in 2019, bringing the maximum statutory combined rate (inclusive of a municipal surcharge) down to 25% in Luxembourg city.
Existing tax rules for the allocation of taxable profit among countries are under pressure from the challenges posed by the digitalisation of the economy (OECD, 2018a; Devereux and Vella, 2017). Innovative finance strands, such as fintech, are concerned by these issues. Luxembourg should continue to take part in the ongoing work on a global and consensus-based approach to address the tax challenges arising from the digitalised economy.
Improving work incentives and diversifying tax bases
Individual taxation for resident and cross-border workers was introduced on an optional basis in 2018. This reduces the marginal taxation of second earners, increasing their work incentives. Since second earners tend to be women, sometimes working part-time, individual taxation is also welcome from a gender neutrality and inclusion perspective. The authorities are analysing the feasibility of full individual taxation, which would be welcome as it would reinforce the impact on work decisions (OECD, 2017a). In addition, further efforts have been announced to simplify the tax system, and to promote and improve electronic tax declaration.
Other avenues for fiscal policy to promote an inclusive labour market should be exploited. Vulnerable groups like young low-skilled workers still face higher unemployment (Figure 17). The participation rate of women lags behind that of men, at 66% against 74% in 2017 respectively. Addressing disincentives from the tax-benefit system would promote labour market inclusiveness. The welfare system is generous: in 2015, total social expenditure reached 33% of GNI, against 20% for the OECD average. However, the loss of social benefits combined with labour taxation when taking up a job often generates important unemployment traps, and low-earning households may find that it is not worth re-entering employment (Figure 18). The newly implemented Revis (Revenu d’inclusion sociale), which replaced the minimum guaranteed income, is a welcome step to alleviate these disincentives (Box 1). From 2019, an existing tax credit for wage earners (the crédit d’impôt salarié), at most 600 euros per year, will be complemented by a new minimum social wage tax credit of 70 euro per month for salaries at or closely above the minimum social wage. Greater use of in-work tax credits for earners further above the minimum social wage could still be considered.
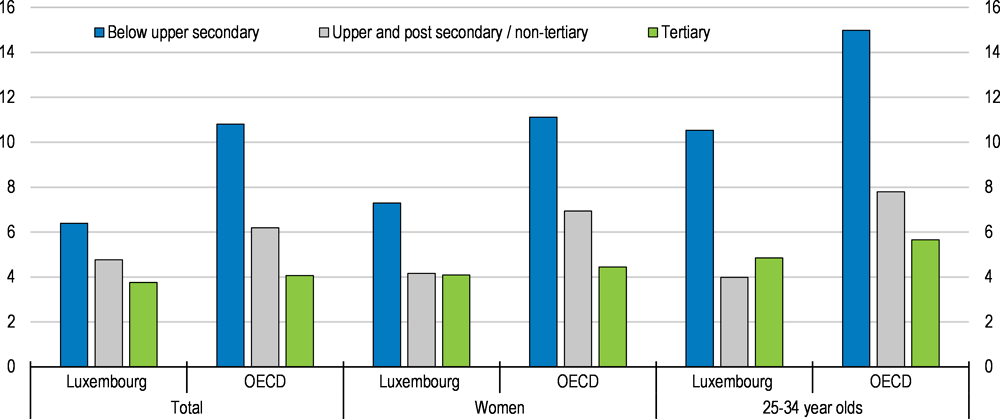
Note: For Luxembourg 25-34 year old bottom upper secondary educational attainment group, 2015 is the latest data available.
Source: OECD Education and Training Database.
Some measures have been taken to address work disincentives, such as the introduction of the Revenu d’inclusion sociale (Revis), which replaces the minimum guaranteed income as of 2019. The Revis is made of two components. The first is a social inclusion benefit calculated for the household and accounting for personal and common expenses such as housing. Not to discourage work, 25% of professional income (as well as of replacement income and pensions) are excluded from the calculation of this component. The second component of Revis is an activation benefit consisting in an allowance for activities organized by the social inclusion office (ONIS), such as community work or activities favouring social stabilization. The former eligibility criterion of no more than 40 hours of activation measures per week for the household as a whole has been removed. Beneficiaries who are evaluated as being fit for work must be registered at the employment agency (ADEM) and provide evidence that they are actively looking for a job.
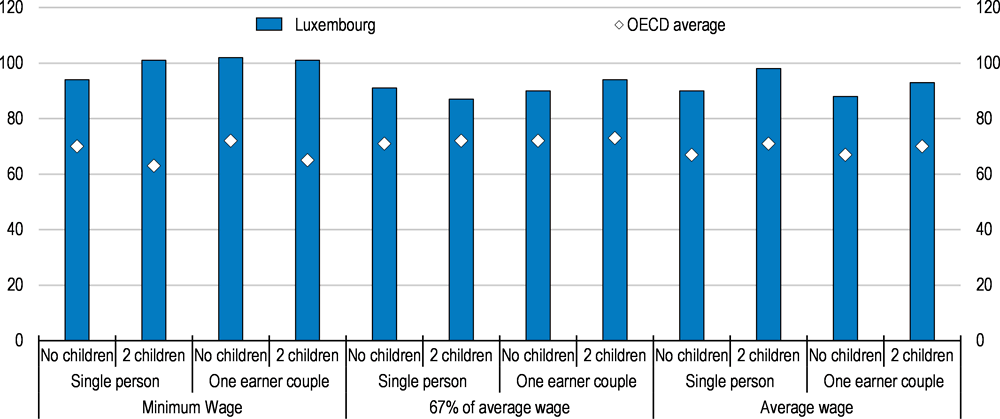
Source: OECD Benefits and Wages database.
To make the tax mix more supportive of sustainable growth and accommodate potential revenue losses from greater international corporate tax transparency (IMF, 2019b), Luxembourg should diversify its tax revenues. Currently, Luxembourg obtains more revenue from the corporate income tax than other European countries (4.6% of GDP against 2.8% in 2016), including a volatile share from the financial sector (OECD, 2017a). The tax base could be diversified on two fronts. First, recurrent taxes on immovable property are the lowest in the OECD (Figure 19). Measures to increase taxation of the real estate sector should be envisaged, with the additional benefit of addressing some of the structural factors responsible for the strong increases in housing prices over the past years. For example, increasing effective taxation of non-used constructible land could be an avenue to address the low incentives to build on available land. The thematic Chapter discusses property taxation in more detail. Additionally, phasing out or at least reducing the tax deductibility of mortgage interest payments would be welcome.
Second, Luxembourg lags behind in environmentally-related taxation (Figure 19). Fuel taxation revenues are close to the average, reflecting significant fuel tourism induced by lower taxes than in neighbouring countries. Diesel taxes are particularly low. Although the authorities have raised petrol tax by 1 cent and diesel tax by 2 cents in 2019, such increases do not appear sufficient to curb incentives to cross the border and buy fuel in Luxembourg (OECD, 2018b). Taxes and excise duties on transport fuel should therefore be increased further, combined with targeted social support measures. There are CO2-based tax incentives to encourage purchases and usage of cars with low emissions (the “taxe sur les véhicules routiers”).
The 2017 tax reform also modified the benefit in kind for company vehicles, depending on the type of engine and CO2 emissions, and introduced a tax allowance for personal hybrid and electric cars. However car taxation is comparatively low (Figure 19), which may help to explain why average CO2 emissions from new cars are above the EU average (European Environment Agency, 2018). This suggests that there is scope to increase car taxation further, for example by taking account of both CO2 emissions and local air pollution. Box 2 shows that recommended reforms whose fiscal impact lends itself more easily to quantification would amount to a non-negligible increase in taxation. However, other tax reforms, which are harder to quantify, would tend to have the opposite impact. In any case, even if the overall impact could be broadly neutral, recommended tax increases should be deferred in case a substantial downturn materializes.
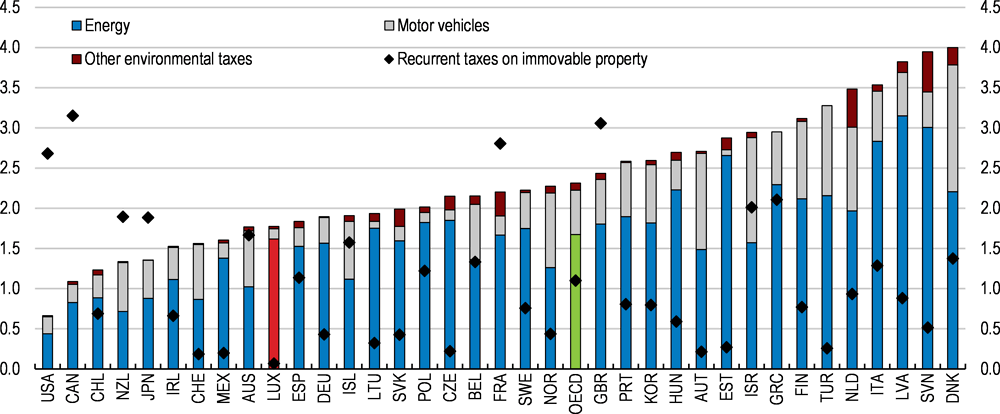
Note: OECD average is a simple average of the countries shown on the figure. For environmental taxes, data is for 2015 for France, 2014 for Canada, Greece, Israel, and Korea. Motor vehicle taxes refer to one-off import or sales taxes, recurrent taxes on registration or road use and other transport taxes.
Source: OECD Green Growth Indicators; and OECD Global Revenue Statistics.
These estimates roughly quantify the annual fiscal impact of selected recommendations in this Survey. Some other recommendations with first-round fiscal impacts are not quantifiable given available information or the complexity of the policy design. This is the case, for instance, with eliminating or reducing mortgage interest deductibility, with decreasing labour taxation at modest income levels and with implementing tax transparency measures. The combined revenue impact of these measures would likely be negative.
Reviving productivity growth in Luxembourg
Understanding productivity developments
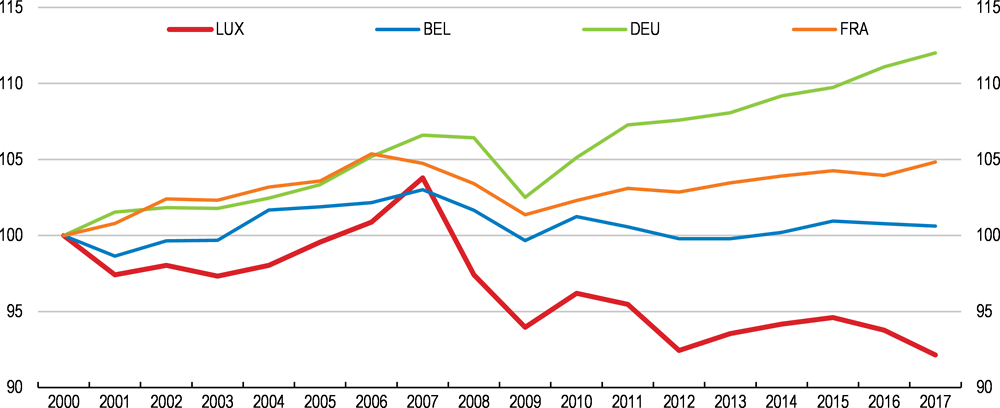
Luxembourg enjoys high levels of productivity vis-à-vis other OECD countries, but productivity growth has been subdued since the turn of the century (Figure 20). Even though most advanced countries saw a productivity slowdown starting in the early 2000’s (OECD, 2015), Luxembourg’s performance appears to be particularly weak. To some extent, this may reflect the intrinsic difficulty of increasing productivity levels for countries close to or at the frontier (Gordon, 2012), but its long lasting nature also signals the presence of structural dimensions. Policy action aiming at increasing productivity features prominently in the agenda of the new government (Box 3).
The new government has outlined its planned policy reforms for the 2018-2023 legislative period in the Coalition Agreement of November 2018. The main measures include:
Digitalisation
-
Providing 5G coverage across the country;
-
Developing a legal framework for businesses of the “sharing economy”, to prevent unfair competition, and to ensure maintenance of ecological and social standards, notably with respect to worker protection;
-
Expanding the range of E-government services and strengthening public support services, for instance through chatbots;
-
Fostering the use of open source software in the public sector;
-
Strengthening digital inclusion of the elderly, through intergenerational computer classes;
-
Developing a national “e-learning” strategy, which will comprise the introduction of a new section for information and communication students in secondary schools and guarantee students access to either laptops or tablets (project “one2one”).
Housing
-
Increasing the public rental housing stock and limiting the sale of public social housing;
-
Reforming the housing assistance system, focussing on single parents and families with children;
-
Stepping up technical assistance to municipalities in the areas of land development, housing construction, sale or renting of land and rental property management;
-
Establishing a New Housing Pact (Pacte logement 2.0) between the state and municipalities, including simplified and generalised use of the pre-emption right;
-
Reforming the property tax to replace the system of specific municipal taxes on undeveloped land and vacant dwellings;
-
Setting up a Committee for acquisition of constructible land involving the Ministry of Housing and the Ministry of Finance;
-
Introducing contracts for housing development and reforming rules for construction on land covered by such contracts.
Mobility
-
Making public transport free of charge from 2020;
-
Introducing a national mobility strategy to accommodate mobility needs until 2035;
-
Doubling the capacity of Park and Ride (P+R) parking by 2025.
Taxation
-
Increasing excise duties on fuel and petrol;
-
Increasing net minimum wages by introducing a minimum social salary tax credit;
-
Revisiting the tax system for cross border commuters to facilitate working from home.
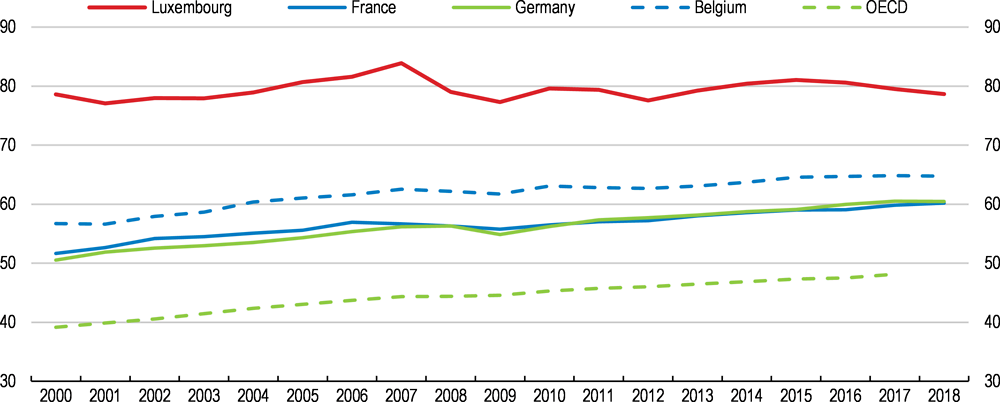
Source: OECD Productivity Indicators Database.
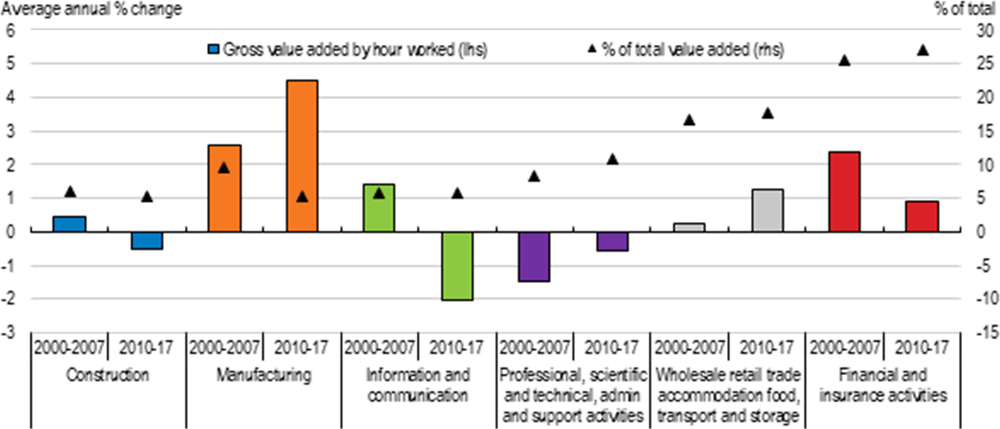
Looking beneath aggregate trends indeed shows that the composition of sectors sustaining business sector productivity growth has changed over time. In particular, the contribution of financial services, a strong driver of aggregate productivity growth in the decade preceding the crisis, significantly diminished in recent years (Figure 21). With persistently low interest rates and tightened banking regulations weighing on value added outcomes, both factors likely contributed to this trend (STATEC, 2018a). Productivity growth in other services sectors and in construction even turned negative. Only the manufacturing sector succeeded to increase its already high levels of productivity growth after 2010. However, since this occurred in tandem with a declining share of value added, the impact on aggregate productivity growth remains limited.
Source: OECD Productivity Indicators.
Firm-level evidence suggests that the source of low aggregate productivity growth lies in the services sector (Figure 22). In this sector, productivity growth for firms at the median and the top of the productivity distribution – hereafter referred to as “median” and “frontier” firms – declined up to 2011 and has broadly stagnated since, while for firms at the bottom of the distribution (“laggards”) productivity levels plunged by 40% between 2005 and 2016. Indeed, a number of services sectors display significant differences between median and average productivity performance, suggesting the presence of low-productivity outliers (Figure 23). In contrast, manufacturing witnessed a decline in productivity growth in the run-up to the global financial crisis, but also a vigorous rebound afterwards, especially for laggards (Figure 22). In the same vein, median productivity almost equals average levels. Although productivity growth since 2005 was particularly weak for small firms (0-49 employees), the observed slowdown in services sector laggards’ productivity performance cannot certainly be associated to only one firm size class (Figure 24).
Overall, the productivity developments above call for policy initiatives to regularly monitor and analyse sectoral changes, especially those induced by Luxembourg’s diversification efforts; to support viable non-frontier firms in their recovery, or ease their exit otherwise; and to help frontier firms push the boundaries towards higher levels of productivity. These three avenues are discussed below. Implementing the recommended reforms is estimated to have significant positive effects on GDP per capita (Box 4).
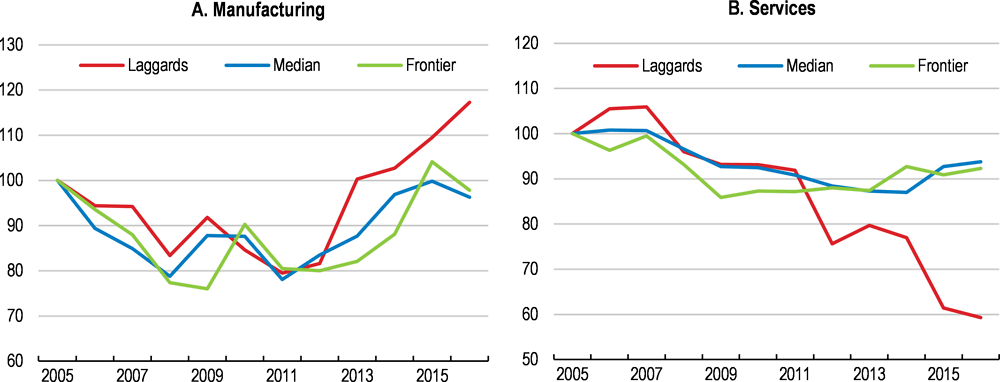
Note: Frontier firms are defined as the top 20% of firms with the highest labour productivity levels by industry; median firms are in the 40th-60th percentiles; and laggard firms correspond to the bottom 20%. Productivity deciles are calculated on a yearly basis. Services refer to non-financial business services. The underlying dataset was cleaned following Berlingieri et al. (2017).
Source: Authors’ calculations based on data from STATEC, structural business statistics.
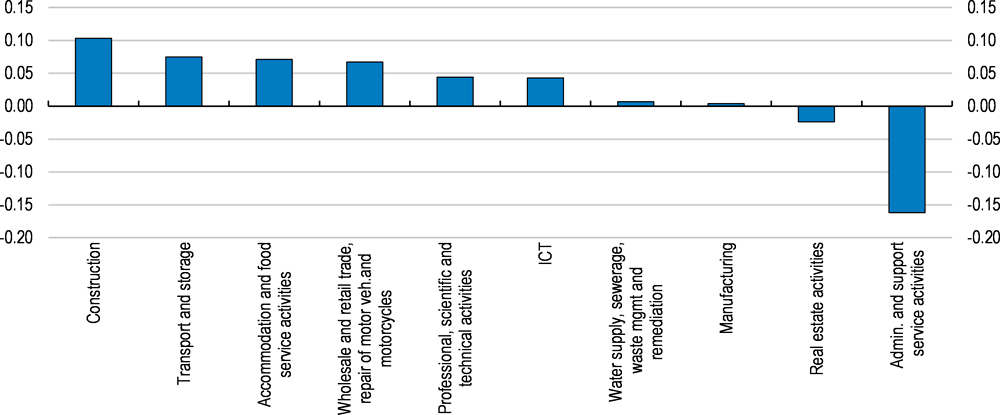
Note: Labour productivity is calculated as value added per person employed. The difference is positive (negative) for sectors in which the median exceeds the average (or vice versa).
Source: Authors’ calculations based on data from STATEC, structural business statistics.
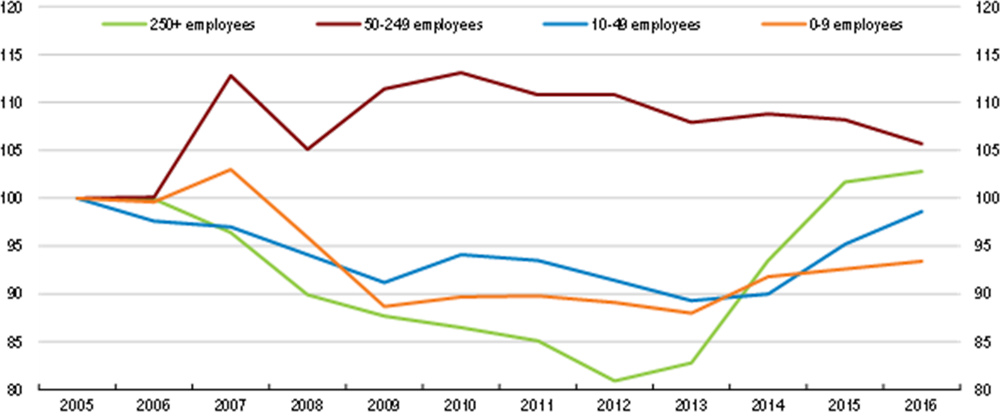
Note: Labour productivity is calculated as value added per person employed. The underlying dataset was cleaned following Berlingieri et al. (2017).
Source: Authors’ calculations based on data from STATEC, structural business statistics.
This box quantifies the effect of some of the structural reforms for Luxembourg recommended in this Survey based on the OECD’s most recent quantification framework (Égert and Gal, 2017). The effects are derived from a range of reduced-form panel regressions on a sample of OECD countries and in some cases non-OECD countries as well. The estimated effects are allowed to vary across countries as a result of differences in factor shares, the level of the employment rate and a country’s demographic composition. The approach is illustrative and results should be interpreted with care.
Additional positive effects could be expected from other recommendations, but these are harder to quantify. Examples include a tax shift towards recurrent real estate taxes, a reform of the insolvency regime and measures to reduce financial risks (which likely decrease the frequency and severity of crises, and therefore the associated hysteresis effects).
Evaluating and adjusting diversification efforts
Luxembourg’s authorities made considerable efforts to diversify the economy over the past years, according to the “Smart Specialisation Strategy” formally adopted by the government in December 2017. The process is based on inputs from the “Third Industrial Revolution”, a large foresight exercise commissioned by the government in 2015 with a view to preparing society for upcoming megatrends and inherent disruptive forces (TIR Consulting Group LLC, 2016; OECD, 2017a). In line with previous recommendations (OECD, 2016a), the strategy focuses primarily on a small number of knowledge-intensive priority sectors, to achieve critical mass and impact (Ministry of the Economy, 2017). For instance, significant efforts were put onto Luxembourg’s space sector, which has recently seen the creation of its own Space Agency (Luxembourg Space Agency). Overall, the strategy is therefore a welcome step towards greater economic resilience, and provides a well-articulated approach of directing innovation policy in a comprehensive way.
Within Luxembourg’s diversification strategy, the information and communication technologies (ICT) sector occupies a special position, as it serves as a common strategic layer on which all other sectors can be grounded. Through cluster policies reinforcing the links between business and research, especially in high-potential areas (e.g. cybersecurity, FinTech, blockchain), continuous investment in connectivity and high-end data centres (OECD, 2016a), and a growing start-up ecosystem fostered by dedicated seed funds (Digital Tech Fund; Fit4Start), Luxembourg indeed succeeded in establishing itself as an ICT hub in Europe (Ministry of the Economy, 2018). As a result, ICT patents doubled from 2000 to 2015 (OECD, 2017d), and employment in the ICT sector as a percentage of total employment is now among the highest in the OECD (OECD, 2017e).
Contrary to these positive developments, however, diversification efforts were not sufficient to strengthen the sector’s share of value added over the past decade, nor could they put a halt to the sector’s declining levels of productivity (Figure 21). Since national accounts data measuring ICT sector productivity growth were recently subject to considerable revisions, the magnitude of the decline should be treated with caution though (see Box 5).
Evaluating the impact of diversification efforts is crucial to assess their efficacy and adjust policy programs if needed. For instance, regularly performing the benchmark exercise proposed by the “Smart Specialisation Strategy” would allow monitoring diversification outcomes and adapting policies to businesses’ innovation progress, while ensuring coherence between all stakeholders involved in the diversification process. Considering the dual role played by the ICT sector (its own growth contributes to the diversification of the economy, but the sector is also key to the digitalisation of the whole business sector), successfully strengthening its growth could entail a double dividend, and therefore merits special attention. In this context, the role of demand-side policy initiatives propelling business sector digitalization should also be examined.
Luxembourg's national accounts underwent significant revisions in October 2018, due to technical difficulties in measuring the performance of a few multinational corporations in non-financial sectors. These revisions had a significantly negative impact on GDP, as average annual GDP growth was corrected downwards from 3.5% to 3.0% over 2014-18 (STATEC, 2018b). Changes to value added were especially pronounced for the ICT sector, initially displaying strong value added growth in 2016-17, which turned negative following the revisions.
Moreover, policies aimed at enhancing productivity greatly benefit from, and increasingly rely on, firm-level analysis, but the availability of micro-founded data for Luxembourg remains scarce. For instance, identifying firm-level determinants of productivity, comparing multinationals’ productivity to that of domestic firms, or determining the role of financial frictions on firm-level productivity are all issues that can only be satisfactorily studied with firm-level data (Kalemli-Özcan et al., 2015). One ongoing initiative to address this shortage is Luxembourg’s participation in the next round of the OECD MultiProdproject, but micro-level data that is already available within national institutions should be further exploited.
Finally, an additional difficulty in measuring and interpreting economic activity in Luxembourg is the vast difference between GDP and GNI (gross national income), which in relative terms is the highest across the OECD. GNI excludes income from domestic production accruing to non-residents. Given that cross-border workers account for over 40% of employment, and that numerous multinational corporations operate in Luxembourg, GNI only amounts to 71% of GDP (2017 data). Still, GNI per capita is the highest in the OECD.
Luxembourg’s recently established national productivity board, the Conseil National de la Productivité (CNP), would be well placed to assist the government in this process. Its institutional set-up being built on three existing national bodies – namely the Observatoire de la Competitivité, STATEC, and the Economic and Social Council – the CNP can tap into the expertise of several established institutions. This positions the productivity board as the ideal support to the government to run in-depth evaluations of various policy areas and to carry out early stakeholder consultations on proposed reforms (Renda and Dougherty, 2017).
Reviving productivity growth for firms below the frontier
The pool of firms below the productivity frontier, and especially those falling into the category of “laggards”, is highly heterogeneous. Laggard firms are on average smaller and younger than the rest, but they range from old firms with ageing technologies to young firms with a high potential for productivity growth (Berlingieri et al., 2019). Addressing the weak productivity performance of Luxembourg’s non-frontier firms thus requires a set of policies targeting each sub-category.
Reducing the share of zombie firms
Some laggard firms in Luxembourg likely correspond to the so-called “zombie firms”. Zombies are defined as firms aged 10 years at least that are unable to cover interest payments with profits for three consecutive years (Adalet McGowan et al. 2017). Since such firms capture scarce resources, their survival (or delayed restructuring) not only drags down average productivity growth, but also constrains the efficient reallocation of their resources (i.e. capital and labour) towards more productive firms. Based on firm-level balance sheet data, the share of capital sunk in Luxembourg’s zombie firms stood at a relatively high 12.5% in 2013, a figure that may have risen further in the light of the continued productivity decline of laggard firms in services (Figure 25, left scale). In turn, investment rates of non-zombie firms could increase by at least 1% if zombie congestion was reduced (Figure 25, right scale).
The appropriate design of insolvency regimes plays a crucial role to facilitate the exit of non-viable firms and the restructuring of viable firms that encounter temporary financial distress (Adalet McGowan and Andrews, 2016). There is substantial scope for raising the efficiency of Luxembourg’s insolvency framework (Figure 26). For example, failed entrepreneurs in Luxembourg must wait more than three years to start another business, compared to just one year in the United Kingdom. Moreover, courts are involved in almost all stages of both liquidation and restructuring processes, thus increasing the associated costs, while other countries only require court involvement in one stage (e.g. Korea, where courts are only involved in the launch of the insolvency procedure). Finally, new financing has no priority over unsecured creditors in the event of liquidation, although international best practice shows that this could lead to successful restructuring and a higher final recovery value for all creditors (Adalet McGowan and Andrews, 2018; EC 2014a and 2014b; Bergthaler et al., 2015).
Draft legislation to ease early business restructuring and modernise bankruptcy law (bill no. 6539) could remedy these concerns, but the bill has been pending since 2013. Swiftly implementing this legislation is key to help honest entrepreneurs get a second chance by no longer holding them personally responsible for the outstanding debt of the failed business after the closure of personal bankruptcy proceedings. Moreover, the legislation would enact a series of preventive measures that would ease early identification of businesses in financial difficulty, thereby allowing for more effective restructuring and resolution procedures.
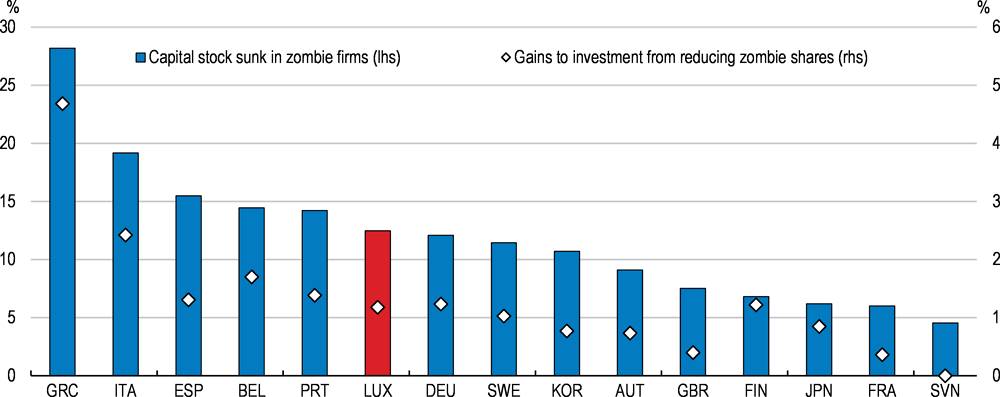
Note: Firms aged ≥10 years and with an interest coverage ratio<1 over three consecutive years. Capital stock refers to the share of capital sunk in zombie firms. Right-hand size axis shows counterfactual gains to investment of a typical non-zombie firm from reducing the share of zombies to the sample minimum level, here Slovenia.
Source: Adalet McGowan, Andrews and Millot (2017a), based on ORBIS data.
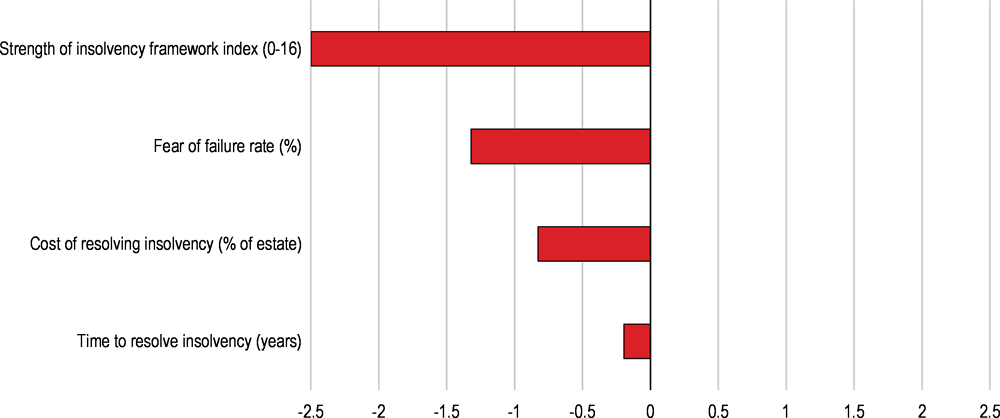
Note: Data bars to the right of zero show better performance than the OECD average and data bars to the left show worse performance than the OECD average.
Source: World Bank, Trade and Competitiveness data.
Lessening current skill shortages and anticipating future ones
Skill shortages directly and indirectly affect productivity outcomes by forcing firms to operate below their potential capacity and by diminishing the returns from investment in intangible capital, including digital technologies (Gal et al, 2019). This is because highly productive firms have access to the necessary human capital, while firms of average or low productivity find it more difficult to compete for available talent on the market. In turn, laggard firms more likely fail to adopt digital technologies in the first place or to make the best use of them.
Assessments of skill shortages undertaken by Luxembourg’s employment agency ADEM indicate a 30% y-o-y increase in the number of reported vacant positions in 2018. The majority of unfilled vacancies related to financial and administration professionals, partly because of the sector’s size, but critical shortages are also reported for digital experts (ADEM, 2018). A similar picture is conveyed by the share of firms facing difficulties in filling vacant ICT positions, where Luxembourg has led the skill shortage ranking since 2012 (Figure 27, Panel A).
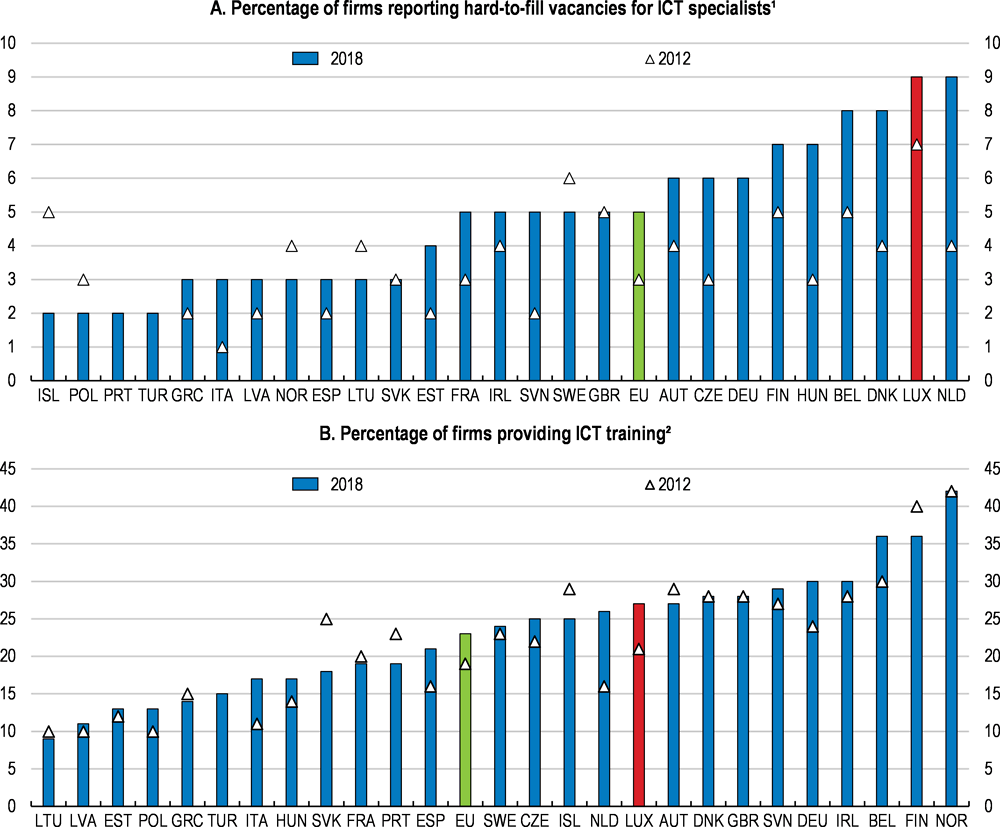
1. All enterprises with 10 or more employees, excluding the financial sector.
2. For Iceland, data is for 2017.
Source: Eurostat, Information Society database.
As an immediate solution to the shortage of qualified ICT workers, the government created more favourable immigration schemes for a range of relevant occupations by optimizing Blue Card requirements and lowering the associated wage thresholds. Moreover, matchmaking events organised by the government help to connect recruiters with professionals.
In tandem with attracting talent from abroad, policies should focus on maximizing the human capital of Luxembourg’s residents. In this regard, training plays a crucial role. Despite the pervasive role of digitalisation, only about a quarter of all firms provide training to their personnel to develop and upgrade their ICT skills (Figure 27, Panel B). “Digital Skills Bridge”, a pilot programme ranked by the Financial Times among the 100 digital champions in 2018, aims to fill this gap by providing firms undergoing digital disruption with technical and financial assistance to upskill their employees. In so doing, the initiative not only contributes to retraining the current workforce but also facilitates the transition of workers whose jobs may be at risk of automation to other sectors. Once the pilot phase reaches its end, ensuring enough funds and outreach efforts towards prospective participants will be vital for a rapid scaling-up, together with careful programme evaluation and subsequent redesign if needed.
Luxembourg’s innovation agency, Luxinnovation, also supports digital adoption in SMEs by linking firms with external experts. Digitalisation indeed tends to lag behind in smaller firms, precisely due to the lack of investment in complementary human skills (Figure 28; OECD, 2018c). Fit4Digital thus provides firms with tailored recommendations as to which digital tools promise the highest returns and accompanies them in their transformation journey, which often starts with simple changes (e.g. creating a website). More general advice on different areas of SME digitalisation (i.e. visibility, reputation, customer acquisition, business models & beyond) is provided by the programme GoDigital. Both initiatives go in the right direction, but achieving measurable impact will require further investment into advertising these programs among small businesses to increase participation rates, which still lie below 100 firms per year.
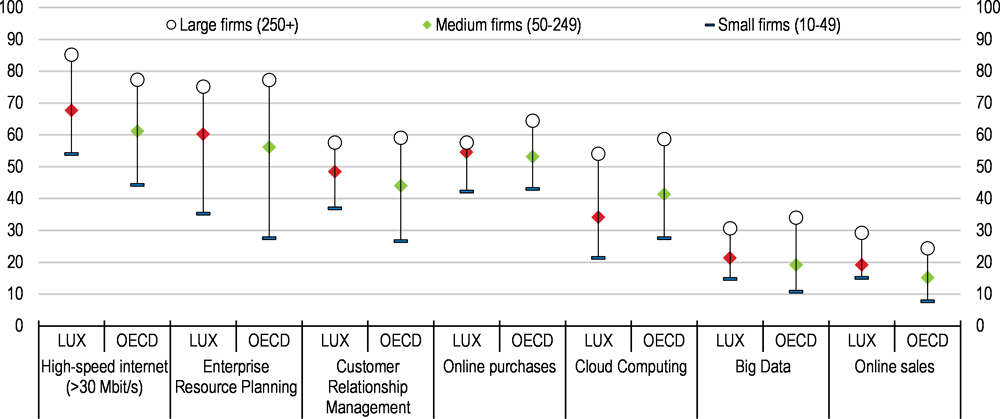
Note: Value for Enterprise Resource Planning and Customer Relationship Management refer to 2017.
Source: OECD, ICT Access and Usage by Businesses (database), http://oe.cd/hhind, accessed on 12 February 2019.
Adults, especially those with low or medium skills, often fail to value lifelong learning and should be made aware of the need to continuously upgrade their skills in the face of automation and structural changes (Windisch, 2015). In Luxembourg, 77% of firms offer some form of training but only 17% of the population engage in adult learning (Figure 29). Yet, employees who have been working with the same employer for at least six months are entitled to 80 days of training during their professional career. Matching future skill needs and protecting workers at risk will therefore require the use of targeted public awareness campaigns, preferably through various channels to maximise outreach. Countries pursuing similar strategies include Slovenia, whose Institute for Adult Education organises an annual lifelong-learning week since 1996 and Portugal, who launched in 2016/17 a public campaign titled “More Qualification, Better Jobs” (OECD, 2019b).
To better identify future skill needs, regular skill foresight exercises would also be appropriate. Luxembourg already performs some studies assessing skill needs (e.g. through its multi-sectoral business federation, FEDIL), but most of them focus on current shortages or specific sectors of interest. Moreover, the extent to which they inform skill-related policies is uncertain (Skills Panorama, 2017). Building a structured process that feeds the outcomes of regular foresight exercises, including those performed at the EU level (i.e. CEDEFOP; see OECD, 2016b, OECD, 2017a) into training offers of all bodies delivering vocational training is thus critical to help alleviating future skill shortages. ADEM and the UEL (Union des Entreprises Luxembourgeoises) recently entered a cooperation that foresees the regular publishing of a list of job profiles in high need. While this initiative goes into the right direction, its effectiveness remains yet to be gauged.
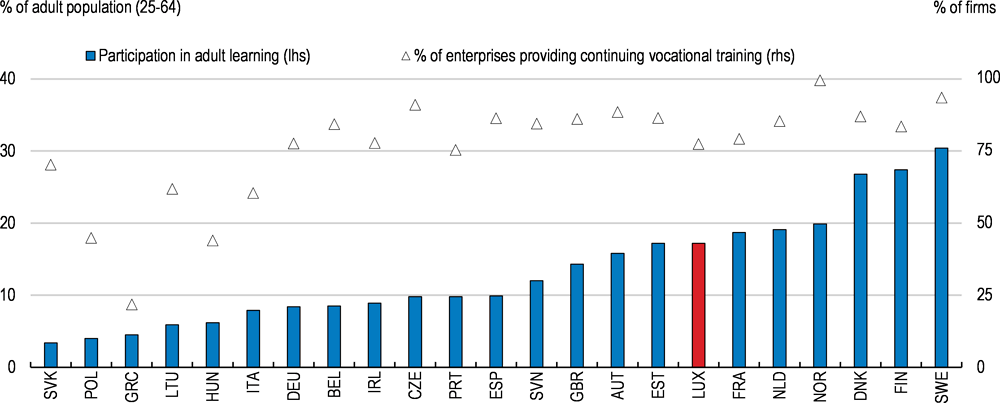
Note: Adult learning covers formal and non-formal learning activities, both general and vocational, undertaken by adults after leaving initial education and training.
Source: Eurostat, and OECD (2019).
Raising the productivity contribution of professional services
Professional services represent a growing share of value added in the Luxembourg services sector, but average productivity growth has been negative for the past two decades (Figure 21). Moreover, since professional services are often intermediate inputs to other sectors, their low productivity performance can curb efficiency in downstream production (Arnold et al., 2011; Bourlès et al. 2013; van der Marel, 2016).
Lifting anti-competitive product market regulations would contribute to stronger market selection and post-entry growth of efficient firms in the professional services sector. Regulation in Luxembourg tends to be more restrictive than the OECD average (Figure 30), especially for civil engineers, which are often unregulated in other OECD countries. This is despite recent reforms facilitating the recognition of professional qualifications and eliminating fixed prices in public contracts for architects and engineers (Ministry of the Economy, 2018). Eliminating restrictions on advertising and marketing for architects and engineers is thus strongly advised.
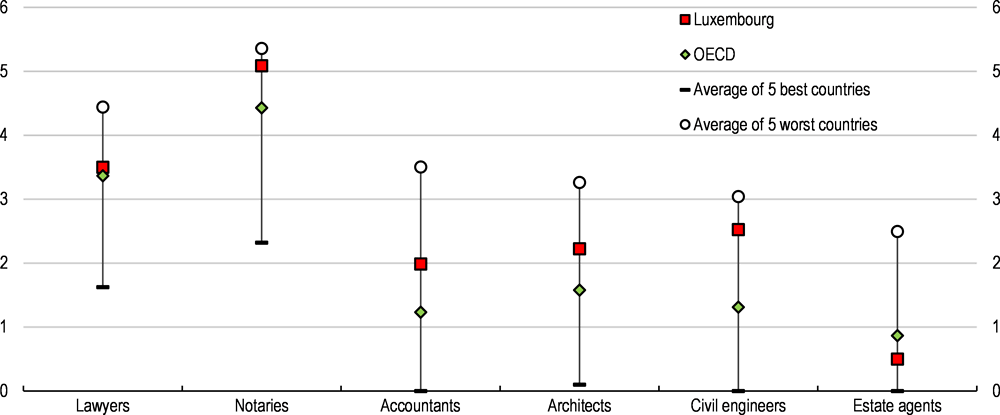
Source: OECD Product Market Regulation Indicators of Professional Services, 2019.
Stimulating the innovation engine to push the frontier
As countries approach the technological frontier, sustaining productivity growth increasingly relies on their innovative capacity (OECD, 2015). In Luxembourg, innovative activity appears to be high at first sight, as one third of SMEs reported introducing new or significantly improved products, services or organisational methods in 2018 (EC, 2018b). This, however, contrasts Luxembourg’s weak multifactor productivity growth (MFP), in turn pointing to firms’ inability to translate these innovations into productivity gains (Figure 31). MFP is a residual measure capturing changes to output that cannot be explained by changes in labour and capital, and is therefore often used as a proxy for innovation. In services, even the productivity performance of frontier firms has been disappointing. Hence, further efforts are needed to stimulate experimentation with cutting-edge technologies and to foster investment in R&D.
Source: OECD (2019), Multifactor productivity (indicator).
Embracing new, disruptive technologies
Artificial intelligence (AI) is set to transform the existing innovation landscape and holds the promise of reviving productivity growth. AI use has already spread to most industrial activities, from optimising multi-machine systems to enhancing industrial research (OECD, 2018d), although its greatest commercial application is expected to lie in supply chains, logistics and process optimisation (McKinsey Global Institute, 2018).
As requested by the European Commission in its Coordinated Action Plan on AI, Luxembourg will shortly launch its national AI strategy (EC, 2018c). Among other things, skills related to AI development and use, as well as public sector use of AI will figure prominently in this plan. Indeed, making Luxembourg’s public administration a frontrunner of AI use could entail a double dividend through positive demonstration effects for the private sector and potentially large benefits for the public sector itself. Selected public data is already available online for training purposes as stipulated by the European Directive on the re-use of public sector information. In addition, the government could also act as a catalyst to arrange partnerships between firms with valuable but confidential data and AI start-ups with the competence to draw value from it (OECD, 2018d).
As with other disruptive technologies enabling automation, the uptake of AI will likely alter the nature of some existing jobs, and might even put them at risk. While it is too early to fully gauge the labour market implications of AI use, low-skilled jobs tend to be especially vulnerable to the wider use of AI applications (Nedelkoska and Quintini, 2018). Preparing for the labour market changes brought about by AI therefore also requires the provision of retraining offers and social protection for workers whose jobs are at risk. To some extent, the Digital Skills Bridge project, once scaled up, remedies these concerns, but a more holistic approach to protecting workers at risk could be anchored in the national AI strategy.
In a similar vein, Blockchain technologies have recently sparked lively debates. Blockchain applications are widely known from financial markets (e.g. investment fund distribution, remittances, inter-bank transfers and securities trading) but their scope of usage is much broader. In collaboration with private actors, Luxembourg’s authorities established Infrachain, a non-profit organisation and blockchain community with the aim to create a European community of certified host operators to host private chain instances with third party distributed trust and to support the diffusion of blockchain technologies in Europe. In so doing, it bridges the gap between this new technology and the regulators, and positions Luxembourg as a competence centre in Europe. As for AI, however, public sector use would help raise awareness of its potential outside the financial sector and address trust issues related to the data placed on the blockchain, although legal certainty when making financial transactions by way of distributed ledger technology has recently been increased (bill of law 7363).
More generally, Luxembourg has made considerable efforts to provide an appropriate infrastructure for existing and new digital technologies, through the foreseen rollout of 5G, and more importantly, by hosting EuroHPC, the European strategic project in High Performance Computing (HPC). This joint undertaking between 13 EU countries will oversee the pooling of resources within Europe to develop supercomputers for processing big data (Luxinnovation, 2018). However, demonstrating the technical and commercial implications of HPC would be helped by greater awareness of industrial use cases and cost-benefit analyses. Moreover, since SMEs often fail to recognize the potential of new digital technologies, the government should also consider developing a one-stop source of HPC services and advice, while providing low-cost or free experimental HPC use for SMEs for a limited period of time (OECD, 2018d).
Incentivising more firms to invest in R&D
Investment in R&D is a widely acknowledged key factor driving innovation (Bloom and Van Reenen, 2002; Hall et al., 2010; Westmore, 2013), and in turn, productivity growth. Governments across the OECD support R&D to compensate for market failures related to firms’ difficulties in finding external finance, especially in the case of small firms, and in fully appropriating R&D investment returns (OECD, 2015). Support can be provided directly (i.e. through grants) or indirectly (i.e. through tax incentives). While direct support can be more easily targeted at high-potential projects or at smaller, younger and first-time R&D-active firms, take-up can be deterred by the high fixed cost of applying to grants (Veugelers, 2016). Tax incentives, on the other hand, are generally easier to operate than grants, but have less scope to identify projects that would not have been carried out in the absence of tax relief (Appelt et al. 2016).
At 1.3%, Luxembourg’s share of GDP allocated to R&D activities stands far below the OECD median and its own national 2020 target of 2.3%-2.6% of GDP (Ministry of the Economy, 2018). In particular, business R&D strongly decreased over the past decade, (Figure 32). While the underlying drivers of this phenomenon are still unexplored, there are reasons to believe that the behaviour of few multinational companies could potentially have had large bearings on official business R&D statistics. In addition, although to a lesser extent, the observed decline could also be attributed to composition effects, since traditionally low R&D intensive services sectors account for a growing share of the economy.
Implementing effective R&D policies has become a priority for Luxembourg, which tripled expenditures for government and higher education R&D over the past decade (Figure 32; NRP, 2018). Luxembourg also recently expanded the list of available grant schemes and broadened the scope for action of Luxembourg’s innovation agency, Luxinnovation, which now generates a third of business R&D expenditures through its programs, and thus considerably more than its European equivalents (Taftie, 2018). More evidence on the use and impact of individual support measures would be helpful, however, in assessing their value.
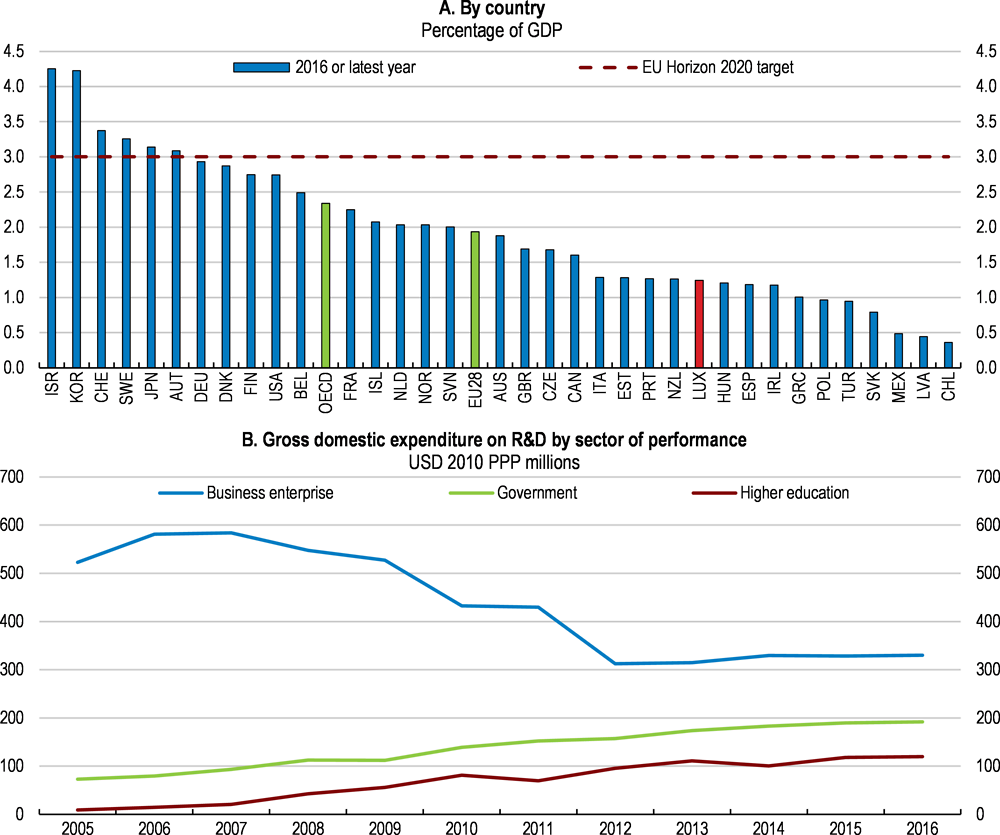
Source: Eurostat and OECD Research and Development Statistics.
Luxembourg’s tax-related R&D incentives are confined to income-based schemes, which provide a 80% exemption on qualifying income associated with R&D outputs (e.g. patent or other forms of knowledge-capital). In place since 2008, this incentive has largely failed to spur business expenditure on R&D (Figure 32), as the R&D activity underlying the exempted income was not required to have been performed in Luxembourg. The scheme was amended in April 2018 to only provide relief for entities bearing the risk of the developments that are located in Luxembourg (Draft Law No. 7163). While this amendment is welcome, income-based incentives can disproportionately benefit large firms and innovations susceptible to protection by patents (Appelt et al., 2016). Therefore, complementing the use of income-based schemes with expenditure-based tax incentives through enhanced allowances or tax credits should be considered, as in a large majority of OECD economies (OECD, 2017f). This would provide incentives to a larger proportion of firms, and especially SMEs, to increase R&D spending, and could help come closer to Luxembourg’s 2020 target. However, expenditure-based tax incentives should be carefully designed to take into account that young innovative firms are often in a loss position in the early years of an R&D project, by including the use of carry-forward provisions, cash refunds or reductions in social security and payroll taxes (Appelt et al. 2016).
Avenues for greener growth
There is scope to further reduce CO2 emissions, especially from transport
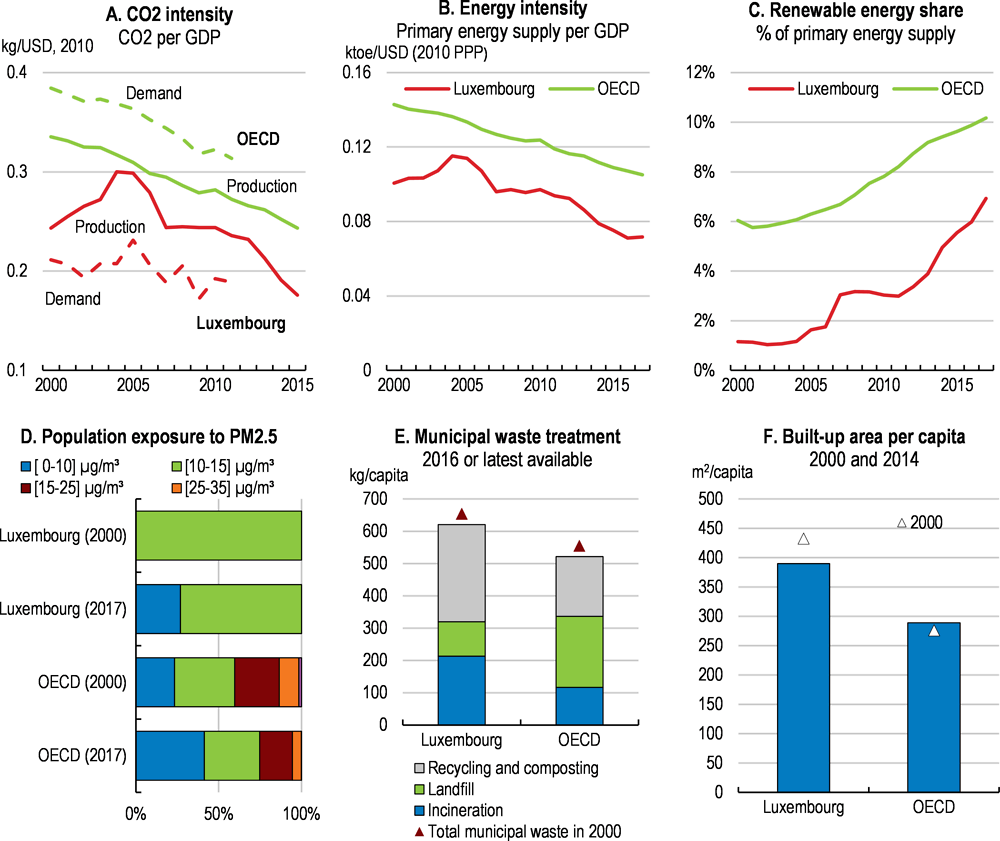
Luxembourg has made progress in decoupling CO2 emissions from economic growth in recent years, as energy intensity of production has fallen and the share of renewable energy has increased (Figure 33, panels A-C). CO2 emissions have fallen by around 20% since 2010. Nonetheless, per capita emissions are among the highest in the OECD. Road transport accounts for more than one half and also causes air pollution. More than half of the population is exposed to small particle emissions above the limit recommended by the World Health Organisation (10 micrograms per m3), a larger share than the OECD average (Figure 33, panel D). Outdoor air pollution raises premature mortality substantially (Roy and Braathen, 2017). It also affects children the most (World Health Organisation, 2018). One study suggests that air pollution may have a negative impact on young children’s education outcomes (Heissel, Persico and Simon, 2019).
Urban sprawl has contributed to large built-up surfaces, fostering car dependency and traffic congestion (Figure 33, panel F). Policies to limit urban sprawl, discussed in chapter 1, reduce pollution, energy consumption and CO2 emissions markedly and lastingly (OECD, 2018e). They would also lower the cost of deploying public infrastructure substantially, including public transport, and improve its quality, for example, by making it easier to improve frequency of service. The 2017 Economic Survey also called for improving the quality of public transport services in cooperation with neighbouring regions in Belgium, France and Germany. Integrated multimodal services are key. This needs to be complemented with investment to facilitate walking and cycling, as well as electromobility. Low-emission zones, which restrict access by polluting vehicles to certain urban areas, are also seen as cost effective (ITF, 2018a). Like car use pricing, they create incentives for using low-emission transport options.
As discussed above, there is scope to curb CO2 emissions and air pollution by increasing taxes on transport fuel and on cars. Car use pricing which takes into account congestion and pollution would also boost efficiency and environmental performance (ITF, 2018a). Indeed, the economic and environmental costs of car use far exceed what car drivers pay in urban areas (OECD, 2018e). Luxembourg plans to introduce free public transport in 2020, which can encourage some switching of mobility to public transport. As planned, public financing should be provided to ensure that quality of public transport services does not deteriorate and the new policy should be reviewed after a few years of implementation.
Source: OECD Green Growth Indicators.
Luxembourg should take the lead in rolling out electric charging infrastructure for vehicles with the aim of fully decarbonising transport and reducing local pollution. It is welcome that Luxembourg is rolling out the Chargy infrastructure, with the ambition to become the most densified network of electric charging infrastructure in Europe. It could follow France, which has committed to ending the sale of cars with petrol and diesel combustion engines by 2040. A promising avenue for reducing congestion, pollution and CO2 emissions sharply, while improving connectivity and accessibility, especially for low income households and at low cost to the public purse, is to explore options to move away from individual car use, towards digital-based ride sharing, as recently modelled for Dublin, for example (ITF, 2018b).
The volume of household waste remains large, although much is recycled (Figure 33, panel E). Policies to avoid waste lower natural resource and energy consumption in products consumed domestically. This would reduce greenhouse gas emissions, including in sectors which are relatively difficult to decarbonise. An option to avoid waste is to reinforce policies to extend producers’ responsibility over the life cycle of their products (OECD, 2016b). This can for example include product take-back requirements on retailers, refundable deposits, or disposal fees levied at purchase based on the estimated costs of treatment. Luxembourg could consider making more use of such instruments. Charging taxes for landfilling of municipal waste could encourage more recycling.
Harnessing finance for the transition to a low-carbon economy
Being a major financial center, Luxembourg can play a concomitantly large role in financing the global transition to a low-carbon economy. The first-ever green bond was issued by the EIB in 2007 on the Luxembourg Stock Exchange, LuxSE. In 2016, LuxSE launched the Luxembourg Green Exchange, the first platform dedicated to green and sustainable securities. Between them, these two exchanges have become the world leader of green bond listing (Figure 34). Further transparency is given by Luxembourg’s labelling agency LuxFLAG, which offers a series of labels intended to clarify the content and impact of various asset classes. These include labels on climate finance, on green bonds and on Environmental, Social and Governance (ESG) criteria. Furthermore, in 2018 Luxembourg created a legal framework for the renewable energy covered bond.
It is not clear whether this new asset class has contributed to additional investment in renewable energy and energy-saving projects or whether it has just provided labeling to projects that would have been realized anyway. Indeed, such labeling is beneficial because at issuance green bonds have on average been priced at a premium relative to conventional bonds (Ehlers and Packer, 2017). There are currently several competing frameworks setting standards for green bond labelling. As a step towards more transparent and demanding requirements, the EU is currently developing an EU Green Bond Standard. In this context, The Luxembourg Green Exchange has been a member of the High-Level Expert Group on Sustainable Finance created by the European Commission.
A more comprehensive approach to green finance is required for a successful financing of the transition to low-carbon economy. To this end, the Luxembourg government has published a Sustainable Finance Roadmap, covering inter alia governance arrangements, promoting innovation, developing expertise and measuring progress. Furthermore, a project assessing the current portfolio exposure to climate risks is underway in the insurance sector (through the sector’s association, ACA). The Task Force on Climate-related Financial Disclosures (TCFD) has recommended more ambitious and concrete disclosure practices (TCFD, 2017). For instance, banks would need to disclose the amount and percentage of carbon-related assets relative to total assets, while asset managers and asset owners would disclose the weighted average carbon intensity for each product, fund or investment strategy. Governments and financial regulators from other countries have already expressed support for this initiative. Current work on a EU regulation on disclosure of sustainability risks may help strengthen the disclosure of climate-related risks, in line with TCFD recommendations.
Major risks do arise from exposures to high-carbon assets which could have to be written off before the end of their economically useful life because they are inconsistent with reaching climate objectives. These assets could amount to one trillion US dollars worldwide for the energy supply and industry sectors alone, and could treble if decisive climate mitigation action is delayed to 2025 (OECD, 2017g). Furthermore, financial institutions should also start to stress test their assets under an adverse scenario of bursting a ‘carbon bubble’ (Schoenmaker and van Tilburg, 2016).
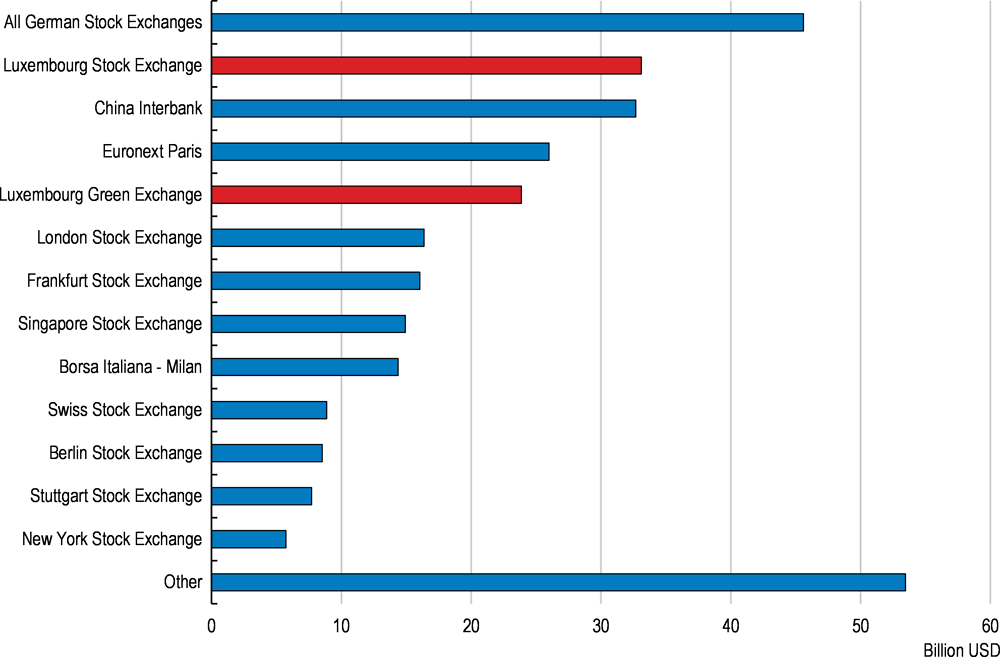
Note: The figure includes only green bonds listed on exchanges and excludes over-the-counter bonds and the category “not available/not applicable”.
Source: Climate Bond Initiative data for Global Green Finance Index 2.
References
Adalet McGowan, M. and D. Andrews (2016), “Insolvency Regimes and Productivity Growth: A Framework for Analysis”, OECD Economics Department Working Papers, No. 1309.
Adalet McGowan, M. and D. Andrews (2018), "Design of insolvency regimes across countries", OECD Economics Department Working Papers, No. 1504, OECD Publishing, Paris, https://doi.org/10.1787/d44dc56f-en.
ADEM (2018), Chiffres-Clés Décembre 2018. Link
Andrews, D., M. Adalet McGowan and V. Millot (2017), "Confronting the zombies: Policies for productivity revival", OECD Economic Policy Papers, No. 21, OECD Publishing, Paris, https://doi.org/10.1787/f14fd801-en.
Appelt, S. et al. (2016), “R&D Tax Incentives: Evidence on design, incidence and impacts”, OECD Science, Technology and Industry Policy Papers, No. 32, OECD Publishing, Paris. https://doi.org/10.1787/5jlr8fldqk7j-en
Arnold, J., B. Javorcik and A. Mattoo (2011) “The Productivity Effects of Services Liberalization: Evidence from the Czech Republic”, Journal of International Economics, Vol. 85, No. 1, pages 136-146.
Banque Centrale du Luxembourg (2018), Revue de Stabilité Financière 2018.
Berlingieri, G., et al. (2017), "The Multiprod project: A comprehensive overview", OECD Science, Technology and Industry Working Papers, No. 2017/04, OECD Publishing, Paris,https://doi.org/10.1787/2069b6a3-en.
Berlingieri, G., S. Calligaris, C. Criscuolo and R. Verlhac (2019), “Last but not least: laggard firms, technology diffusion and its structural and policy determinants”, forthcoming.
Bergthaler, W., K. Kang, Y. Liu and D. Monaghan (2015), “Tackling Small and Medium-sized Enterprise Problem Loans in Europe”, IMF Staff Discussion Note, No. 4.
Best, M. C., & Kleven, H. J. (2017). Housing market responses to transaction taxes: Evidence from notches and stimulus in the UK. The Review of Economic Studies, 85(1), 157-193.
Bloom, N. and J. Van Reenen (2002), “Patents, Real Options and Firm Performance”, Economic Journal 111, C97-C116.
Bourlès, R., G. Cette, J. Lopez, J. Mairesse and N. Nicoletti (2013) “Do Product Market Regulations in Upstream Sectors Curb Productivity Growth? Panel Data Evidence for OECD Countries”, Te Review of Economics and Statistics, Vol. 95, No. 5, pages 1750-1768
Cerutti, E., S. Claessens and L. Laeven (2017), “The use and effectiveness of macroprudential policies: New evidence”, Journal of Financial Stability, Vol. 28, pp. 203-224
Devereux, M. and Vella, J., 2017. Implications of digitalisation for international corporate tax reform. In: Digital Revolutions in Public Finance. International Monetary Fund, Washington DC, pp. 91-112.
Digital Luxembourg (2018), Progress Report. Spring 2018. Link.
European Central Bank (2013), Financial Stability Review, November 2013. European Commission (2018a), The 2018 Ageing Report, European Commission, Brussels, 2018.
European Commission (2018b), European Innovation Scoreboard. Link
European Commission (2018c), Annex to the Communication from the Commission to the European Parliament, the European Council, the Council, the European Economic and Social Committee and the Committee of the Regions – Coordinates Plan on Artificial Intelligence, Brussels, 7.12.2018 COM(2018) 795 final.
European Commission (2017), Special Eurobarometer 470.
European Environment Agency (2018), Vehicle Emissions and Impacts of Taxes and Incentives in the Evolution of Past Emissions, EIONET ReportECB (2013), Financial stability review, November 2013
Ehlers, T. and F. Packer (2017), “Green bond finance and certification”, BIS Quarterly Review, Bank for International Settlements
ESMA, 2019. Advice Initial Coin Offerings and Crypto-Assets, 9 January 2019 | ESMA50-157-1391
ESMA, 2018. Securities and Markets Stakeholder Group Advice to ESMA, Own Initiative Report on Initial Coin Offerings and Crypto-Assets, ESMA22-106-1338
ESRB (2016), Vulnerabilities in the EU residential real estate sector.
Gal, P., G. Nicoletti, T. Renault, S. Sorbe and C. Timiliotis (2019), “Digitalisation and productivity: In search of the holy grail – Firm-level empirical evidence from EU countries”, OECD Economics Department Working Papers, No. 1533, OECD Publishing, Paris.
Gandal, N., Hamrick, J. T., Moore, T., & Oberman, T., 2018. Price manipulation in the Bitcoin ecosystem. Journal of Monetary Economics, 95, 86-96.
Gerlagh, R., van den Bijgaart, I., Nijland H. and Michielsen T., 2016, Fiscal Policy and CO2 Emissions of New Passenger Cars in the EU, Environmental and Resource Economics, 1-32
Giordana, G., & Ziegelmeyer, M. (2017). Household debt burden and financial vulnerability in Luxembourg. IFC Bulletins chapters, 46.
Girshina, Anastasia, Thomas Y. Mathä, and Michael Ziegelmeyer (2017). The Luxembourg Household Finance Consumption Survey: Results from the 2nd wave. No. 106. Central Bank of Luxembourg, 2017.
Gordon, R. (2012), Is U.S. Economic Growth Over? Faltering Innovation Confronts the Six Headwinds, National Bureau of Economic Research, Cambridge, MA, https://doi.org/10.3386/w18315.
Griffin, John M. and Shams, Amin, Is Bitcoin Really Un-Tethered? (June 13, 2018). Available at SSRN: https://ssrn.com/abstract=3195066 or .
Hall, B., J. Mairesse and P. Mohnen (2010), "Measuring the Returns to R&D", in Elsevier Handbook of the Economics of Innovation, B.H. Hall and N. Rosenberg (eds.), Burlington Academic Press.
Heissel, J., C. Persico and D. Simon (2019), “Does Pollution Drive Achievement? The Effect of Traffic Pollution on Academic Performance”, No. 25489, National Bureau of Economic Research, https://www.nber.org/papers/w25489.pdf (accessed on 8 February 2019).
ILNAS, 2018. Blockchain and distributed ledgers technology, economic impact and technical standardization. A White Paper.
IMF (2019a), Luxembourg. Selected Issues. IMF Country Report No. 19/131, International Monetary Fund, Washington, D.C.
IMF (2019b), Luxembourg. 2019 Article IV Consultation – Press Release; Staff report; and Statement by the Executive Director for Luxembourg. IMF Country Report No. 19/130, International Monetary Fund, Washington, D.C.
IMF (2014). Staff Guidance Note on Macroprudential Policy - Detailed Guidance on Instruments.
IMF (2011). United Kingdom : Vulnerabilities of Household and Corporate Balance Sheets and Risks for the Financial Sector Technical Note.
ITF (2018a), “Policy Priorities for Decarbonizing Urban Public Transport”, International Transport Forum Policy Papers, No. 59, OECD Publishing, Paris, https://dx.doi.org/10.1787/871f6812-en.
ITF (2018b), “Shared Mobility Simulations for Dublin”, International Transport Forum Policy Papers, No. 58, OECD Publishing, Paris, https://dx.doi.org/10.1787/e7b26d59-en.
Johansson, Å. et al. (2013), “Long-Term Growth Scenarios”, OECD Economics Department Working Papers, No. 1000, OECD Publishing, Paris. https://doi.org/10.1787/5k4ddxpr2fmr-en
Kalemli-Özcan, S., B. Sørensen, C. Villegas-Sanchez, V. Volosovych, and S. Yeşiltaş (2015), “How to construct nationally Representative Firm Level Data from the ORBIS Global Database”, Tinbergen Institute Discussion Paper, TI 2015-110/IV. Link.
Kuttner, Kenneth N. and Ilhyock Shim, 2013, “Can Non-interest Rate Policies Stabilise Housing Markets? Evidence from a Panel of 57 Economies,” BIS Working Papers, No. 433 (Basel: Bank for International Settlements).
Le Moign, C., 2018. ICO françaises : un nouveau mode de financement ? AMF report
Lim, C. H., Costa, A., Columba, F., Kongsamut, P., Otani, A., Saiyid, M., Wezel, T. and Wu, X. (2011). Macroprudential policy: what instruments and how to use them? Lessons from country experiences. IMF Working Paper, WP/11/238.
Luxinnovation (2018), Luxembourg to host European HPC headquarter, Press Release. Link.
Ministry of the Economy (2017), Research and Innovation Smart Specialisation Strategy (RIS3), Grand Duchy of Luxembourg.
Ministry of the Economy (2018), National Plan for Smart, Sustainable and Inclusive Growth, Grand Duchy of Luxembourg.
Nedelkoska, L. and G. Quintini (2018), “Automation, skills use and training”, OECD Social, Employment and Migration Working Papers, No. 202, OECD Publishing, Paris. https://doi.org/10.1787/2e2f4eea-en
OECD (2019a). Initial Coin Offerings (ICOs) for SME Financing.
OECD (2019b), Getting Skills Right: Future-Ready Adult Learning Systems, Getting Skills Right, OECD Publishing, Paris, https://doi.org/10.1787/9789264311756-en.
OECD (2018a), Harmful Tax Practices – 2017 Peer Review Reports on the Exchange of Information on Tax Rulings: Inclusive Framework on BEPS: Action 5, OECD/G20 Base Erosion and Profit Shifting Project, OECD Publishing, Paris. https://doi.org/10.1787/9789264309586-en
OECD (2018b), Taxing Energy Use 2018: Companion to the Taxing Energy Use Database, OECD Publishing, Paris, https://dx.doi.org/10.1787/9789264289635-en.
OECD (2018c), Strengthening SMEs and Entrepreneurship for Productivity and Inclusive Growth, Key Issues Paper, SME Ministerial Conference, Mexico City.
OECD (2018d), OECD Science, Technology and Innovation Outlook 2018: Adapting to Technological and Societal Disruption, OECD Publishing, Paris, https://doi.org/10.1787/sti_in_outlook-2018-en
OECD (2018e), Rethinking Urban Sprawl: Moving Towards Sustainable Cities, OECD Publishing, Paris, https://doi.org/10.1787/9789264189881-en.
OECD (2018f), 2017 Enforcement of the Anti-Bribery Convention, OECD Working Group on Bribery, November.
OECD (2017a), OECD Economic Surveys: Luxembourg 2017, OECD Publishing, Paris, https://doi.org/10.1787/eco_surveys-lux-2017-en.
OECD (2017b), Pensions at a Glance 2017: OECD and G20 Indicators, OECD Publishing, Paris,https://doi.org/10.1787/pension_glance-2017-en.
OECD (2017c), Preventing Ageing Unequally, OECD Publishing, Paris, https://doi.org/10.1787/9789264279087-en.
OECD (2017d), OECD Science, Technology and Industry Scoreboard 2017: The digital transformation, OECD Publishing, Paris, https://doi.org/10.1787/9789264268821-en.
OECD (2017e), OECD Digital Economy Outlook 2017, OECD Publishing, Paris,https://doi.org/10.1787/9789264276284-en.
OECD (2017f) OECD Review of national R&D tax incentives and estimates of R&D tax subsidy rates, 2017. TAX4INNO Project 674888
OECD (2017g), Investing in Climate, Investing in Growth, OECD Publishing, Paris,https://doi.org/10.1787/9789264273528-en.
OECD (2016a), OECD Reviews of Innovation Policy: Luxembourg 2016, OECD Reviews of Innovation Policy, OECD Publishing, Paris, https://doi.org/10.1787/9789264232297-en.
OECD (2016b), Getting Skills Right: Assessing and Anticipating Changing Skill Needs, Getting Skills Right, OECD Publishing, Paris, https://doi.org/10.1787/9789264252073-en.
OECD (2016c), Extended Producer Responsibility: Updated Guidance for Efficient Waste Management, OECD Publishing, Paris, https://dx.doi.org/10.1787/9789264256385-en.
OECD (2015), The Future of Productivity, OECD Publishing, Paris, https://doi.org/10.1787/9789264248533-en.
Office of the New York Attorney General, 2018. Virtual Markets Integrity Initiative Report.
Renda, A. and S. Dougherty (2017), "Pro-Productivity Institutions: Learning from National Experience",OECD Productivity Working Papers, No. 7, OECD Publishing, Paris, https://doi.org/10.1787/d1615666-en.
Roy, R. and N. Braathen (2017), “The Rising Cost of Ambient Air Pollution thus far in the 21st Century: Results from the BRIICS and the OECD Countries”, OECD Environment Working Papers, No. 124, OECD Publishing, Paris, https://dx. org/10doi..1787/d1b2b844-en.
Skills Panorama (2017), Skills anticipation in Luxembourg. Analytical highlights series. Available at http://skillspanorama.cedefop.europa.eu/en/analytical_highlights/skills-anticipation-luxembourg
STATEC (2018a), Note de conjecture No. 2018-01, Institute national de la statistique et des études économiques, Luxembourg, 2018
STATEC (2018b), Note de conjecture No. 2018-02, Institute national de la statistique et des études économiques, Luxembourg, 2018.
Schoenmaker, Dirk and van Tilburg, Rens, 2016. What Role for Financial Supervisors in Addressing Environmental Risks? Comparative Economic Studies, 58, 317-334.
Taftie (2018), “Towards a comparative overview of innovation programmes in Europe. Second benchmark report 2015-2016 of Taftie’s Structural Network on Benchmarking”. Link
TCFD, 2017. Implementing the Recommendations of the Task Force on Climate-related Financial Disclosures.
TIR Consulting Group LLC (2016), The 3rd Industrial Revolution Strategy Group. Link.
Transparency International (2018), Exporting Corruption. Progress report 2018: Assessing enforcement of the OECD Anti-Bribery Convention.
Veugelers, R. (2016), “Getting the most from public R&D spending in times of austerity: some insights from SIMPATIC analysis”, Bruegel Working Paper No. 2016/01.
van der Marel, E., J. Kren and M. Iootty (2016) "Services in the European Union: What Kinds of Regulatory Policies Enhance Productivity?", World Bank Policy Research Paper Series, No. 7919: http://bit.ly/2dtb45p.
Westmore, B. (2013), “R&D, Patenting and Productivity: The Role of Public Policy”, OECD Economics Department Working Paper No. 1046, OECD, Paris.
Windisch, H. (2015), “Adults with low literacy and numeracy skills: A literature review on policy intervention”, OECD Education Working Papers, No. 123, OECD Publishing, Paris, https://doi.org/10.1787/5jrxnjdd3r5k-en.
World Health Organization (2018), Air pollution and child health: Prescribing clean air. Summary, Geneva: World Health Organization.
Wright, T. and G. Zucman (2018), “The Exorbitant Tax Privilege”, NBER Working Paper 24983, National Bureau of Economic Research.