copy the linklink copied! 4. Use of skills in everyday life and at work
This chapter examines the use of numeracy skills at work and in everyday life, and the relationship between the intensity of individuals skills use and their employment status, wages, job satisfaction and economy-wide productivity. It also explores the factors associated with greater or lesser use of these skills in the workplace, including proficiency, the characteristics of workers – such as gender, age and educational attainment – and features of their jobs. It ends by considering how the sorts of tasks used at work, including social interactions, might affect which jobs are at risk of automation.
A note regarding Israel
The statistical data for Israel are supplied by and under the responsibility of the relevant Israeli authorities. The use of such data by the OECD is without prejudice to the status of the Golan Heights, East Jerusalem and Israeli settlements in the West Bank under the terms of international law.
In addition to assessing proficiency in literacy, numeracy and problem solving in technology-rich environments, the Survey of Adult Skills (PIAAC) collects information on the frequency with which adults engage in practices involving literacy, numeracy and problem solving such as reading different types of text, undertaking calculations and solving problems both in everyday life and at work. The survey collects information on engagement in these practices for a number of reasons. First, engaging with written materials and the mathematical demands of adult life is an important dimension of what it is to be literate and numerate in terms of the definitions of these constructs in the study (see definitions in Chapter 2). Second, practice is understood as a means by which individuals develop and maintain their skills during the lifetimes. Third, individuals’ productivity and wages in the workplace are determined by both their skills and the intensity with which they engage in practices that use these skills.
This chapter focuses particularly on numeracy skills, and compares their use at work and in everyday life. It starts by estimating an index of engagement in numeracy practices, based on Jonas (2018[1]). Using an item response theory (IRT) model, it considers the frequency with which individuals perform eight different numeracy practices in their jobs or in everyday life. This index can better account for the different levels of complexity of numeracy practices as well as the fact that a small number of sophisticated users will tend to use advanced numeracy practices frequently, while there are many more unsophisticated users who use such practices rarely.
Information about other tasks performed on the job is used to measure the extent of workers’ engagement in social interactions and problem-solving tasks, and the way work is organised and managed by the employers. It is also exploited to assess the risk that each job could be automated in Round 3 countries, extending previous analysis that the OECD conducted on Round 1 and 2 countries and economies.
The main findings discussed in this chapter are:
Among high-income countries, proficiency in numeracy and engagement in numeracy practices are positively but weakly correlated at the country level, i.e. higher average numeracy scores tend to correspond to higher average values for the index of numeracy use. The correlation strengthens when Ecuador, Mexico and Peru are also considered.
Countries ranking low in numeracy skills use in everyday life (Italy, Kazakhstan, Peru, Turkey) also rank low for their use at work, while those ranking high for everyday use (the Czech Republic, Finland, New Zealand and the United States) also rank high for use at work. This suggests that the use of skills in everyday life and at work are highly, albeit imperfectly, correlated at the country level.
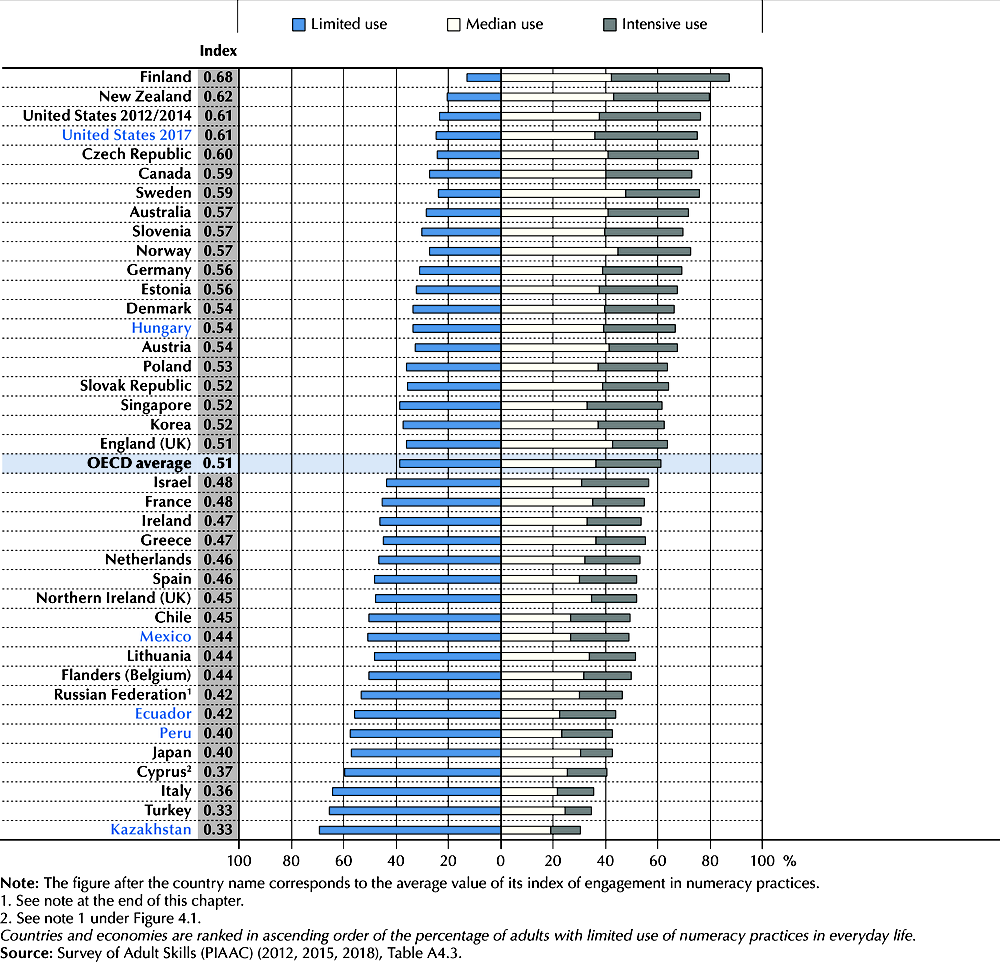
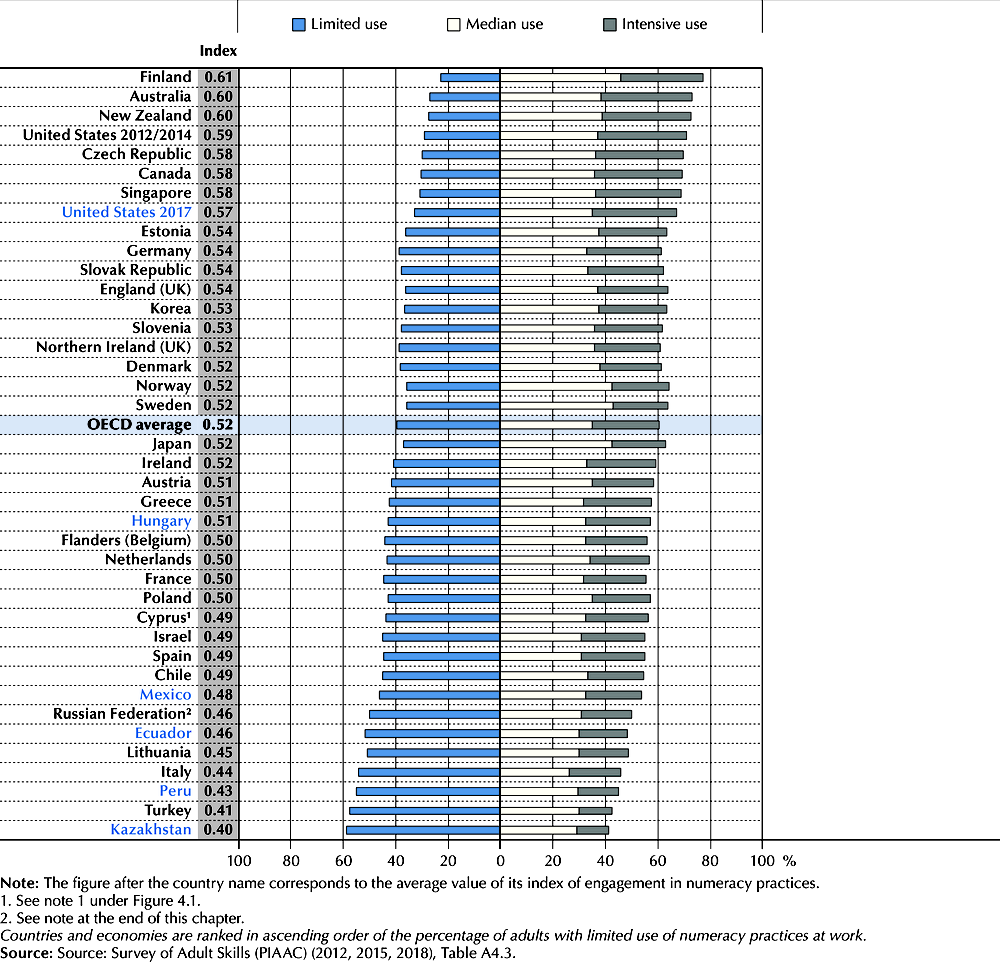
To make it easier to interpret the index of engagement in numeracy practices, individuals were grouped into three categories: limited, median and intensive users. Finland stands out as the country with the lowest proportion of limited users in numeracy, both in everyday life (13%) and at work (23%), closely followed by New Zealand (21% in everyday life and 27% at work) and the United States (25% and 33%). Conversely, the countries with the largest shares of limited users are Kazakhstan (70% in everyday life and 59% at work) and Turkey (66% and 57%).
Ecuador, Kazakhstan, Mexico and Peru also rank at the lower end of the distribution of engagement in numeracy practices, as does Chile. In contrast, Hungary displays lower intensity in engagement in numeracy practices at work than the average OECD country but above-average intensity for numeracy use in everyday life. All Round 3 countries except the United States report lower proportions of median and intensive users of numeracy practices in everyday life and work – and higher proportions of limited users – than the average of OECD countries and economies, with the exception of Hungary for use at work.
In almost all participating countries and economies, men engage in numeracy practices more frequently than women, both at work and in everyday life. Controlling for other personal and job-related characteristics reduces this gender gap, especially for the intensity of use in everyday life.
In all countries and economies taking part in PIAAC except Greece, Italy and the United States, 55-65 year-olds engage less intensively in numeracy practices at work than 25-54 year-olds. Those aged 16-24 also engage less intensively than 25-54 year-olds, with the exception of Kazakhstan, Mexico, Peru and the Russian Federation. For the average OECD country, the differences between 25-54 year-olds and the youngest adults tend to be larger than those between 25-54 and 55-65 year-olds, but gaps vary substantially across countries. This is also true for the intensity of skills use in everyday life, once other individual and job-related characteristics are accounted for.
As found in earlier PIAAC rounds, engagement in numeracy practices both at work and in everyday life is positively associated with educational attainment, as upper-secondary graduates engage in numeracy practices more frequently than less-educated individuals, but less frequently than tertiary graduates, on average.
The gaps in the intensity of practice across attainment levels are wider in all Round 3 countries except the United States, but especially in Ecuador, Mexico and Peru. For these three countries, the adjusted gaps in numeracy use between adults with upper secondary education and those without are two to three times larger than the average for OECD countries. In Kazakhstan, conversely, individuals with below upper secondary education do not use numeracy less intensively than individuals with upper secondary education, either at work or in everyday life.
There is also a wider (positive) gap between tertiary-educated adults and those with upper secondary education in Round 3 countries (except the United States) than the OECD average. This is especially true for Ecuador, Kazakhstan and Peru.
With other features linked to engagement in numeracy held constant, being young, male, tertiary educated and more proficient in numeracy increases numeracy engagement among respondents whether they are working, unemployed or inactive, while being older and lacking an upper secondary qualification does the opposite. This is broadly the case for numeracy engagement at work as well as in everyday life, although these analyses cover two different populations. Students without upper secondary qualifications engage significantly more in numeracy practices than students with upper secondary education.
Occupation and the human resource practices adopted in workplaces explain a large share of the variation in the index of use of numeracy. In particular, high-performance work practices (e.g. team work, mentoring or job rotation) explain between 15% and 24% of the variation in skills use among individuals.
All Round 3 countries except the United States rank low, and lower than the OECD average, for engagement in social interaction and in problem-solving tasks at work. The United States, conversely, ranks at the top of both distributions of engagement, and displays the very highest intensity engagement in problem-solving tasks. These results may reflect, among other factors, how widespread decentralised management practices are across countries, and differences in the nature of production and the industrial structure of the economy.
The task-related information collected in PIAAC can be used to identify the risk of automation attached to each job. Nedelkoska and Quintini (2018[2]) found that the frequency of solving complex problems, and teaching others or influencing or advising them are negatively correlated with the automatability of a person’s job. Based on these authors’ methodology, this report computes the risk of job automation for the Round 3 countries and presents it for the first time. With the exception of the United States, the proportion of workers at high or significant potential risk of automation in all Round 3 countries and economies is higher than the OECD average, reaching 61% in Mexico and 68% in Peru. However, many factors, including institutional settings and price dynamics, could affect the diffusion and adoption of labour-saving technologies, and make a difference between potential and actual automation of some tasks on the job.
copy the linklink copied! Measuring skills use in the workplace and in everyday life
The Survey of Adult Skills (PIAAC) collects information about how often adults perform specific tasks in their everyday life and their jobs. Based on this information, it is possible to develop measures of the use of information-processing skills: reading, writing, numeracy, information and communications technology (ICT) skills, and problem solving.
Respondents are asked about the frequency with which they perform certain tasks associated with the use of information-processing skills. The resulting large amount of information can be combined into indices, each of which groups together several PIAAC questions. There are five potential indicators related to the use of reading, writing, numeracy, ICT skills and problem solving at work, and a further five related to engagement in these activities in everyday life. While in OECD (2013[3]; 2016[4]) indices were computed as a weighted average of the responses to different questions (or items), this chapter exploits item response theory instead. This estimation method can better account for the ranking of technical difficulty and rarity among the different items related to the same skill. Box 4.1 provides further details on the methodology used and the list of items associated with each indicator.
In this chapter, the index of numeracy use (also referred to as “engagement in numeracy practices”) summarises information not just about six activities involving calculations and use of mathematical formulas (use of a calculator; calculation of prices, costs or budgets, etc.), but also two further activities which usually fall under reading activities but which require the interpretation of mathematical information (reading bills, invoices, bank or financial statements; and reading diagrams, maps or schematics).
Table 4.1 provides a summary of the information about the numeracy activities that adults undertake at work and in everyday life, showing the proportion of adults who never engage in the activities in question and the mean value for the item (a higher score reflects more frequent engagement).
Unsurprisingly, advanced maths is the least frequently used of all the numeracy practices considered, followed by preparing charts and tables and using simple algebra or formulas. These are also the practices which the largest number of respondents said they never used, although with a relatively stark gap after the first two. At the opposite end of the frequency spectrum, calculating costs or budgets and using calculators are frequent both at work and in everyday life. For other practices, however, individuals report different patterns of use in everyday life and at work. On average across all respondents, reading financial statements happen very frequently in everyday life and more frequently than most other practices, while they are as frequent as other practices at work.
In the Survey of Adult Skills, the intensity in use of certain skills is approximated by how frequently tasks relevant to each skill are carried out. Indicators of skills use can be calculated considering the answers to multiple questions referring to the same skill.
The list of tasks falling under the scope of each index is reported in Table 4.2. For instance, an index of writing skills use is derived from a set of questions investigating the frequency with which individuals write different types of documents (letters, memos, e-mails, articles, reports, forms).
For numeracy use, the eight selected items reflect the multiplicity of applications for numeracy skills. Two questions aim at capturing the ability to interpret numerical information (read bills, bank or financial statements; read diagrams, maps or schematics), three others the mastery of pure mathematical knowledge (use of fractions, decimals or percentages; use of algebra or simple formulas; use of more advanced maths), and three others some technical skills which require familiarity with maths. As a result, this indicator of engagement in numeracy practices differs from the one used in OECD (2013[3]; 2016[4]), which excluded information on reading bills, invoices, bank or financial statements, and reading diagrams, maps or schematics. For this report, these were omitted from the index of use of reading skills as they were instead included in the numeracy skills index.
The frequency of each task is reported using five discrete values, ranging from 1 (the task is never carried out) to 5 (the task is carried out every day). One way to aggregate information over multiple items is to take (weighted) averages across items. However, the result can be hard to interpret, as the different numeracy practices are treated indiscriminately, regardless of their rarity and relative difficulty. For instance, the “ideal” frequency of the use of reading skills may not be the same as the frequency for solving complex problems. Furthermore, the value of the indicator could reflect both the number of practices and their frequency of use. For example, the same value of an indicator could result from using multiple different numeracy skills infrequently, or from engaging very regularly in a small number of numeracy practices.
Here, the indicators of engagement in a given activity are instead estimated using item response theory (IRT). An IRT model estimates the probability with which the respondent gives a certain answer to the set of underlying questions (“items”). The collection of these probabilities approximates an underlying, unobservable trait of the individual, which in this case is the “proficient use of skills”. Researchers are interested in understanding how the unobservable trait relates to each individual item and to the group of items as a whole, and IRT models enable the study of these relationships. While Chapter 17 of OECD (2019[5]) contains more information on IRT models in PIAAC, the use of IRT is now considered best practice in many areas of test analysis (Braun and von Davier, 2017[6]).
After rescaling, the resulting index of skills use (or the “engagement index”) uses continuous values between 0 and 1. A given value of the index implies that the individual ranks in that percentile of the distribution of the skills use.
Following Jonas (2018[1]), individuals can be further grouped by their level of engagement in the use of skills (limited, median or intensive), by taking into account whether the frequency with which they engage in practices is higher or lower than in the population as a whole. For instance, in the case of numeracy use in everyday life, intensive users report frequently using the skills which are most rarely mentioned by other individuals, limited users report high frequencies of the three most frequent items, and median users high frequencies of the six most frequent items. This grouping corresponds to different parts of the distribution of skills use in everyday life, as estimated by the IRT model. Jonas (2018[1]) studied this distribution and found that individuals falling into the first 40 percentiles could be considered limited users, individuals in the top 25 percentiles intensive users, and the remaining individuals median users. The same thresholds apply for numeracy skills use at work.
While Jonas (2018[1]) focuses particularly on numeracy use in everyday life, this chapter extends his methodological approach to skills use at work. Nevertheless, unreported analysis by the OECD for this report shows that differences in the use of numeracy practices of different complexity across individuals are less marked at work than in everyday life. In the case of skills use at work, IRT-based indicators and indicators based on weighted averages across items – as in OECD (2013[3]; 2016[4]) – yield very similar results.
copy the linklink copied! Levels of skills use in the workplace and in everyday life
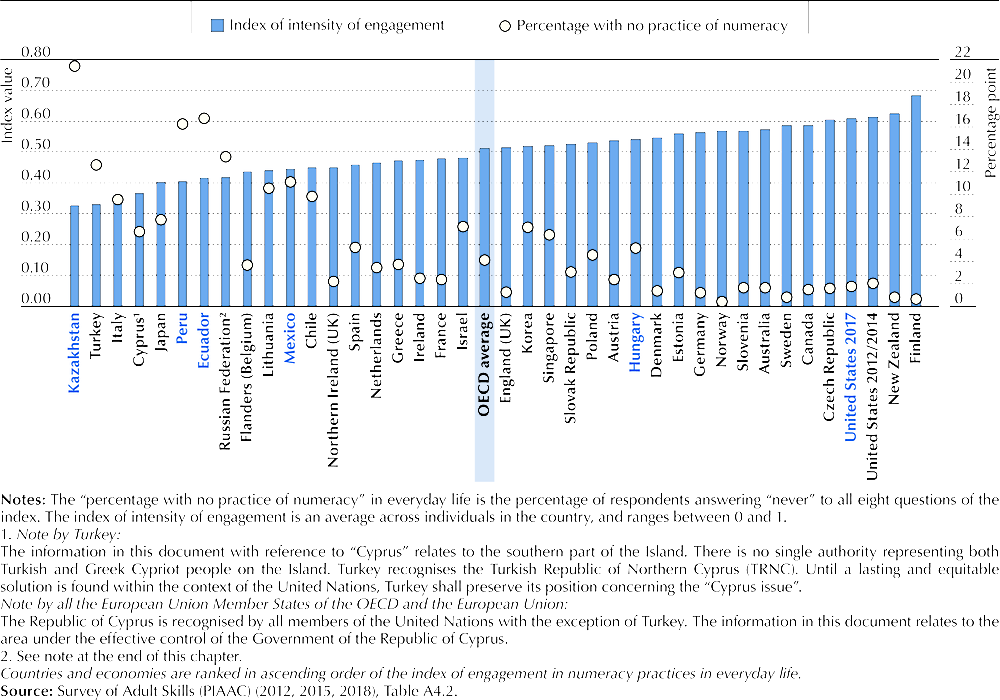
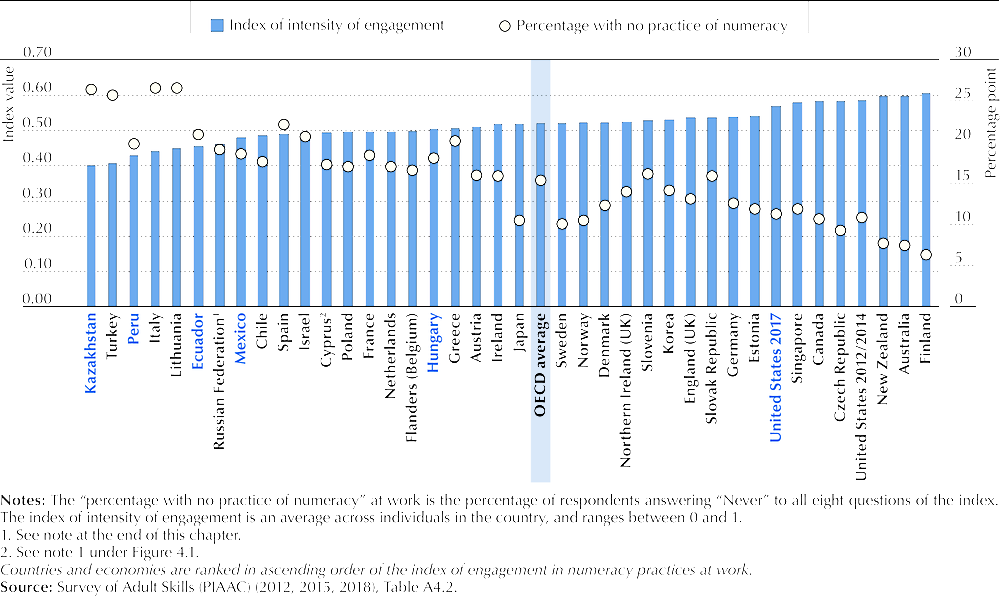
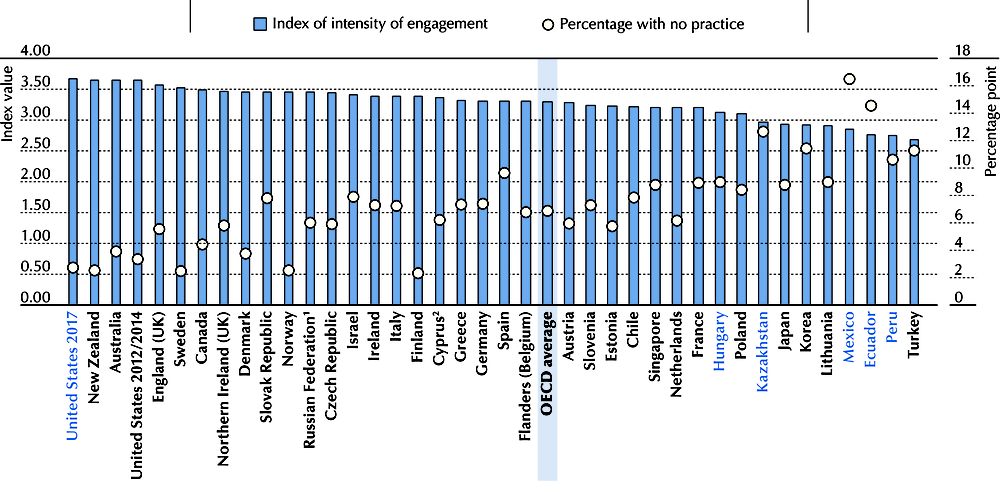
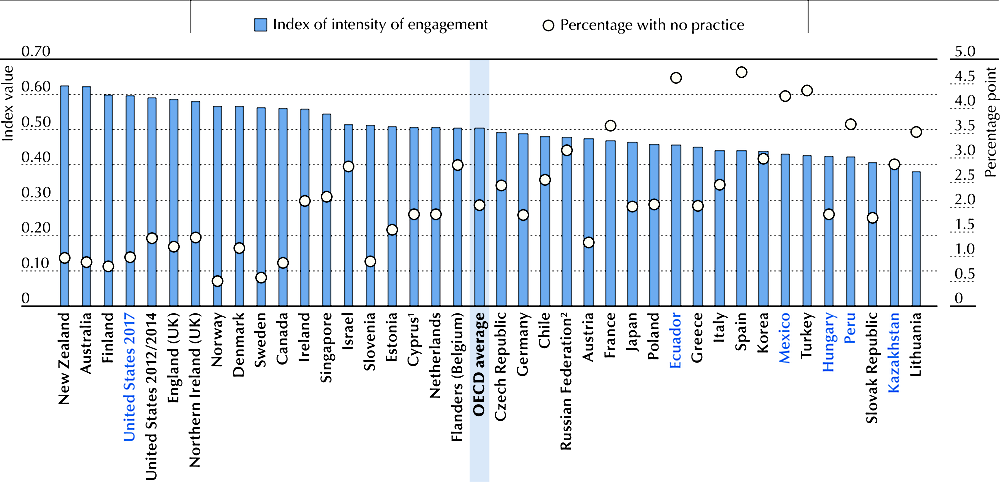
Figure 4.1 plots the index of intensity of engagement in numeracy practices in everyday life, as an average across individuals in the country, as well as the percentage of respondents answering “Never” to all eight questions of the index. Figure 4.2 plots the same statistics, but for the use of numeracy skills at work, for those respondents who are employed. While the OECD average for the index is similar for engagement in numeracy at work and in everyday life, national values for the engagement index are more diverse in everyday life (ranging from 0.3 to 0.7) than at work (ranging from 0.4 to 0.6). Any comparisons, however, must take into account that the underlying populations differ: skills use at work is calculated for employed workers only, while skills use in everyday life for all surveyed individuals.
Countries ranking low for skills use in everyday life (Italy, Kazakhstan, Peru, Turkey) also rank low for their use at work, and, similarly, the countries at the top of the distribution for everyday skills use (the Czech Republic, Finland, New Zealand and the United States) also rank high for their use at work. This suggests that the use of skills in everyday life and at work are highly, albeit imperfectly, correlated at the country level. Ecuador, Kazakhstan, Mexico and Peru also rank in the lower part of the distribution of engagement in numeracy practices for both indicators, similar to Chile. Hungary, in contrast, displays below-average intensity in engagement in numeracy practices at work, and above-average intensity for numeracy use in everyday life.
Countries and economies with similar engagement index values can report markedly different shares of the population declaring they never use any of the numeracy practices considered. For instance, both Singapore and the Slovak Republic have an index of engagement of around 0.52, but 6% of Singaporeans never engage in any numeracy practice in everyday life, compared to 3% of Slovaks. This reflects how country averages can hide considerable variation in the use of skills among individuals within a country. Overall, the proportion of respondents who never engage in any numeracy practice is lower for numeracy use in everyday life than at work (4% in everyday life, compared with and 15% at work on average across OECD countries).
The relationship between proficiency and use
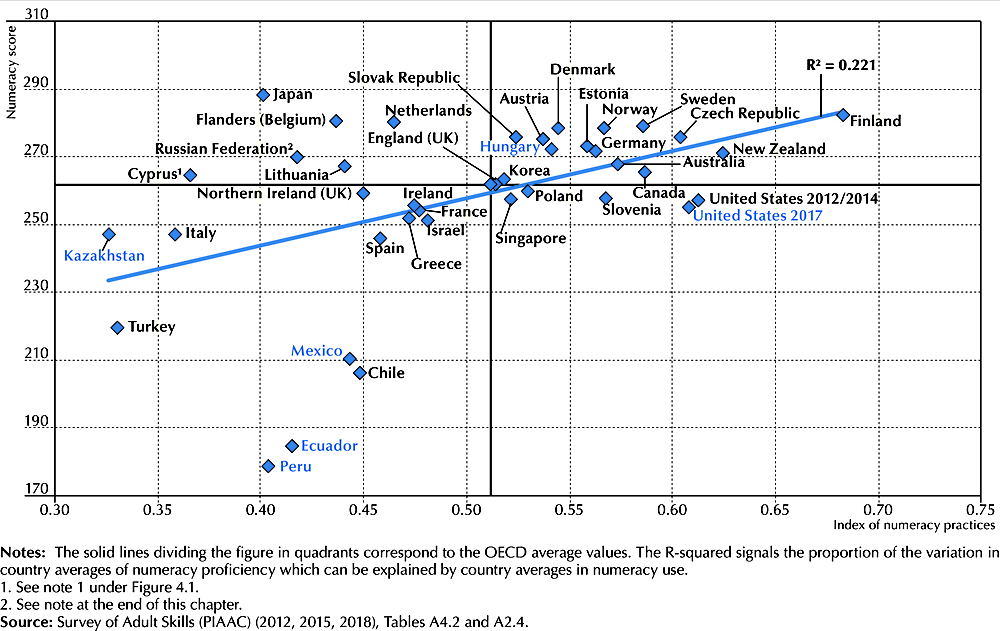
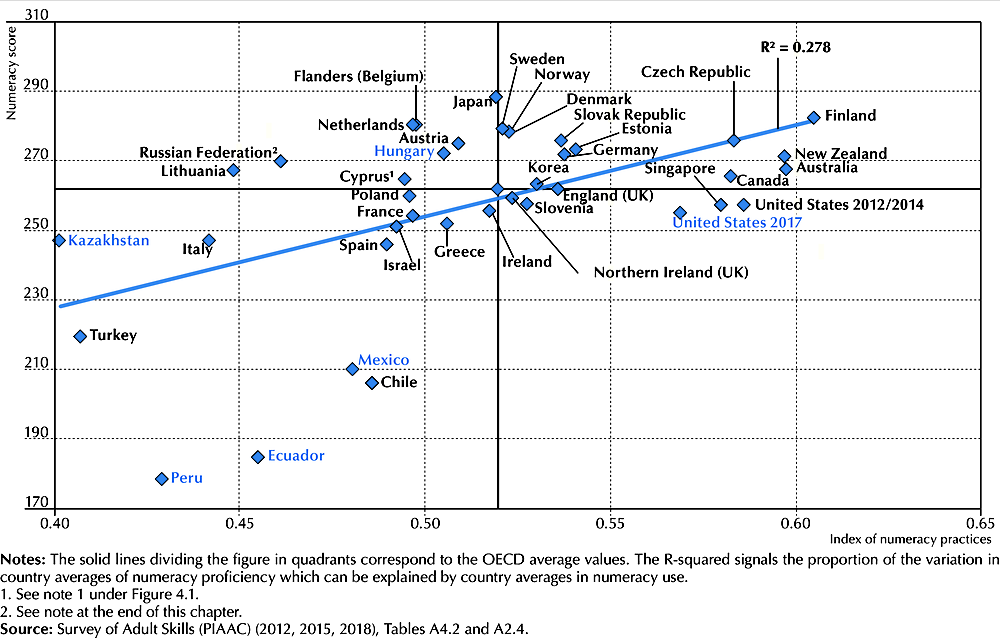
Figure 4.3 and Figure 4.4 highlight how proficiency and engagement in numeracy practices are related for the average individual in each country and economy.1 The correlation is positive and significant at the 1% confidence level when all countries and economies in the sample are considered, but is smaller when Latin American countries are excluded from the sample.2 Furthermore, the relationship is more positive for the engagement index at work than in everyday life. Low levels of mathematical competence can reduce an individual’s propensity to engage in mathematical activities while the opposite applies for high levels of mathematical proficiency. At the same time, use can help to sharpen proficiency in numeracy or limit its obsolescence through the frequent exercise of mathematical skills.
The relationship between proficiency and use, however, becomes less positive and only significant at the 10% level when the sample is restricted to high-income countries (according to the World Bank Atlas ) and thus excludes Ecuador, Kazakhstan, Mexico, Peru, the Russian Federation and Turkey. On average among individuals in a country, skills use seems to be less tightly related to numeracy proficiency in high-income countries than in middle-income ones.
The relatively small share of the cross-country variation in numeracy proficiency, which can be explained by skills use (i.e. the R-squared values in Figure 4.3 and Figure 4.4) suggests that other factors can play a role in explaining proficiency, and can change the correlation of numeracy proficiency with use. One such factor could be a country’s age structure: if the correlation between skills use and proficiency is lower among older individuals than younger ones, the correlation between these two facets will be lower in countries and economies with higher proportions of older individuals.
Another factor is the presence of individuals who perform strongly in numeracy (Level 4 or 5) but make little use of it in their jobs. Unreported analysis shows that these account for 1.8% of employed individuals on average among OECD countries in the Survey of Adult Skills, but also that the share can be as high as 3.9% (Flanders, Belgium). In contrast, the Latin American Round 3 countries display the lowest proportion of such individuals among all countries, just below Chile (0.3%).
To facilitate the interpretation of the index of engagement in numeracy practices, in Figure 4.5 and Figure 4.6, individuals have been grouped into three categories as described in Box 4.1: limited, median and intensive users of numeracy practices. Finland stands out as the country with the lowest proportion of limited users, both in everyday life (13%) and at work (23%), closely followed by New Zealand (21% in everyday life and 27% at work) and the United States in (25% and 33%). Conversely, these shares are highest in Kazakhstan (70% in everyday life and 59% at work) and Turkey (66% and 57%).
These are the same countries at the top and bottom of the rankings when looking at the index of engagement in numeracy practices (Figure 4.1 and Figure 4.2). However, the categorisation of individuals into three groups expands the information set provided by the index, as it explains how the different proportions of intensive and limited users affect a given value of the index. Most countries with a large share of limited users also have a small share of intensive users but this is not the case for all of them. Consequently, countries with similar engagement in everyday life, e.g. Sweden and Canada, can have different proportions of intensive users (28% in Sweden compared with 33% in Canada) or limited users (24% compared with 27%).
In common with the findings highlighted in Figure 4.1 and Figure 4.2, the average OECD figures for engagement in everyday life and at work are very similar. However, individual countries and economies show more variation between skills use in everyday life and at work. All Round 3 countries except the United States report lower proportions of median and intensive users, and higher proportions of limited users than the average of OECD countries, as far as engagement in numeracy practices at work is concerned. The same applies for engagement in numeracy practices in everyday life, except for Hungary, which displays higher proportions of intensive users than the average OECD country (27% compared to 25%), and lower proportions of limited users (33% compared to 39%).
copy the linklink copied! Numeracy practices at work and in everyday life: The relationship to demographic characteristics
Engagement in numeracy skills is related to a number of other factors, both individuals’ personal characteristics and features of their workplace and the context of their lives. This section explores these relationships.
Gender
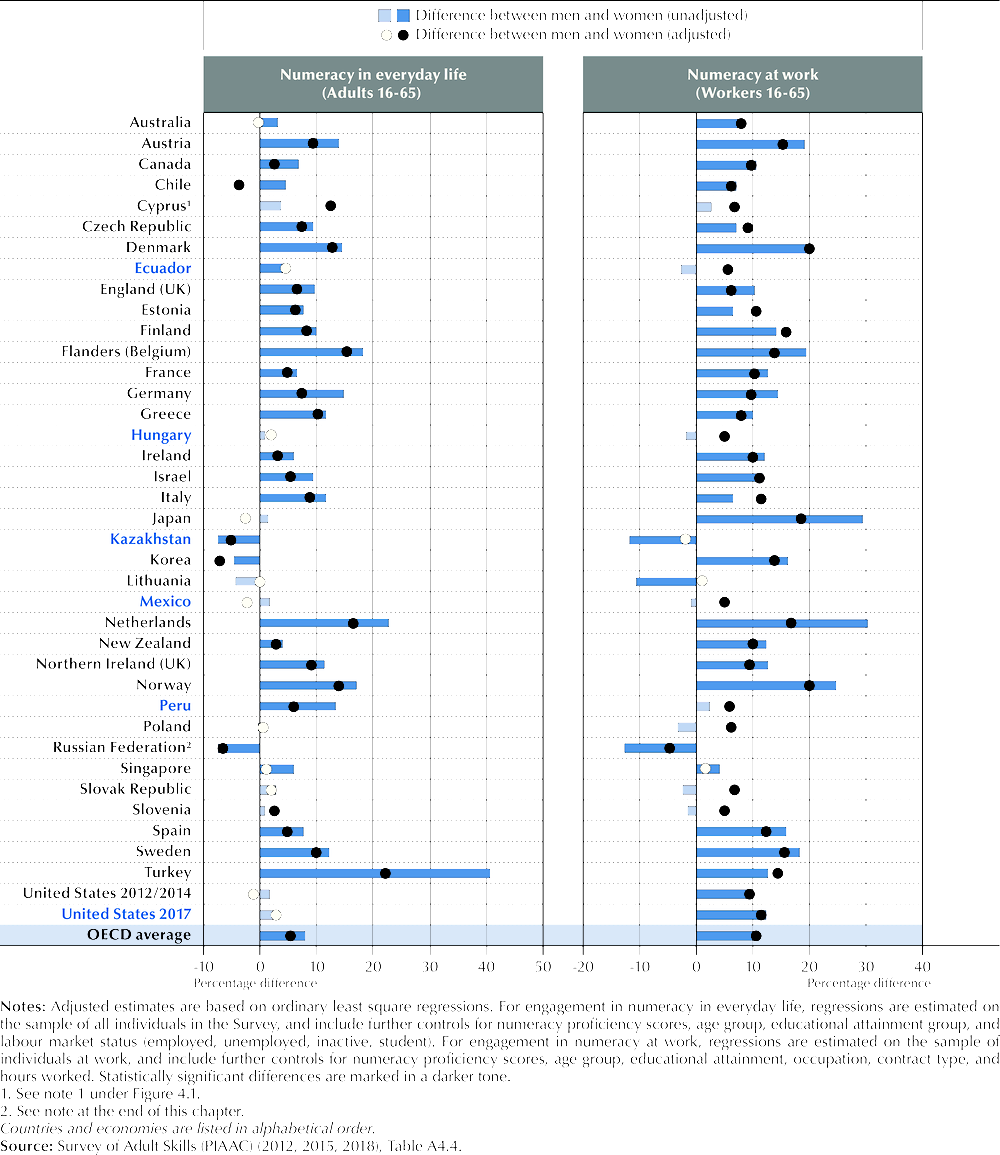
OECD (2016[4]) highlighted that men and women differed significantly in how frequently they used numeracy skills in the workplace. The indicators of numeracy engagement presented here confirm that men engage in numeracy practices more frequently than women (Figure 4.7, unadjusted series). These gender differences in the use of numeracy are found both at work and in everyday life, although they are larger at work. Kazakhstan, Korea, Lithuania and the Russian Federation are the exceptions, with women using numeracy skills more frequently than men in everyday life.3
This gender gap could stem from gender differences in individual characteristics, as well as from differences in the nature of the jobs that men and women hold. For example, if full-time jobs tended to require numeracy skills more often than part-time ones, women – who are more likely to be employed part-time – might display less engagement in numeracy practices on average as a result. For this reason, Figure 4.7 also plots adjusted differences, which control for numeracy proficiency scores, age group and educational attainment group. The adjustment also considers individuals’ labour-market status (for numeracy use in everyday life), and hours worked, contract type and occupation of employment (1-digit ISCO 2008 occupational classes) for numeracy use at work.4,5
Adjusting for these characteristics, however, hardly changes the differences between genders. When it does, it usually increases men’s advantage for numeracy engagement at work (the differences in Ecuador, Hungary, Poland, the Slovak Republic and Slovenia become positive and significant at the 5% level), and, in some countries, it increases the advantage among women for numeracy engagement in everyday life (in Chile).
As with the unadjusted series, the adjusted average gender gap in numeracy engagement across OECD countries and economies is larger at work than in everyday life. This may be due to factors not taken into account by the adjustment procedure, the self selection of workers into jobs with different numeracy skills use, or discriminatory practices by employers. On average across OECD countries, however, the adjustment leaves the size of the gender gap essentially unchanged for numeracy use at work whereas the gap narrows by approximately 30% for numeracy use in everyday life, suggesting that a large part of the gap can be explained by the features included in the adjustment procedure.
Overall, for use both at work and in everyday life, the OECD average hides some differences across countries in the effect of the adjustment, possibly related to differences in the complex interactions that exist among the controls in the adjustment procedure. After adjustment, the gender gaps in numeracy engagement at work in Denmark, Flanders (Belgium), the Netherlands, Norway and Sweden decline but remain the largest among participating countries and economies. Japan and Korea also display large gender gaps, but only for numeracy use at work. All the Round 3 countries display similarly small adjusted gaps in numeracy use at work with the exception of the United States, which lies close to the OECD average. The gaps are much smaller – and statistically insignificantly different from zero at the 5% confidence level – in the case of numeracy use in everyday life, with the exception of Kazakhstan and Peru.
Age
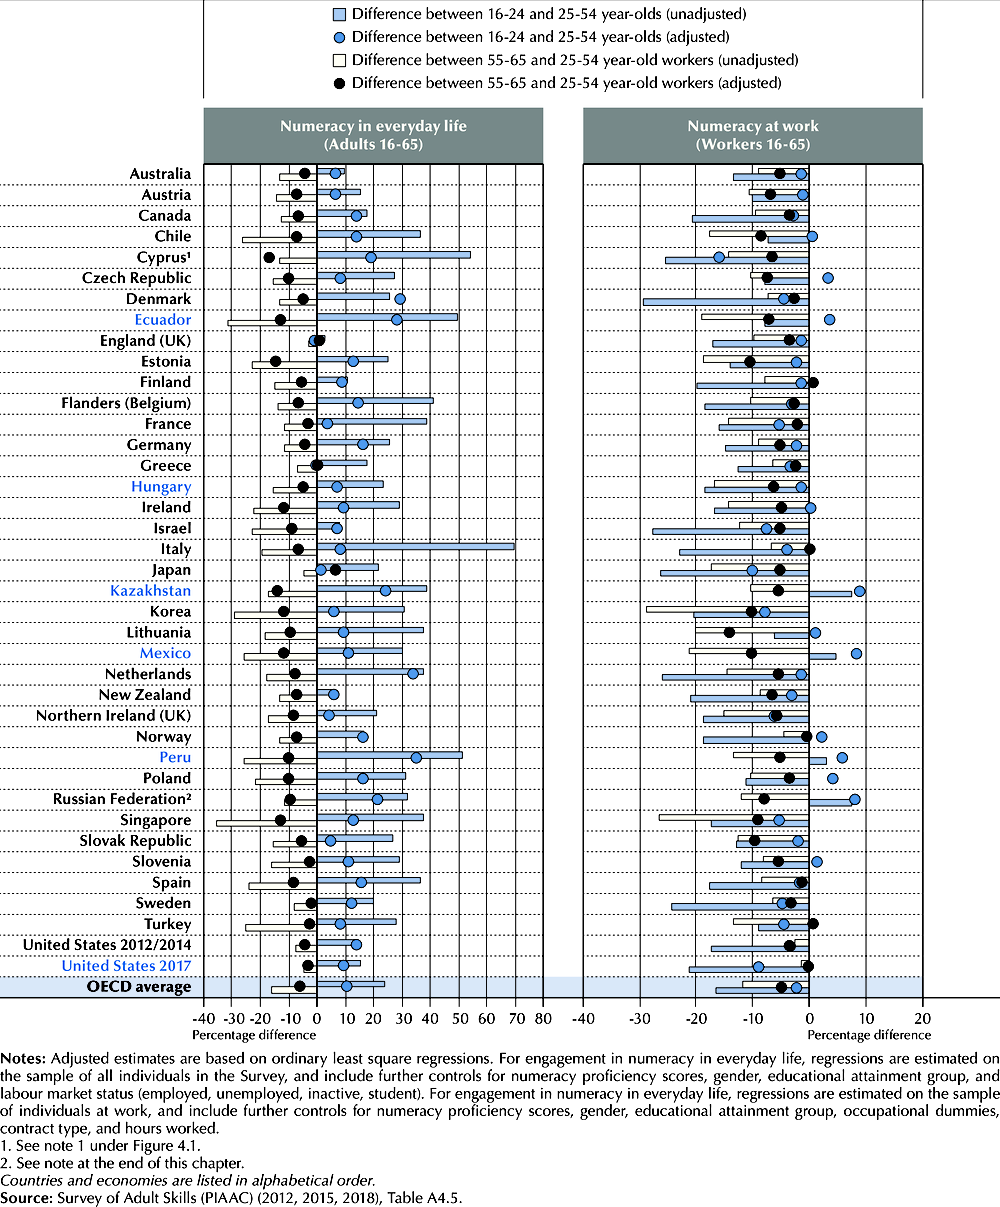
In all countries and economies considered, 55-65 year-old workers engage in numeracy practices at work less intensively than 25-54 year-olds, although the differences are not statistically different from zero in Greece, Italy and the United States (Figure 4.8). The youngest age group (16-24 year-olds) also engage less intensively than 25-54 year-olds, with the exception of Kazakhstan, Mexico, Peru and the Russian Federation. For the average OECD country, the differences between the youngest adults and 25-54 year-olds are more substantial than between 25-54 year-olds and the older age group, but the gaps differ substantially across countries. The unadjusted differences between age groups are, in any case, larger than the differences between women and men.
The direction of these differences is probably driven by the fact that skills appear to peak between the ages of 25 and 54. The decline in use over time may reflect the decline in proficiency, which peaks at around the age of 30, as in Paccagnella (2016[7]), for example. It could also reflect improvements in the average educational attainment of the population over time, as in Ecuador or Peru, since age and cohort effects cannot be distinguished in a cross-sectional dataset such as the Survey of Adult Skills. However, career patterns may also play a role. For instance, workers aged between 25 and 54 could be more likely to hold jobs that require strong engagement in numeracy, while younger people hold more junior positions, and the roles of older workers may involve more managerial tasks.
For the average OECD country, controlling for other individual and work-related characteristics reduces the gaps between age groups, but 25-54 year-olds still use numeracy practices more intensively than older and younger individuals at work. The gaps are larger relative to older than younger individuals, with the gap between the youngest workers and 25-54 year-olds reversed in some countries. This reflects the fact that older individuals make less intensive use of numeracy practices than young individuals, once other determinants of numeracy use are accounted for.
Turning to numeracy in everyday life, the gap still favours 25-54 year-olds over older individuals. Conversely, the youngest adults make greater use of numeracy skills in everyday life than those aged 25-54. Accounting for other correlates of numeracy engagement, including respondents’ labour-market status, decreases but does not erase the advantage of young individuals in everyday use in most countries and economies. In Ecuador and Peru this advantage is comparable to the advantage in Denmark and the Netherlands, and approximately three times the OECD average. Only in Japan is the adjusted gap for the youngest adults smaller than the gap between 25-54 year-olds and 55-64 year-olds.
This result is largely driven by the fact that the measure of skills use in everyday life also encompasses those young individuals who are not in work, and are more likely to be in education, and whose greater use of numeracy may reflect their course requirements. Jonas (2018[1]) similarly reports that the percentage of 16-25 year-olds making intensive use of numeracy practices in everyday life is almost double that of 26-55 year-olds, and three times that of older individuals.
Overall, the adjustment procedure reduces the magnitude of the raw gap much more than in the case of the gender gap. Gender gaps remain high after adjustment, reaching 70-100% of the unadjusted ones, while gaps between age cohorts reduce considerably upon adjustment, reaching 14-44% of the unadjusted ones, with the gap for the oldest group reducing less than the gap for the youngest.
Educational attainment
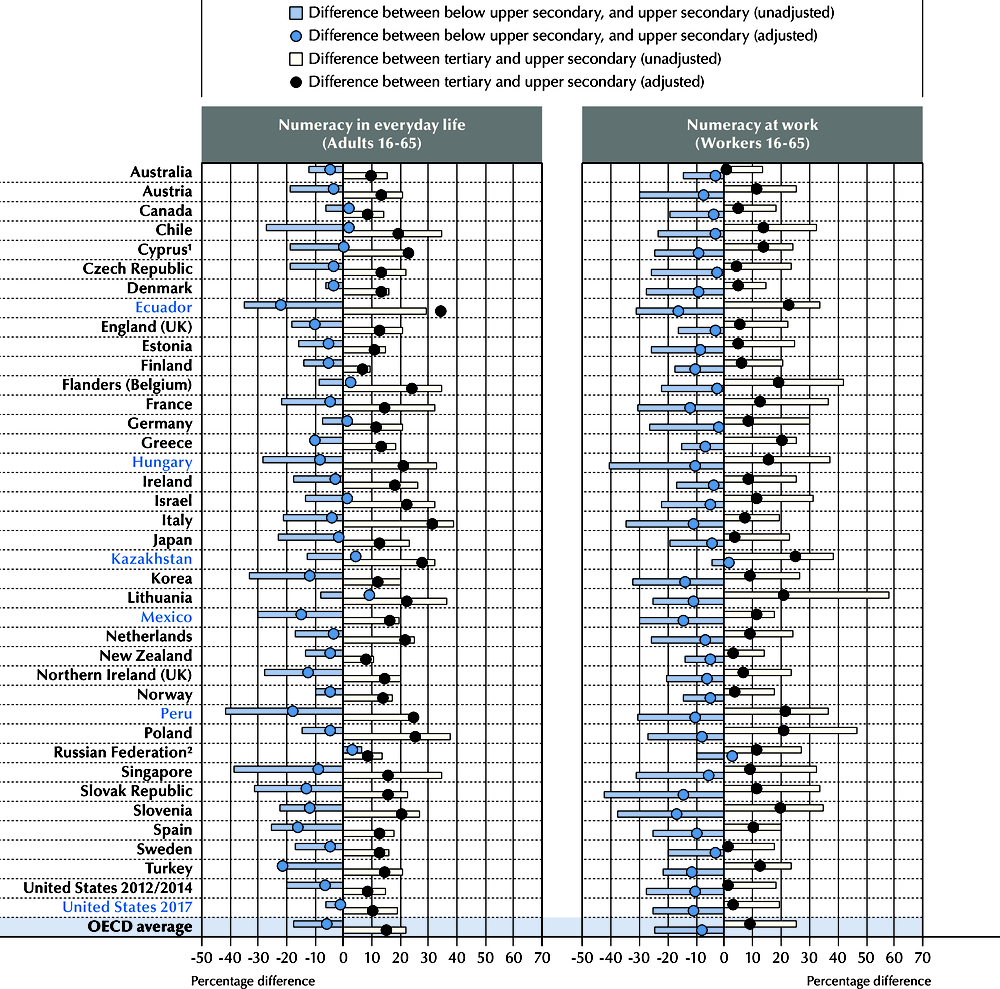
Figure 4.9 explores differences in engagement in numeracy practices between individuals with and without upper secondary education, and between individuals with tertiary and upper secondary education.
The results mirror those in OECD (2016[4]). In essentially all countries and economies considered, compared to individuals with an upper secondary qualification, respondents with tertiary qualifications engage in numeracy practices more intensively, while respondents without an upper secondary qualification engage less intensively. These patterns hold for numeracy engagement both in everyday life and at work.
The average unadjusted differences across OECD countries are large: 18-22% for intensity of use in everyday life and 25-26% for use at work, even larger than those observed between age groups. However, the gaps narrow considerably when other correlates of engagement in numeracy practices are accounted for: on average across OECD countries the adjusted gaps in numeracy use in everyday life fall to 6% between those with and without an upper secondary education, and 15% between tertiary-educated adults and those with an upper secondary education. The adjusted gaps are also smaller for numeracy use at work, but still as high as 8-9% of the use among upper secondary-educated workers.
In Ecuador, Mexico and Peru the adjusted gap for numeracy use in everyday life between those with and without an upper secondary education is three times the OECD average. In Mexico and Peru the adjusted gap for numeracy use at work is also double the average. In Kazakhstan, conversely, individuals with without upper secondary education do not use numeracy less intensively than individuals with an upper-secondary qualification, either at work or in everyday life.
The gap in use between tertiary-educated individuals and those with upper secondary education is positive on average across the participating OECD countries. It is also much wider in Round 3 countries than on average (except for the United States), and especially in Ecuador, Kazakhstan and Peru, where the differences in usage at work and everyday life range between 21% and 33%. Hungary lies close to the OECD average for all the mentioned gaps in numeracy engagement, although with slightly larger gaps.
While the use of skills is affected by a variety of phenomena, more educated individuals would be expected to have higher skills, and likely make greater use of them. However, although controlling for other determinants reduces the differences in numeracy engagement between individuals with different educational backgrounds, a sizeable difference remains. This, in turn, calls for greater reflection on how the use of skills could be encouraged among individuals with lower educational attainment, so that the combination of fewer years of education and lower numeracy use than their skill level would otherwise suggest does not produce a negative spiral which leaves the least educated with lower and lower skills over time.
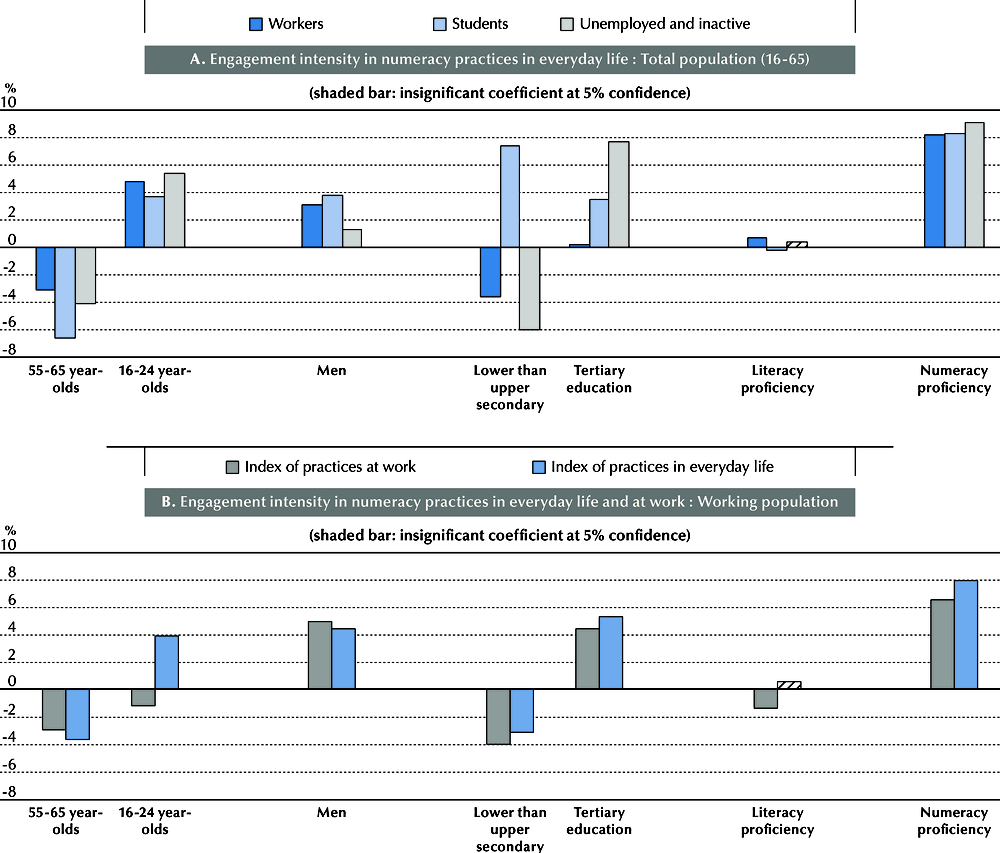
Figure 4.8 already highlighted the significant difference in numeracy engagement in everyday life between 16-24 year-olds and 25-54 year-olds, which could be explained by many respondents in the younger cohort being students. Further insights into the determinants of engagement in numeracy practices in everyday life can be derived by comparing workers, students and inactive or unemployed respondents. Figure 4.10 estimates the relationship between intensity of numeracy engagement and a number of likely correlates for these three subgroups of respondents. While the magnitudes differ and can hardly be compared visually across groups (as they originate from different samples), the direction of the associations are the same for the three groups, with the exception of below upper secondary educational attainment.
A standard deviation increase in numeracy proficiency is associated with a higher position of the individual in the distribution of the index of approximately 8 percentiles, for all three categories of interest (Figure 4.10 Panel A).6 Conversely, the intensity of numeracy use and proficiency in literacy are essentially unrelated. This stark difference suggests that intensive numeracy use does not rely on high levels of writing and reading skills, once the level of proficiency in numeracy is already accounted for.
With other covariates of engagement in numeracy held constant, being young, being male, holding a tertiary qualification and being more proficient in numeracy increases numeracy engagement for workers, unemployed and inactive respondents. Being older and not having an upper secondary education does the opposite. This is broadly the case for numeracy engagement at work as well as in everyday life, although the analyses consider two different populations.7 Students without an upper secondary education engage significantly more intensely in numeracy practices than students with one, and even more than tertiary-educated students.
Explaining other information-processing skills at work
The analysis of the correlates of numeracy engagement presented in Figure 4.7 to Figure 4.10 has paid particular attention to the role of education, gender and age, as these are reported and of equal importance for the use of numeracy at work and in everyday life. Of course, this does not exclude the possibility that other characteristics, both personal and related to the individual’s working life and context, could influence the intensity of numeracy use. These may include individual preferences about using numeracy in everyday life, or working in the type of jobs that require more or less frequent use of numeracy. Although information about these preferences is not reported in the Survey of Adult Skills, the industry sector and size of individuals’ employers, their internal work organisation, and the type of employment contract, are also likely to shape an individual’s engagement in numeracy practices, especially at work (OECD, 2016[4]).
In particular, implementing what are known as “high-performance work practices” could raise skills use and productivity. These managerial and human relations practices involve aspects of work organisation – such as team work, autonomy, task discretion, mentoring, job rotation and applying new learning – as well as management practices such as employee participation, incentive pay, training practices and flexibility in working hours (Bloom and Van Reenen, 2010[8]). These practices can be at least partially approximated by information collected in the Survey of Adult Skills. The survey asks workers about their degree of co-operation with each other, participation in training, flexibility to choose the sequence of their tasks and the type and speed of their work, flexibility to organise their time and activities at work, and whether bonus payments are offered.
Another factor that determines how workers use their skills is the size of the establishment where they work. Workers employed in large organisations are more likely to be better educated and to interact with more sophisticated technologies, which would translate into greater engagement in numeracy practices.
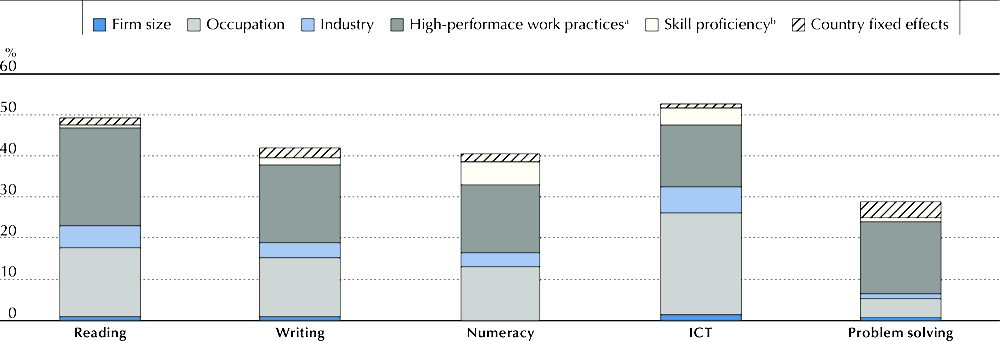
Figure 4.11 shows how the variation in skills use at work in the OECD countries covered by the survey can be attributed to different factors, including individual proficiency, job/employer characteristics and human-resource practices. The observable components included in the model explain 29.0-53.0% of the variation in skills use, of which 1-3.8% is attributed to underlying country characteristics.
The bulk of the residual variation is explained by the use of high-performance work practices by the employer (15.0-24.0% depending on the skill use considered), and by the worker’s occupation (4.5-24.6%). In contrast, proficiency in literacy, numeracy or problem-solving skills, only explains a small part of the variation in skills use at work, but slightly more for ICT (4.2%) and numeracy engagement (5.6%) than other skills use.
The high correlation between human-resource practices and skills use at work is in line with the findings of OECD (2016[9]) and with a large body of literature showing that participatory practices at work – such as allowing workers more flexibility in determining the way and rhythm at which they carry out their tasks – encourage better use of skills in the workplace. Further incentives to use skills could be provided by management practices such as bonuses, training and flexibility over working hours.
These results taken together confirm that proficiency alone cannot be used as a good proxy for the use of skills at work. Conversely, job-specific characteristics such as occupation and managerial practices explain a significant share of the variation in use across skill types.
copy the linklink copied! Engagement in problem solving and social interaction tasks at work, and automation
Workers perform a number of other tasks at work, which have not been considered in the indices of skills engagement so far. For instance, an index of skills use at work can be computed for problem-solving tasks as in Figure 4.11. The Survey of Adult Skills asks individuals about how often they solve simple and complex problems at work. The index plotted in Figure 4.12 is constructed as an average of the reported frequencies for these items, ranging from 0 (“never”) to 4 (“every day”). While solving simple problems is a frequent activity for most workers, solving complex ones is much rarer, but a frequent activity for a few very skilled individuals. Similarly to numeracy engagement, therefore, averaging the frequencies reported for the two underlying items partially confounds the frequency of the task with its complexity.
Figure 4.12 shows that the average worker in the United States, New Zealand and Australia engages in problem solving at work more frequently than in any other country, but the variation across countries and economies is relatively small. Conversely, Ecuador, Mexico, Peru and Turkey report the lowest frequency of problem solving for the average worker. While Hungary and Kazakhstan display higher average frequency values than Ecuador, Mexico or Peru, in all Round 3 countries except the United States the use of problem solving at work is less frequent than the OECD average across countries.
The frequency with which workers advise, influence or teach people can also provide evidence about the intensity with which workers interact with colleagues on the job. An index of engagement in social interactions at work has been constructed in very much the same way as the index of engagement in numeracy practices (see Box 4.1), i.e. applying IRT on the set of relevant items. The indicator considers how frequently workers interact with each other (share work-related information, co-operate with colleagues), and also how frequently their job requires interaction with others (teach, give presentations, advise, influence, sell to or negotiate with people).
In Figure 4.13, New Zealand stands out as the country where individuals engage in social interactions at work most frequently, along with Australia, Finland and the United States. At the opposite end of the spectrum, individuals use social interaction skills at work less frequently in Kazakhstan, Lithuania, Peru and the Slovak Republic. All Round 3 countries except the United States rank low in the distribution, suggesting limited engagement in social interaction at work.
Although the proportion of individuals never engaging in social interactions is not perfectly correlated with the index, countries with the highest values of the index do tend to have a smaller share of adults who report never engaging in any of the social interaction tasks listed above, while those with the lowest values tend to have larger shares of such people. The proportion of individuals never engaging in social interactions exceeds the OECD average for all Round 3 countries except Hungary and the United States, but is especially high in Ecuador, Mexico, Spain, and Turkey.
These cross-country differences in the indexes of engagement in social interactions and problem solving at work may reflect differences in the use of decentralised management practices, which allow workers to negotiate, advise, instruct etc. more frequently. Another explanation could lie in differences in the nature of production and the industrial structure of countries, which may require different intensities of social interaction, for example production lines in manufacturing industries.
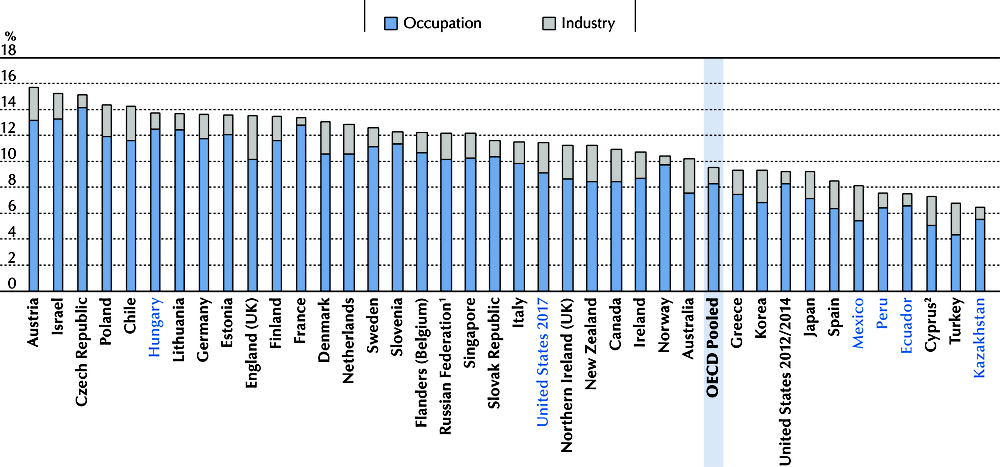
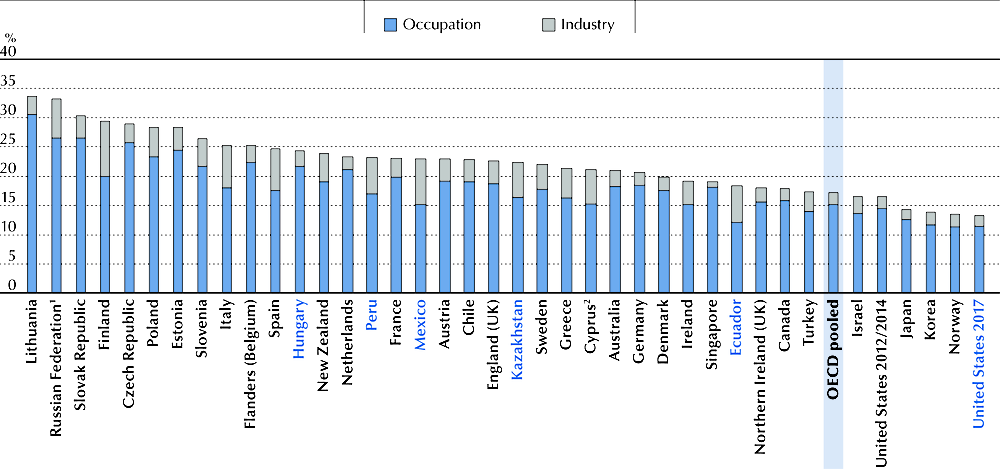
For this reason, the following two graphs (Figure 4.14 and Figure 4.15) report the share of the variance of the social interaction and problem-solving indexes that can be explained by the respondent’s industry and occupation. Together, occupation and employment sector explain 7-16% of the variance in the index of engagement in problem-solving tasks on average across the respondents and countries, and 13-34% of the variation in workers’ engagement in social interactions.
A worker’s occupation accounts for most of these proportions: across all OECD countries, occupation explains approximately 8% of the variance in engagement in problem-solving tasks, and 15% of that in social interactions. In contrast, the industry of employment accounts for 1% of the variance in engagement in problem-solving tasks, and 2% of that for social interactions. For Ecuador, Kazakhstan, Mexico and Peru, however, occupation and employment industry together explain a smaller part of the total variance in engagement in problem solving than in most other participating countries. This suggests that components other than the production structure should be considered when attempting to explain problem-solving engagement at work in these countries.
For these countries, occupation explains a lower proportion of total variance in problem solving engagement than in almost all other countries, while the industry of employment explains a larger share of the variance in engagement in social interactions than in the average country. Finland, Italy, the Russian Federation and Spain display similar proportions.
While occupation and industry explain a large share of the variation in problem solving and social interactions, there is a significant degree of heterogeneity within occupations and industries. Even within narrowly defined sectors and occupations, individuals perform social interactions to a different degree. Jobs requiring frequent social interactions are also less likely to be automated, insofar as current levels of technological development allow for the automation of mostly routine-intensive, codified tasks.
Nedelkoska and Quintini (2018[2]) exploit this variation to estimate the extent to which an individual’s job is at risk of automation, based on data from the Survey of Adult Skills. The risk of a person’s job being automated is a direct function of the tasks the individual performs on the job. Nedelkoska and Quintini (2018[2]) found that the frequency of solving complex problems and of teaching, influencing or advising others are negatively correlated to the automatability of a person’s job. They also found that many occupations in OECD countries are characterised by high and rising levels of social interactions, problem-solving skills, creativity and ability to care for others.
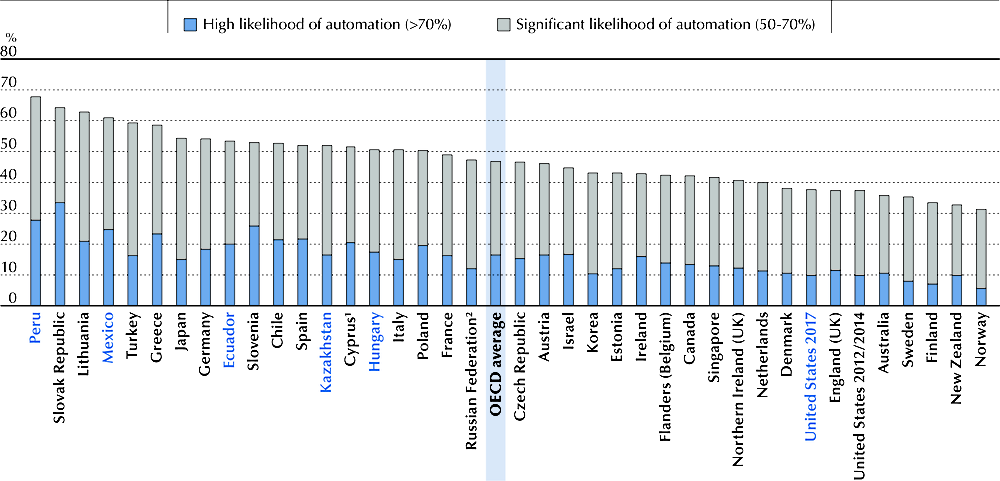
Figure 4.16 exploits the estimates of the risk of automation by Nedelkoska and Quintini (2018[2]) to compute the share of employment currently at high risk (i.e. with a probability of automation greater than 70%) and at significant risk (i.e. with a probability of automation between 50% and 70%). On average across the OECD countries and economies taking part in the survey, 16.6% of all jobs have high likelihood of automation, and 30.2% have a significant one.
Overall averages, however, hide substantial differences: the Slovak Republic has the largest share of jobs at high risk of automation (33.6%), while Norway has the smallest (5.7%). More generally, jobs in Anglo-Saxon and Nordic countries and the Netherlands are less automatable than jobs in Eastern European and South European countries, Germany, Chile and Japan. The proportion of workers at high or significant risk of automation in the Round 3 countries (except the United States) is higher than the OECD average, reaching 60.8% in Mexico and 67.6% in Peru, the latter having the highest share among the countries and economies participating.
A word of caution is nevertheless needed in interpreting these figures. The reported probability of automation is derived from the assessment of what is potentially automatable in the country, rather than by the effective diffusion of labour-saving technologies in a given country. What is more, other economic mechanisms such as factor prices as well as the institutional environment can shape the intensity and timing with which a certain technology is adopted by different employers in a country. All these aspects can shield a worker’s job from being automated, even in sectors and occupations displaying large potential for automation.
copy the linklink copied! Summary
Countries ranking low for the use of skills everyday life (Italy, Kazakhstan, Peru and Turkey) also rank low for their use at work, while the opposite applies to the countries ranking at the top of the distribution (the Czech Republic, Finland, New Zealand and the United States). The results are similar when individuals are grouped into three categories by their engagement in numeracy practices, with the same countries at the top and the bottom of the rankings. All Round 3 countries except the United States report smaller proportions of median and intensive users of numeracy in everyday life and at work, and larger proportions of limited users than the average for OECD countries and economies, with the exception of Hungary (for use at work only) and the United States.
A new index of intensity of social interactions estimates that individuals in all Round 3 countries except the United States also engage in social interaction at work much less than the OECD average, and less than most other participating countries and economies. The same can be said about engagement in problem solving at work. This is also reflected in high proportions of jobs at high or significant risk of automation (over 60% for Mexico and Peru), which usually display limited engagement in social interactions.
Average engagement in numeracy practices and numeracy proficiency are positively correlated at the country level, although only weakly. Low levels of mathematical skills would be expected to impede the intense use of numeracy, while greater use can slow down any decline in numeracy proficiency over time. The correlation, however, is weaker if the Round 3 countries are excluded from the sample. Furthermore, proficiency was found to explain only about 5-6% of the variation in individuals’ use of numeracy skills at work across all participating countries and economies, and much less than that for other information-processing skills.
With other covariates of engagement in numeracy held constant, the average student, worker, unemployed or inactive respondent all use numeracy more intensively if they have attained a tertiary rather than an upper secondary qualification. The reverse is true for being older and unemployed or inactive, and for lacking upper secondary education. These associations hold for students as well, with the exception of those who have not (yet) attained an upper secondary qualification, who engage in numeracy more intensively than upper secondary graduates, if other factors are held constant.
A large part of the variation in use of numeracy practices is explained by a worker’s occupation, and by the human resource practices adopted in the workplace. High-performance work practices in particular – including work organisation and management practices – explain between 15% and 24% of the variation in skills use across individuals, the most significant of the considered factors. This is in line with countries’ efforts to promote better skills use through innovation on the workplace, e.g. through training, of which high-performance work practices are catalysts.
References
[8] Bloom, N. and J. Van Reenen (2010), “Why do management practices differ across firms and countries?”, Journal of Economic Perspectives, Vol. 24/1, pp. 203-224, https://doi.org/10.1257/jep.24.1.203.
[6] Braun, H. and M. von Davier (2017), “The use of test scores from large-scale assessment surveys: psychometric and statistical considerations”, Large-scale Assessments in Education, Vol. 5/1, p. 17, https://doi.org/10.1186/s40536-017-0050-x.
[1] Jonas, N. (2018), “Numeracy practices and numeracy skills among adults”, OECD Education Working Papers, No. 177, OECD Publishing, Paris, https://dx.doi.org/10.1787/8f19fc9f-en.
[2] Nedelkoska, L. and G. Quintini (2018), “Automation, skills use and training”, OECD Social, Employment and Migration Working Papers, No. 202, OECD Publishing, Paris, https://dx.doi.org/10.1787/2e2f4eea-en.
[5] OECD (2019), Technical Report of the Survey of Adult Skills, Third Edition, OECD, http://www.oecd.org/skills/piaac/publications/PIAAC_Technical_Report_2019.pdf.
[9] OECD (2016), OECD Employment Outlook 2016, OECD Publishing, Paris, https://doi.org/10.1787/empl_outlook-2016-en (accessed on 17 May 2019).
[4] OECD (2016), Skills Matter: Further Results from the Survey of Adult Skills, OECD Skills Studies, OECD Publishing, Paris, https://dx.doi.org/10.1787/9789264258051-en.
[3] OECD (2013), OECD Skills Outlook 2013: First Results from the Survey of Adult Skills, OECD Publishing, Paris, https://dx.doi.org/10.1787/9789264204256-en.
[7] Paccagnella, M. (2016), “Age, ageing and skills: Results from the Survey of Adult Skills”, OECD Education Working Papers, No. 132, OECD Publishing, Paris, https://dx.doi.org/10.1787/5jm0q1n38lvc-en.
Notes
← 1. Figure 4.3 reproduces Figure 2.3 in Jonas (2018[1]), but including the PIAAC Round 3 countries. As IRT exploits information on the overall sample to define individuals’ and countries’ positions in the distribution, the average values of the index of engagement intensity vary slightly here from those reported in Jonas (2018[1]).
← 2. At the worker level, the correlation of proficiency and skills use is positive and highly significant, independently of whether Latin American countries are included or excluded. The R-squared value also remains of similar magnitude, between 0.2 and 0.3 depending on the specification.
← 3. Other negative gaps are not statistically significant (see Table A4.4).
← 4. The high level of aggregation considered for occupational dummies may influence the magnitude of the reported coefficients, if large differences in skills use exist between more disaggregated occupations within the same 1-digit occupational group.
← 5. The empirical model proposed here is parsimonious in the number of correlates of numeracy engagement. Possible extensions could account for other factors such as features of the employer (size, sector of operation) or other individual characteristics such as experience or family background.
← 6. Contrary to other covariates in the model, proficiency is a continuous variable and not a categorical (“dummy”) one. Ex-ante standardisation allows the magnitude of coefficients to be interpreted in terms of standard deviations of proficiency.
← 7. Being a young adult rather than in the 25-54 year-old age group reflects differently on numeracy engagement at work and in everyday life. These opposite signs were already evident in Figure 4.8.


--42-26274713.png)
