.jpg?a4384ad645a7284c15259ce80248ac2e)
France
Women tend to be under-represented in certain fields of science, technology, engineering and mathematics (STEM) across most OECD countries. France follows this pattern. In 2019, women represented 25% of new entrants in engineering, manufacturing and construction degrees and 18% in information and communication technologies (OECD averages are 26% and 20% respectively for these two fields of study).
Socio-economic status may impact significantly students’ participation in education, particularly at levels of education that rely most heavily on private expenditure, such as pre-primary and tertiary education. France is one of the countries where private spending at these two levels are well below the OECD average (7% in pre-school and 22% in tertiary education compared with the OECD average of 17% and 30%).
In France, the share of NEETs among foreign-born young adults who arrived by the age of 15 in 2020 is 23%, while the share of NEETs among those who arrived at age 16 or later is 30% (the OECD averages are 14% and 22% respectively for these two age groups).
In France, schools closed for less time than in many OECD countries during the COVID-19 crisis. Pre-primary schools were fully closed for an average of 34 days between 1 January 2020 and 20 May 2021. Meanwhile primary schools closed for 34 days, lower secondary for 44 days and upper secondary general1 schools for 49 days. In comparison, respective closures were 55, 78, 92 and 101 days on average across the OECD.
In France, the statutory salaries of teachers with 15 years of experience and the most prevalent qualifications (“professeurs des écoles” or “professeurs certifiés”) stagnated or increased only by 1% between 2010 and 2020 at primary and general lower and upper secondary levels. On average in OECD countries, statutory teacher salaries at these levels have increased over this period by 6-7%. The second part of the period (2015-2020), however, is marked by a 4 percentage points increase in statutory salary, compared to a 3-4 percentage points decline across levels in the first part of the decade (2010-2015).
In France, 1.2% of students in lower secondary education and 4.7% in upper secondary general education repeated a grade in 2019, compared to 1.9% and 3% respectively on average across OECD countries. Since 2000, the overall repetition rate in France has fallen sharply. Boys are more likely to repeat a grade in lower secondary education. In France, 61% of repeaters at lower secondary level in 2019 were boys, the same as the OECD average. In upper secondary general education, the share of boys repeating a grade in France decreases to 56%, compared to 57% on average across OECD countries.
Men are more likely than women to pursue a vocational track in most OECD countries. This is also the case in France, where 53% of upper secondary vocational graduates in 2019 were men (compared to the OECD average of 55%). Women are generally more likely to graduate from upper secondary general programmes. This is also the case in France, where women represent 55% of graduates the same value as on average across OECD countries (Figure 1).
Tertiary education has been expanding in the last decades, and, in 2020, 25-34 year-old women were more likely than men to achieve tertiary education in all OECD countries. In France, 53% of 25-34 year-old women had a tertiary qualification in 2020 compared to 46% of their male peers, while on average across OECD countries the shares were 52% among young women and 39% among young men. Therefore, France is more successful in terms of acquisition of qualifications concerning young people, and has a smaller difference between men and women than the average of OECD countries.
Gender differences in the distribution of tertiary entrants across fields of study are significant. Women tend to be under-represented in certain fields of science, technology, engineering and mathematics (STEM) across most OECD countries. In 2019, women represented 25% of new entrants in engineering, manufacturing and construction degrees and 18% in information and communication technologies in France (OECD averages are 26% and 20% respectively for these two fields of education). In contrast, women represented 76% of new entrants to the field of education and 75% in the health sector, two sectors traditionally dominated by women (see Education at a Glance Database).
In France in 2019, men represented 32% of teachers across all levels of education, compared to 30% on average across OECD countries. However, as in most countries, the proportion of male teachers increases with the level of education. In France, men accounted for 9% of pre-primary teachers (OECD average 4%) and 17% of primary teachers (OECD average 18%), while they made up 40% of lower secondary (OECD average 32%) and upper secondary teachers (OECD average 40%) and 55% of tertiary teachers (OECD average 56%).
Young women are less likely to be employed than young men, particularly those with lower levels of education. In France, only 37% of 25-34 year-old women with below upper secondary attainment were employed in 2020 compared to 66% of men. This gender difference is higher than the average across OECD countries, where 43% of women and 69% of men with below upper secondary attainment are employed. However, France have a slightly lower proportion of women and men who have not attained upper secondary education compared to the OECD average.
In nearly all OECD countries and at all levels of educational attainment, 25-64 year-old women earn less than their male peers: their earnings correspond to 76%-78% of men’s earnings on average across OECD countries. In France, as in most OECD countries, women with tertiary education have lower earnings compared to men with a similar education level. They earn 76% of men’s earnings in 2017, while those with upper secondary or post-secondary non-tertiary education earn 78% as much.
In many OECD countries, early childhood education and care (ECEC) begins for most children well before the age of 5 and, in the interests of social equity, there are universal legal entitlements to a place in ECEC services for at least one or two years before the start of compulsory schooling. Pre-primary education began to be compulsory from the age of 3 in France from the 2019/2020 school year. As a result, 100% of 3-5 year olds in 2019 were enrolled in ECEC (ISCED 0) or for a small proportion of them in primary education, compared to an OECD average of 87%.
Socio-economic status may impact significantly students’ participation in education, particularly at levels of education that rely most heavily on private expenditure, such as pre-primary education and tertiary education. France is one of the countries where private spending at both levels is well below the OECD average. For instance, private sources accounted in 2018 for only 7% of total expenditure in pre-primary institutions, lower than the OECD average of 17%.
Tuition fees in public institutions in France are among the lowest for a bachelor's or master’s programme across countries with available data for school year 2019/2020. National students were charged USD 233 per year for a bachelor's degree and USD 333 per year for a master’s degree. However, non-EU/EEA students in France had to pay much higher tuition fees at both levels: a bachelor's year cost USD 3 792, while a master's year cost USD 5 161 per year. At the doctoral level, the tuition fee was the same for all students and amounted to USD 520.
Financial transfers from the public to the private sector and direct public financial support to students may alleviate the financial burden of education. In France, 34% of students enrolled in tertiary education programmes in school year 2018/2019 received financial support in the form of public grants or scholarships (the 6th highest percentage of the 15 countries/economies for which data were available). In 2018, public-to-private transfers represented 3% of total expenditure on tertiary institutions, lower than the OECD average of 8%. Public-to-private transfers are generally less common at pre-primary level and non-existent in France.
Across most OECD countries, socio-economic status influences learning outcomes more than gender and immigrant status. In France, in the PISA 2018 survey, 35% of low-achieving students (i.e. those performing below level 2 on the test's proficiency scale) in reading literacy were among the very disadvantaged, compared to only 7% among the very advantaged. These proportions are 36% and 11% respectively on average in the OECD-36 (see PISA 2018, Volume I).
Students from lower socio-economic background are more likely to enter upper secondary vocational programmes than general ones. In France, students without any tertiary-educated parent represented 84% of entrants to upper secondary vocational programmes in 2017, compared to 50% among entrants to general programmes.
International and foreign student mobility at tertiary level has risen steadily reaching about 246 400 students in France and representing 9% of tertiary students in 2019. The higher the level of education, the more foreign and international mobile students come to study in France. Of all tertiary education students, 7% are international mobile at bachelor level, 13% at master level and 38% at the doctoral level. Students from lower-income countries are generally less likely to benefit from an experience studying abroad. In 2019, 29% of international students in OECD countries came from low and lower-middle income countries. In contrast, 55% of international students studying in France come from low and lower-middle income countries. The largest share of international tertiary students studying in France in 2019 come from Morocco, Algeria and China with respectively 31 000, 25 000 and 24 000 students.
Large differences in educational attainment may lead to starker earnings inequality in many countries. In France, 34% of 25-64 year-old adults with below upper secondary attainment earn no more than half of the median earnings in 2017.
On average across the OECD, foreign-born adults (25-64 year-olds) account for 22% of all adults with below upper secondary attainment, 14% of those attaining upper secondary or post-secondary non-tertiary attainment, and 18% of tertiary-educated adults in 20202. In France as in most OECD countries, foreign-born adults make up the highest share among all adults having attained below upper secondary education (27% in France). In contrast, they represent only 13% of 25-64 year olds who have attained tertiary education. This result can be partly explained by the fact that France receives more immigrants from low and middle income countries than many OECD countries.
Foreign-born adults with at least an upper secondary qualification have more difficulty finding a job than their native-born peers, as they face various problems, such as the lack of recognition for credentials obtained abroad, lack of skills needed, and language difficulties. For instance, 62% of foreign-born adults with upper secondary qualification in France are employed compared to 74% of native-born adults.
The labour market is also particularly sensitive to diploma, independent of country of origin. On average across OECD countries, among adults without upper secondary attainment, 57% of native-born adults are employed, compared to 61% of foreign-born adults. In France, the employment rate of foreign-born adults without upper secondary attainment was 51% in 2020, slightly lower than that of their native-born peers (54%).
Foreign-born young adults (15-29 year-olds) are also more likely to be neither employed nor in education or training (NEET) than native-born young adults. On average across OECD countries, 19% of foreign-born and 14% of native-born adults are NEET. This pattern is particularly evident in France, where the difference was above 10 percentage points in 2020 (27% compared to 14%).
Early arrival in the country is generally associated with a lower risk of becoming NEET, particularly because those who arrive earlier can benefit from longer access to initial education in the host country. In France, the share of NEETs among foreign-born young adults who arrived by the age of 15 in 2020 is 23%, while the share of NEETs among those who arrived at age 16 or later is 30% (OECD averages are 14% and 22% respectively for these two age groups).
The spread of COVID-19 has continued to impede access to in-person education in many countries around the world in 2021. By mid-May 2021, 37 OECD and partner countries had experienced periods of full school closure since the start of 2020.
The number of instructional days when schools were fully closed since the start of 2020 due to the pandemic (excluding school holidays, public holidays and weekends) varies significantly between countries and increases with the level of education. Even if France follows this pattern, the country was among the countries with the least number of days where schools were fully closed. In France, pre-primary schools were fully closed for an average of 34 days between 1 January 2020 and 20 May 2021. Meanwhile primary schools closed for 34 days, lower secondary for 44 days and upper secondary general schools for 49 days. In comparison, respective closures were 55, 78, 92 and 101 days on average across the OECD (Figure 2).
In many countries, schools did not fully close but remained open with reduced capacity. Schools at upper secondary (general) level in France for instance experienced 21 days of partial opening between January 2020 and May 2021, 5 of which occurred in 2020 and 16 in 2021. In total, this was lower than the number of days of partial opening in the OECD on average (57 days), where there were 27 days of partially open instruction in 2020, and 30 days in 2021. When adding both the number of days where schools were fully and partially closed, learning in upper secondary general education was disrupted by 70 days in France between January 2020 and May 2021 compared to the OECD average of 159 days.
During periods of full school closure in 2020, 21 OECD and partner countries have opted to keep upper secondary general schools virtually open as a national level strategy, including France. The way that online platforms have operated during school closures has varied between countries. In France, a hybrid approach, including a blend of both asynchronous and synchronous online learning, was adopted for all educational levels from primary to upper secondary education.
Countries have faced difficult decisions on how to best manage their resources to ensure that students can continue to access quality education in the safest possible conditions and to minimise disruption to learning. Before the pandemic, total public expenditure on primary, secondary and post-secondary non-tertiary education in France reached 3.5% of gross domestic product (GDP) in 2018, which was higher than the OECD average of 3.2%. In response to the COVID crisis, about two-thirds of OECD and partner countries reported increases in the funding allocated to primary and secondary schools in 2020. Compared to the previous year, French government reported an increase in the fiscal year education budget for primary and lower secondary education in 2020 (data incomplete at this stage).
A number of countries have taken steps to address the learning gaps associated with school closures. For instance, following the first closure in 2020, 78% of countries report having implemented remedial measures to reduce students’ learning gaps, and 70% declare having implemented these measures with a special focus on disadvantaged students. In France, for instance, in a recent national survey, 9.2% of grade 9 students from disadvantaged schools (REP+) reported having benefited from teachers’ support during the March-April 2020 school closures, compared to 5.6% in more advantaged schools (DEPP, 2021[1]). Moreover, a support programme will be implemented at the start of the school year 2021/2022, notably to help upper secondary students with homework. Last, in France, the programme “Vacances Apprenantes” was implemented in 2020 and 2021 to support students that may have been particularly affected by the COVID-19 crisis during summer holidays.
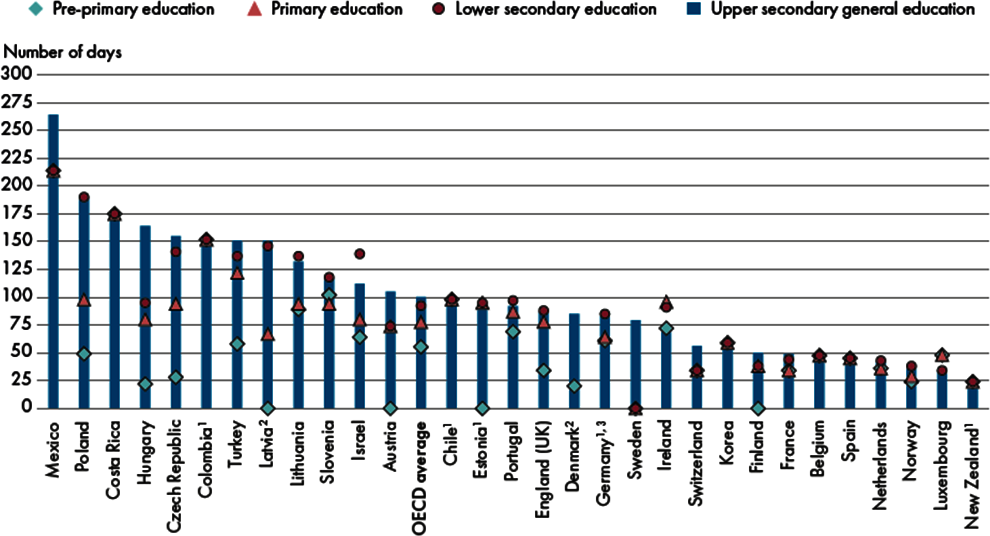
Countries are ranked in descending order of the number of days schools were fully closed in upper secondary education between 1 January 2020 and 20 May 2021.
1. 1. Most typical number of instruction days
2. 2. Minimum number of instruction days in 2020.
3. 3. Different school holiday schedules explain the higher number of instruction days when schools were fully closed at pre-primary compared to primary education.
Source: (OECD/UIS/UNESCO/UNICEF/WB, 2021[2])
More than half of the countries surveyed (60%) in May 2021 reported that teachers had been prioritized as part of their national policy to vaccinate the population against COVID-19. In France, since April 17th, all school staff members aged 55 and plus (teachers, administrators, and support staff) have had access to vaccination in dedicated vaccination centres. The prioritization of all school staff (including those under the age of 55) was implemented on 24 May but ended up being rather short-lived. The national strategy has consisted in prioritizing the most vulnerable people (age groups and people with comorbidities). The school staff had only a week of being prioritized before vaccination was opened up to the general population of the same age group on 31 May, advanced from the original date of 15 June.
The impact of the pandemic on the economy has raised concerns about the prospects of young adults, especially those leaving education earlier than others. In France, the unemployment rate among 25-34 year-olds with below upper secondary attainment was 20% in 2020, a decrease of 4 percentage points from the previous year. However, while having a slightly higher rate than the OECD average, France does not follow the trend of rising unemployment among the low-qualified youth. In the OECD, the youth unemployment rate of 15% in 2020 represented an increase of 2 percentage points from 2019 (Figure 3).
Relative to the same quarter, in 2019, the number of 25-64 year-old adults reporting they participated in formal and/or non-formal education3 and training in the past month dropped significantly in the second quarter of 2020 in all countries with available data. The number of 25-64 year-old adults participating in formal and/or non-formal education and training decreased by 27% on average and by 63% in France over this period, the highest decrease among countries with available data.
On average, the share of 18-24 year-old NEETs in OECD countries rose from 14.4% in 2019 to 16.1% in 2020. In France, the share of 18-24 year-old NEETs was 17.5% in 2019, which stayed the same in 2020.
Annual expenditure per student on educational institutions provides an indication of the investment countries make on each student. In 2018, public expenditure on primary to tertiary educational institutions per full-time student in France was USD 10 807 compared to USD 10 000 on average across OECD countries.
In France, spending per student at the non-tertiary level (primary, secondary and post-secondary non-tertiary education) was USD 11 201 in 2018, slightly higher than the OECD average of USD 10 454. In the same year, France had a clear gap in the distribution of education expenditure per student between primary and secondary education (to the advantage of secondary education). In France, expenditure per student is 3% higher than the OECD average in lower secondary education (equivalent to collège, USD 11 438 compared to USD 11 091), and 30% higher in upper secondary education (including lycées d'enseignement général or agricole and apprenticeships in centres de formation en alternance (CFA), USD 15 107 compared to USD 11 590). In contrast, it is 9% lower than the OECD average for primary education (USD 8 724 compared to USD 9 550)4. At tertiary level, France invested USD 17 420 per student, slightly above the OECD average of USD 17 065.
Expenditure on core educational services such as instruction and teaching make up the largest share of education expenditure. However, ancillary services (such as student welfare) and research and development (R&D) activities also influence the level of expenditure per student. In primary to tertiary education, 81% of institutions’ expenditure per student in 2018 is devoted to core educational services (compared to 89% on average across OECD countries). This share is generally lower at the tertiary level, including in France where 65% of total expenditure is devoted to core educational services (compared to 68% on average across OECD countries).
The allocation of resources between levels of education and types of institutions is linked to the balance between the public and private sectors. Expenditure per student on public educational institutions is slightly higher than on private educational institutions on average across OECD countries. This is also the case in France in 2018, where total expenditure on primary to tertiary public institutions amounts to USD 12 982 per student, compared to USD 10 339 on private ones.
Between 2012 and 2018, spending per student from primary to tertiary education increased by an average of 1.6% per year in OECD countries compared to only 0.3% in France. This difference is explained by the fact that expenditure on educational institutions in France increased at an average rate of 1.1% per year (OECD average: 1.7%), while the number of students increased over the same period at an average rate of 0.8% per year (OECD average: 0.1%).
The share of national wealth devoted to educational institutions is higher in France than on average among OECD countries. In 2018, France spent 5.2% of its GDP on primary to tertiary educational institutions, which is 0.3 percentage points higher than the OECD average. Across levels of education, France devoted an above-average share of GDP at non-tertiary levels and a slightly above-average share at tertiary level (Figure 4).
Capital costs represent a lower-than-average share of expenditure on primary to tertiary institutions in France. At primary, secondary and post-secondary non-tertiary level, capital costs accounted in 2018 for 8% of total spending on educational institutions, similar to the OECD average (8%). At the tertiary level, capital costs represent 8%, lower than the average across OECD countries of 11%.
Compensation of teachers and other staff employed in educational institutions represents the largest share of current expenditure from primary to tertiary education. In 2018, France allocated 80% of its current expenditure to staff compensation, compared to 74% on average across OECD countries. A significant proportion of this expenditure in primary, secondary and post-secondary non-tertiary education (ISCED 1 to 4) in France is devoted to non-teaching staff (22% compared to 15% for the EU22).
Staff compensation tends to make up a smaller share of current expenditure on tertiary institutions due to the higher costs of facilities and equipment at this level. In France, staff compensation represents 80% of current expenditure on tertiary institutions compared to 81% at non-tertiary levels. On average across OECD countries, the share is 68% at tertiary level and 77% at non-tertiary level.
The salaries of school staff, and in particular teachers and school heads, represent the largest single expenditure in formal education. Their salary levels also have an impact on the attractiveness of the teaching profession. In most OECD countries and economies, statutory salaries of teachers (and school heads) in public educational institutions increase with the level of education they teach, and also with qualification and experience. On average, statutory salaries of teachers with maximum qualifications at the top of their salary scales (maximum salaries) in school year 2019/2020 (2020) were between 86% and 91% higher than those of teachers with the minimum qualifications at the start of their career (minimum salaries) at pre-primary (ISCED 02), primary and general lower and upper secondary levels in 2020. In France, maximum salaries were 76% to 108% higher than minimum salaries at each level of education in 2020. However, it should be noted that the secondary school teachers compared here are not the same5.
In France, salary progression for teachers at the beginning of their careers is slow. In this context, mid-career teachers are particularly disadvantaged: according to official pay scales at the start of the 2019/2020 school year (2020), the statutory salary of primary and secondary teachers after ten or fifteen years of service is at least 15% lower than the OECD average. By comparison, the difference with the OECD average is between 4 and 9% depending on the level at the very beginning of the career. However, a catching up occurs in the second half of the career. For example, the statutory salary at the end of the career of primary school teachers in France is 76% higher than the statutory salary of teachers at the beginning of their career (the OECD average is 66%).
Between 2010 and 2020, the statutory salaries of teachers with 15 years of experience and the most prevalent qualifications (“professeurs des écoles” or “enseignants certifiés”) increased between 6% and 7% at primary and general lower and upper secondary levels, on average across OECD countries. In France, teachers’ statutory salaries at these levels stagnated or increased by 1%. The second part of the period (2015-2020), however, is marked by a 4 percentage points increase in statutory salary, compared to a 3-4 percentage points decline across levels in the first part of the decade (2010-2015).
Teachers’ actual salaries in school year 2019/2020 (2020)6 reflect their statutory salaries and additional work-related payments. Average actual salaries also depend on the characteristics of the teaching population such as their age, level of experience and qualification level. In France, teachers’ average actual salaries among 25-64 year-old teachers amount to USD 43 978 at the pre-primary level, USD 42 837 at the primary level, USD 48 310 at the general lower secondary level and USD 54 186 at the general upper secondary level. On average across OECD countries, teachers’ average actual salaries were USD 40 707, USD 45 687, USD 47 988 and USD 51 749 at the pre-primary, primary, lower secondary and upper secondary level respectively (Figure 5 for lower secondary education).
Teachers’ average actual salaries in school year 2019/2020 (2020) remained lower than those of tertiary-educated workers in almost all countries, and at every level below upper secondary education. Teachers’ average actual salaries at pre-primary, primary and general secondary levels of education are between 81% and 96% of the earnings of tertiary-educated workers on average across OECD countries and economies. In France, the proportion ranged from 78% in primary education, up to 99% in upper secondary general education.
However, there are significant differences in relative salaries of teachers between men and women due to the gender gap in earnings on the labour market (statutory salaries are equal for male and female teachers in public educational institutions). Compared to salaries of tertiary educated workers (25-64 year-olds), average actual salaries of teachers in 2020 are higher for women, and lower for men. In France, the proportion ranges from 90% to 113% for women (98% to 110% on average across OECD countries and economies), and from 73% to 90% for men (76% to 85% on average across OECD countries and economies) in primary and general secondary education.
The average number of teaching hours per year required of a typical teacher in public educational institutions in OECD countries tends to decrease as the level of education increases: it ranged from 989 hours at pre-primary level, to 791 hours at primary level, 723 hours at lower secondary level (general programmes) and 685 hours at upper secondary level (general programmes) in 2020. In France, teachers are required to teach 900 hours per year at pre-primary and primary levels for the “professeurs des écoles”, 720 hours at lower and upper secondary levels (general programmes) for the “professeurs certifies”.
During their working time, teachers also perform various non-teaching tasks such as lesson planning and preparation, marking students’ work and communicating or co-operating with parents or guardians. At the lower secondary level, teachers in France spend 45% of their statutory working time on teaching in 2020, compared to 44% on average among countries with available data.
In primary and secondary education, about 35% of teachers on average across OECD countries will reach retirement age in the next decade, while the size of the school-age population is projected to increase in some countries, putting many governments under pressure to recruit and train new teachers. Teachers are relatively younger in France than in many OECD countries. In 2019, 33% of primary teachers on average across OECD countries were at least 50 years old, which was higher than the 23% in France. On average across OECD countries, the proportion of teachers aged at least 50 years old increases with higher levels of education taught, to 36% in lower secondary education (33% in France) and 40% in upper secondary education (33% in France).
Attracting, retaining and developing quality school heads is essential for improving the quality of learning environments. School heads have different statuses in France. Indeed, primary school heads are teachers; they have less autonomy/responsibility and are paid on the salary scales of teachers, whereas secondary school heads, who pass a specific competitive examination, are paid on the specific scales of management staff. However, it should be noted that the status of school heads is currently the subject of a reform being debated in Parliament. In terms of figures, school heads in France in 2018 aged 25-64 received an actual salary that was almost 30% lower than that of school heads in lower secondary education (USD 55 378 per year as opposed to USD 73 172).
References
DEPP (2021), Dispositif d’évaluation des conséquences de la crise sanitaire : comment les élèves
ont-ils vécu le confinement de mars-avril 2020 ?, note d’information n°21.19, https://www.education.gouv.fr/dispositif-d-evaluation-des-consequences-de-la-crise-sanitaire-comment-les-eleves-ont-ils-vecu-le-322830
OECD (2021), “Regional education”, OECD Regional Statistics (database), https://dx.doi.org/10.1787/213e806c-en (accessed on 27 July 2021).
OECD (2020), Education at a Glance 2020: OECD Indicators, OECD Publishing, Paris, https://dx.doi.org/10.1787/69096873-en.
For more information on Education at a Glance 2021 and to access the full set of Indicators, see: https://doi.org/10.1787/b35a14e5-en
For more information on the methodology used during the data collection for each indicator, the references to the sources and the specific notes for each country, see Annex 3 (https://www.oecd.org/education/education-at-a-glance/EAG2021_Annex3.pdf).
For general information on the methodology, please refer to the OECD Handbook for Internationally Comparative Education Statistics: Concepts, Standards, Definitions and Classifications (https://doi.org/10.1787/9789264304444-en).
Updated data can be found on line at https://doi.org/10.1787/eag-data-en and by following the StatLinks 2under the tables and charts in the publication.
Data on subnational regions for selected indicators are available in the OECD Regional Statistics (database) (OECD, 2021). When interpreting the results on subnational entities, readers should take into account that the population size of subnational entities can vary widely within countries. Also, regional disparities tend to be higher when more subnational entities are used in the analysis.
Explore, compare and visualise more data and analysis using the Education GPS:
https://gpseducation.oecd.org/
The data on educational responses during COVID-19 were collected and processed by the OECD based on the Survey on Joint National Responses to COVID-19 School Closures, a collaborative effort conducted by the United Nations Educational, Scientific and Cultural Organization (UNESCO); the UNESCO Institute for Statistics (UIS); the United Nations Children's Fund (UNICEF); the World Bank; and the OECD.
This work is published under the responsibility of the Secretary-General of the OECD. The opinions expressed and arguments employed herein do not necessarily reflect the official views of OECD member countries.
This document, as well as any data and any map included herein, are without prejudice to the status of or sovereignty over any territory, to the delimitation of international frontiers and boundaries and to the name of any territory, city or area.
The statistical data for Israel are supplied by and under the responsibility of the relevant Israeli authorities. The use of such data by the OECD is without prejudice to the status of the Golan Heights, East Jerusalem and Israeli settlements in the West Bank under the terms of international law.
The use of this work, whether digital or print, is governed by the terms and conditions to be found at www.oecd.org/termsandconditions/.
← 1. General programmes in France include the general and technological pathways.
← 2. It should be underlined that the level of attainment of foreign-born adults is not entirely imputable to the receiving country.
← 3. It should be noted that, given the age of the observed population, individuals are more likely to participate to non-formal than formal education in most OECD countries.
← 4. These figures take into account the reforms of the 2017/2018 school year, notably the doubling of CP and CE1 classes in priority education. However, it should be pointed out that the reform of the doubling of classes follows a timetable spread over three years; the 2018 expenditure therefore only captures one phase of the reform.
← 5. In secondary education, teachers are, on the one hand, “professeurs certifies” and, on the other, « professeurs agrégés”, who do not have the same salary scales and do not represent the same weight in the teaching population. Thus, the salary corresponding to the minimum qualification or the most typical qualification in secondary education (collège and lycée) is that of certified teachers, while the salary corresponding to the maximum qualification is that of agrégés teachers. More information on the methodology for calculating teachers' salaries can be found in Box 1 of the Education at a Glance 2020 French Country Note.
← 6. The data on the actual salaries of teachers and school heads in France are based on the year 2018 instead of 2020.