
Employment in general government
The COVID-19 pandemic has highlighted the important role played by public employees in delivering essential services, keeping citizens healthy, safe and economically supported. Public employees are also central actors in the recovery that is taking shape, whether they are delivering vaccination strategies or designing and implementing plans for the recovery of economy and society. However, the roles and functions of the public sector relative to other sectors vary across OECD countries, affecting the relative size of public employment. Governments decide which services should be delivered directly through public organisations, or through various forms of partnerships with the private or not-for-profit sectors. For example, in some countries, the large majority of health care providers, teachers and emergency workers are directly employed by the government. In others, these workers are mainly employed by private or non-profit organisations.
The size of general government employment varies significantly among OECD countries. Nordic countries such as Norway, Sweden and Denmark report the highest levels of general government employment, reaching close to 30% of total employment. In contrast, Japan and Korea report the lowest levels among OECD countries, with general government employment making up only 6% of total employment in Japan and 8% in Korea. Despite the 2007-08 financial crisis and the austerity measures that followed, the share of general government employment has remained relatively stable since 2007, falling from 18.2% of total employment in 2007 to 17.9% in 2019. The largest falls have been in the United Kingdom and Israel where the share of general government employment fell by 3 p.p. between 2007 and 2019. However the share increased in Spain (2.1 p.p.), Estonia (2 p.p.), Mexico (1.3 p.p.), Slovenia (1.2 p.p.), Luxembourg (1 p.p.) and Norway (1.1 p.p.) over the same period (Figure 3.1).
Between 2007 and 2019, general government employment grew in 23 OECD countries. On average across OECD countries, total employment growth has been slightly outgrowing that of general government employment, reducing the share of general government employment by 0.3 p.p. over this period. The gap has widened the most in the United Kingdom and Israel. In the United Kingdom this has been due to a decline of general government employment of 0.6% per year on average at the same time as total employment surged by an average of 0.9% per year. In Israel it is the result of booming total employment (growing by 2.6% per year). Only 10 OECD countries have seen general government employment grow faster than total employment, with the greatest differences recorded in Spain (where the difference was 1.24 p.p.), Mexico (0.94 p.p) and Luxembourg (0.88 p.p) (Figure 3.2).
Data are derived from the OECD National Accounts Statistics (database), which are based on the System of National Accounts (SNA), a set of internationally agreed concepts, definitions, classifications and rules for national accounting. General government employment covers employment in all levels of government (central, state, local and social security funds) and includes core ministries, agencies, departments and non-profit institutions that are controlled by public authorities. The data represent the total number of persons directly employed by those institutions. Total employment covers all persons engaged in productive activity that falls within the production boundary of the national accounts. The employed comprise all individuals who, during a specified brief period, were in either paid employment or self-employment.
Further reading
OECD (2019), Recommendation of the Council on Public Service Leadership and Capability, OECD, https://legalinstruments.oecd.org/%20en/instruments/OECD-LEGAL-0445.
OECD (2017), Skills for a High Performing Civil Service, OECD Public Governance Reviews, OECD Publishing, Paris, https://doi.org/10.1787/9789264280724-en.
OECD (2016), Engaging Public Employees for a High-Performing Civil Service, OECD Public Governance Reviews, OECD Publishing, Paris, https://doi.org/10.1787/9789264267190-en.
Figure notes
3.1. Total employment refers to domestic employment. Data for Australia, Chile, Colombia and New Zealand are not available. Data for Korea and Switzerland are not included in the OECD average due to missing time series. Data for Luxembourg, Norway and Switzerland are for 2018 rather than 2019. Data for Japan are for 2017 rather than 2019. Data for Iceland and the United States are for 2008 rather than 2007.
3.2. Data for Australia, Chile, Colombia Korea, New Zealand and Switzerland are not available. Data for Luxembourg, Norway and Switzerland are for 2007-18 rather than 2007-19. Data for Japan are for 2007-17 rather than 2007-19. Data for Iceland and the United States are for 2008-19 rather than 2007-19.
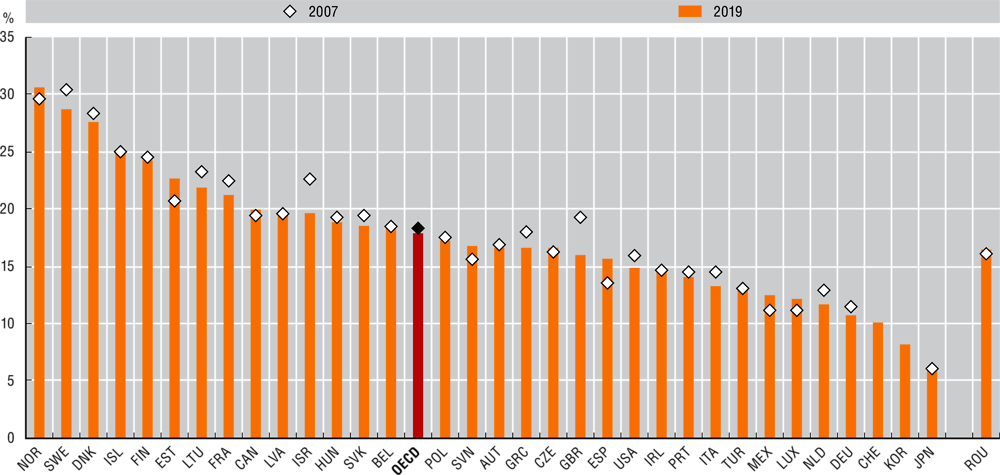
Source: OECD National Accounts Statistics (database). Data for Iceland, Japan, Korea, Mexico, Switzerland, Turkey and the United States are from the International Labour Organization (ILO), ILOSTAT (database), Public employment by sectors and sub-sectors of national accounts.
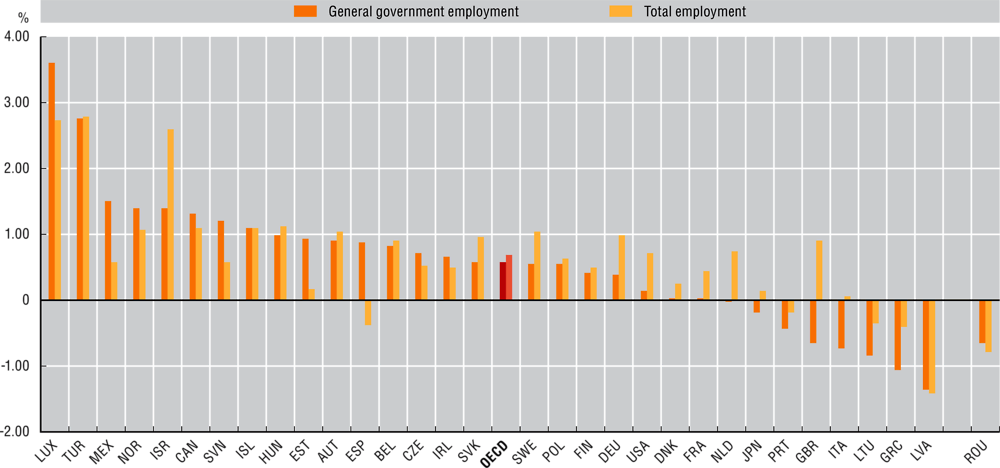
Source: OECD National Accounts Statistics (database). Data for Iceland, Japan, Mexico, Turkey and the United States are from the International Labour Organization (ILO), ILOSTAT (database), Public employment by sectors and sub-sectors of national accounts.