Family
The living arrangements of children are important as they can influence their welfare and poverty rates. Across OECD countries, most children live in households with two parents (Figure 4.10). Rates vary across counties, from less than 70% in Latvia and the United States to as high as 90% in Turkey and Greece. Most remaining children live with a single parent, rather than without parents. With 28%, Latvia has the highest proportion of children living with a single parent. Rates are also high in Belgium, Lithuania, the United Kingdom and the United States, where around one in four children live with a single parent.
Among children living with two parents, the majority has married parents rather than cohabiting parents. In Greece, Germany, Italy, Lithuania, Luxembourg, the Slovak Republic, Spain, Switzerland and the United States, less than 10% of all children live with cohabiting parents. In Estonia, Iceland, Slovenia and Sweden, more than 25% of all children live with cohabiting parents. However, even in these countries, the most common arrangement by far is still “living with two married parents”. Over the last decade, the share of children living with cohabiting couples has been increasing in most countries (OECD, 2018).
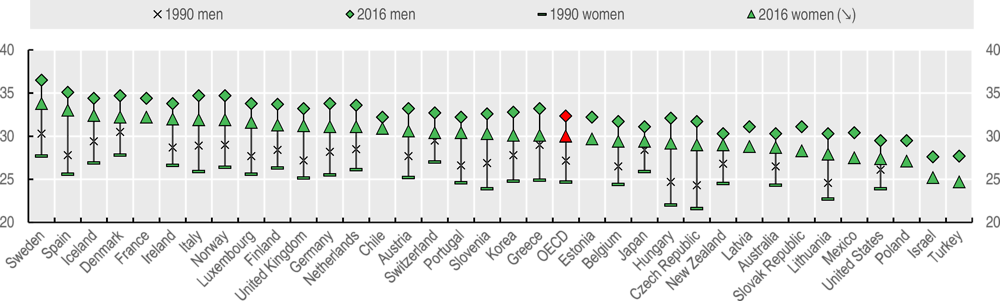
Across the OECD, the average age at which people get married has significantly increased (Figure 4.11). At the start of the 1990s, the average age at first marriage across OECD countries was 25 for women and 27 for men. By 2016, this average age has increased to 30 for women and to 32 for men. Despite common declining trends in increasing ages at first marriage, there remain notable differences between countries. The average age is very high in the Nordic countries. In Israel and Turkey, by contrast, the average age at first marriage is around 25 for women and less than 28 for men. The difference between countries points to a variety of transition paths towards the formation of long-term partnerships: cohabitation has become an important form of long-term partnership in, for example, the Nordic countries, where people are postponing and frequently replacing marriage as the partnership standard.
Higher ages of marriage are accompanied by declining marriage rates and stabilising divorce rates. In 2016, crude marriage rates were between 3.5 and 7 marriages per 1 000, with the OECD average standing at 4.8 (Figure 4.12). Rates are very low in Italy, Luxembourg, Portugal and Slovenia at 3.5 or fewer marriages per 1 000 people, while rates are at least twice as high in Lithuania, Turkey and the United States. Marriage rates are even higher in the Russian Federation (8.5 per 1 000) and China (9.6 per 1 000). In contrast, in 1990, most OECD countries had a marriage rate of five to eight marriages per 1 000 people. Only Sweden and Turkey experienced an increase in marriage rates between 1990 and 2016. Crude divorce rates also vary across countries, from as low as 0.1 divorces per 1 000 people in Chile to above 3 per 1 000 in Latvia, Lithuania and the United States in 2016. Between 1990 and 2014, the picture was mixed: the rates increased in 20 OECD countries but decreased in 16 others. Decline was most pronounced in the United States, from 4.8 divorces per 1 000 in 1992 to 3.2 in 2016, while increase was highest in Spain, from 0.6 divorces per 1 000 in 1990 to 2.1 in 2016.
In January 2019, marriage among persons of same sex was legalised in 20 OECD countries (Figure 1.8). Data on same-sex marriages/divorces are not yet available across all those countries. In France in 2018, 3% of weddings were among persons of same sex, being equally shared among female and male same-sex couples (INSEE, 2019).
The distribution of children (aged 0-17) is categorised according to the presence and marital status of parents in the household, as follows:
-
Living with two parents, where the child lives primarily in a household with two adults that are reported as “parents” of the child. For European countries and a few non-European OECD countries, data allow for further disaggregation between those that live with two married parents and those that live with two cohabiting parents. For European countries, “married parents” in principle includes parents in registered partnerships, although actual practice may vary from country to country.
-
Living with a single parent, where the child lives primarily in a household with only one adult that is reported as a “parent”.
-
Other, where the child lives primarily in a household where no adult is considered a parent.
The mean age at first marriage is defined as the mean average age in years of marrying persons at the time of first marriage. This measure is disaggregated by sex with separate averages for men and women.
The crude marriage rate is defined as the number of legal civil unions or marriages each year per 1 000 people. The crude divorce rate, defined as the number of marriages that are dissolved each year per 1 000 people.
Further reading
OECD (2018), Family Database, http://oe.cd/fdb.
INSEE (2019), Bilan Démographique 2018, Insee Première n° 1730, www.insee.fr/fr/statistiques/3692693.
Figure notes
Figure 4.10: For Japan and Mexico, children aged 0-14. Data for Mexico refer to 2010, for Australia to 2012, for Japan and Turkey to 2015, and for Croatia, France, Germany, Iceland, Ireland, Luxembourg, Norway, Portugal, the Slovak Republic, Switzerland and the United Kingdom refer to 2016.
Figure 4.11: For 2016, data for Belgium refer to 2010, for Iceland and Malta to 2011, for Austria to 2012, for Mexico to 2014, and for Chile, France, Ireland, Israel, and the United Kingdom to 2015. Data for Mexico refer to all marriages rather than first marriages, and for Australia, New Zealand and the United States to median age at first marriage, rather than mean age at first marriage. Data for New Zealand include civil unions.
Figure 4.12: see Statlink for specific years.

Source: OECD Family Database – Indicator SF2.1 – based from national statistical offices and Eurostat, http://oe.cd/fdb.
Source: OECD Family Database – Indicator SF3.1 – based from national statistical offices and Eurostat, http://oe.cd/fdb.

Source: OECD Family Database – Indicator SF3.1 – based from national statistical offices and Eurostat, http://oe.cd/fdb.