
2. Trends of climate finance for adaptation in developing countries
This chapter reviews overall trends in adaptation finance flows between 2016 and 2021, including differences across country income groups in volume, delivery channels and instruments, setting the stage for discussions in Chapters 3 and 4 of challenges and opportunities to scale up adaptation finance. International public climate finance for adaptation from developed countries almost tripled over 2016-21, mainly driven by multilateral institutions’ increased focus on adaptation. Low-income and least developed countries, however, received the least public adaptation finance overall in absolute terms. Despite the strong context-specific nature of adaptation, little of the finance provided is delivered through local organisations. The analysis in this chapter suggests there is room to scale up adaptation finance, improve its accessibility and effectiveness, including towards mobilising private finance.
OECD data on climate finance provided and mobilised by developed countries in the context of the USD 100 billion goal allows for a disaggregated analysis of trends. The analysis in this chapter is based on the data and accounting methodology that underpin the OECD series that assesses progress towards that goal, Climate Finance and the USD 100 Billion Goal.1 Where relevant, the analysis makes use of the OECD Development Assistance Committee (DAC) climate-related development finance database, i.e. development finance Rio-marked for adaptation (see Box 1.2 for further detail) (OECD, 2022[1]; OECD, 2023[2]).2
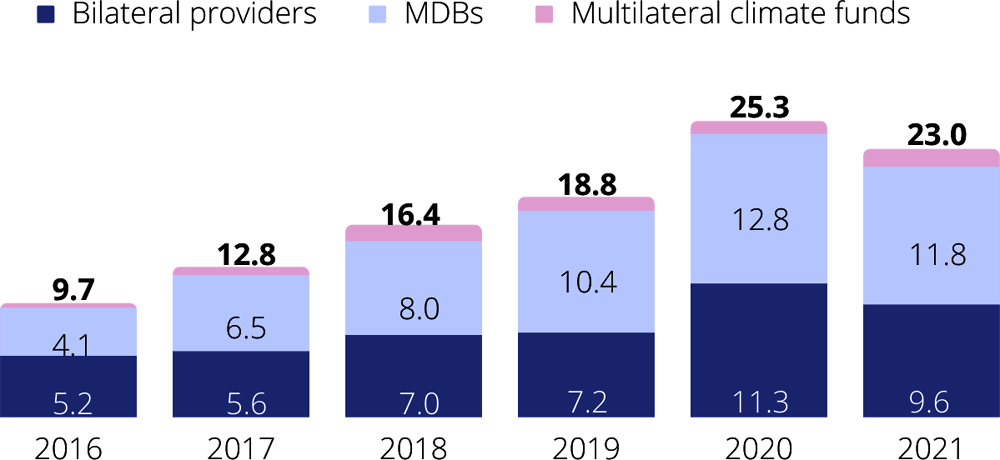
Between 2016 and 2021, bilateral and multilateral providers, including both multilateral development banks (MDBs) and climate funds, together provided USD 106 billion of climate finance for adaptation in developing countries, i.e., an annual average of USD 17.7 billion (Figure 2.1). International public climate finance for adaptation from developed countries almost tripled between 2016 and 2020, from USD 9.7 billion to 25.4 billion; it slightly dropped in 2021 to USD 23 billion. The growth in adaptation finance over the years was mainly driven by an increase in multilateral public climate finance for adaptation. Among bilateral providers, Group of Seven countries and European Union (EU) institutions 3 collectively accounted for 89% of total bilateral climate finance for adaptation in 2016-21. MDBs provided 89% of multilateral climate finance for adaptation, with multilateral climate funds providing the remaining 11%.
In addition to climate finance flows for adaptation, a total of USD 40.2 billion (an annual average of USD 6.7 billion) was provided for cross-cutting activities between 2016 and 2021. Climate finance reported as cross-cutting relates to projects with both mitigation and adaptation benefits or to climate finance that had not been allocated to either mitigation and/or adaptation at the time it was reported. This includes, for example, capacity development grants that the recipient had not yet decided how to use. The share of cross-cutting finance from MDBs progressively decreased over the five years but was relatively high compared with the proportion of cross-cutting finance from bilateral providers and multilateral climate funds. This difference is likely due to their different methodological and reporting practices, which can have an impact on the volumes and thematic split of reported climate finance. Greater mainstreaming of adaptation considerations into mitigation activities contributes to high volumes of cross-cutting in climate finance. Though cross-cutting climate finance is relevant for adaptation activities, the rest of the disaggregated analysis presented in the remainder of this section focuses on what is reported as purely climate finance for adaptation.
Source: Based on Biennial Reports to the UNFCCC, OECD DAC statistics, complementary reporting to the OECD.
2.1.1. Most climate finance provided by most providers focused on mitigation rather than adaptation
Only 13 of 62 international providers of climate finance allocated 50% or more of their total public climate finance portfolio to adaptation between 2016 and 2021 (see Figure 2.2). Another 16 providers allocated between 30 and 49% of their climate finance to adaptation, and 20 providers allocated between 10 and 29%. The remaining 13 allocated less than 10% of their total public climate finance to adaptation. Moreover, 17 providers decreased the share of adaptation in their climate finance portfolios between 2016 and 2021. However, all in all, since most of the biggest providers increased their share, the total adaptation share across providers increased from 21% to 31%.
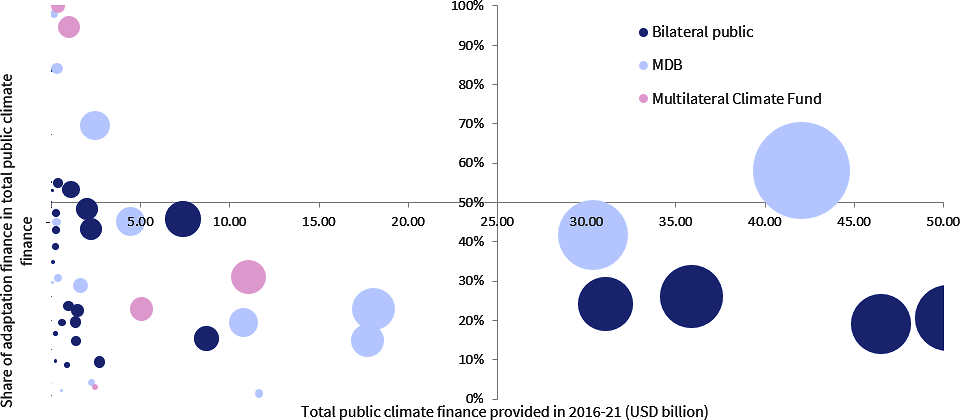
Note: Each bubble represents a bilateral or multilateral provider of adaptation finance. The size of the bubble indicates the relative volume of total adaptation finance provided by the provider between 2016 and 2021.
Source: Based on Biennial Reports to the UNFCCC, OECD DAC statistics, complementary reporting to the OECD.
The split in the climate theme of providers’ portfolios largely reflects the finding that climate finance for mitigation historically accounted for most of public climate finance provided (OECD, 2022[1]). Even though the proportion of climate finance for adaptation grew over the five years, mitigation-related finance remained predominant, averaging 60% over the period.
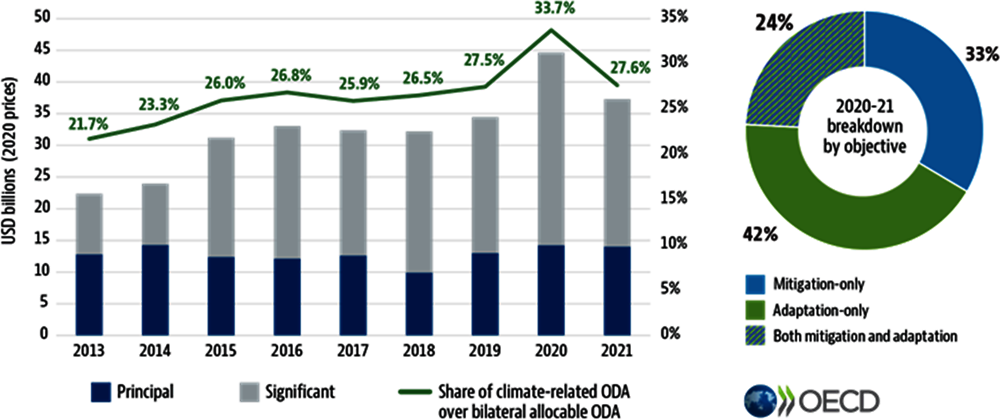
Climate-related development finance provided by bilateral sources, on the other hand, has shifted more definitively towards adaptation-related finance. In 2020, the volume of bilateral official development assistance (ODA) with adaptation objectives exceeded that of mitigation-related bilateral ODA (see Box 2.1). This shift speaks to an increasing trend in development finance to integrate adaptation considerations in projects with broader development goals. As noted in Chapter 1, adaptation finance in developing countries is often delivered as a component of development finance due to the strong links and complementarity between adaptation and development.
Bilateral adaptation-related ODA reached USD 27 billion in 2021, according to data provided by OECD DAC members. This marked a decrease from the USD 30 billion reported in 2020 but an increase over the 2019 volume of USD 20 billion. Of all climate-related finance in 2020-21, 42% addressed adaptation, 33% addressed mitigation and 24% addressed both objectives. Volumes of bilateral ODA with adaptation objectives surpassed mitigation-related bilateral ODA for the first time in 2020 (Figure 2.3).
Bilateral climate-related ODA figures differ from the bilateral climate finance published in the OECD reports tracking progress towards the USD 100 billion goal. Figures for climate-related ODA are higher than for climate finance because the former account for the full value of a contribution targeting adaptation and do not apply coefficients to weight the adaptation-specific value of the activity.
Note: Box 1.2 provides context and further explanation of the accounting approach used.
Source: OECD (2023[2]), Creditor Reporting System: Aid activities targeting Global Environmental Objectives, https://doi.org/10.1787/9c778247-en
2.1.2. Climate finance for adaptation is concentrated in three sectors and mainly provided through loans
Between 2016 and 2021, half of public climate finance for adaptation was concentrated in three sectors: water supply and sanitation (21%), agriculture (19%), and transport and storage (10%). Another 6% went to a fourth sector, disaster preparedness. The remaining 44% was distributed across other sectors as shown in Figure 2.4. This sectoral distribution largely tracks the findings of World Bank and Climate Policy Initiatives analyses of largest identified needs presented in section 1.4.1. In some of the four main sectors, climate finance for adaptation is part of broader development finance projects, as further explored in Box 2.2.
Loans were the most frequently used instrument in all main sectors, accounting for 71% of climate finance for adaptation in water supply and sanitation, 59% in agriculture, 84% in transport and storage, and 78% in disaster preparedness. Grants were the most frequently used instrument in smaller sectors, accounting for 95% of public climate finance in emergency response, 85% in development food assistance, 65% in and general environment protection (65%). The use of equity instruments was insignificant in all sectors over the period.
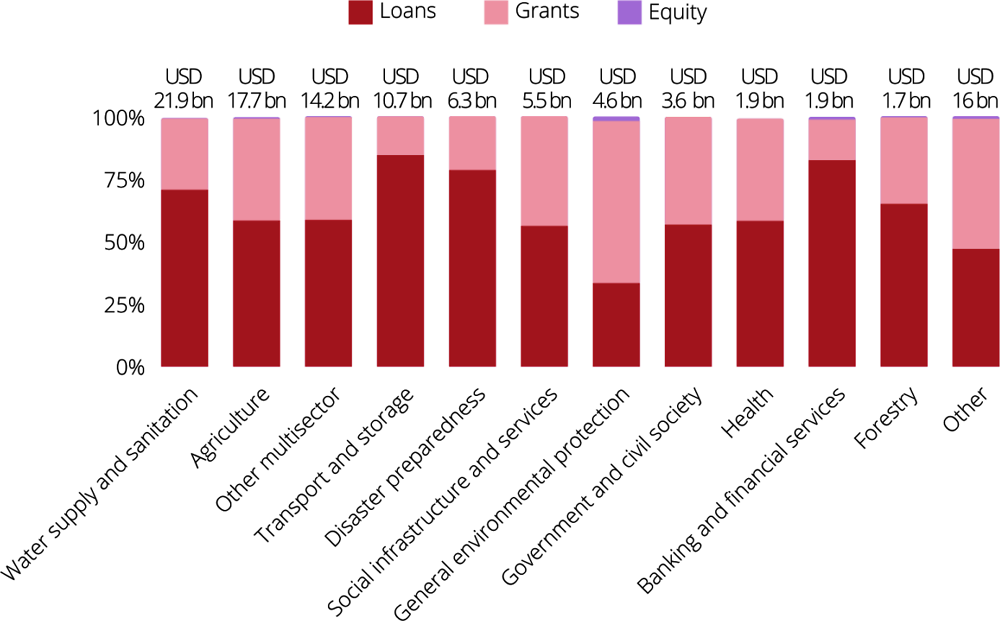
Note: About 13% of total public adaptation finance targeted the “other multisector” category, due to the cross-cutting nature of adaptation support.
Source: Based on Biennial Reports to the UNFCCC, OECD DAC statistics, complementary reporting to the OECD.
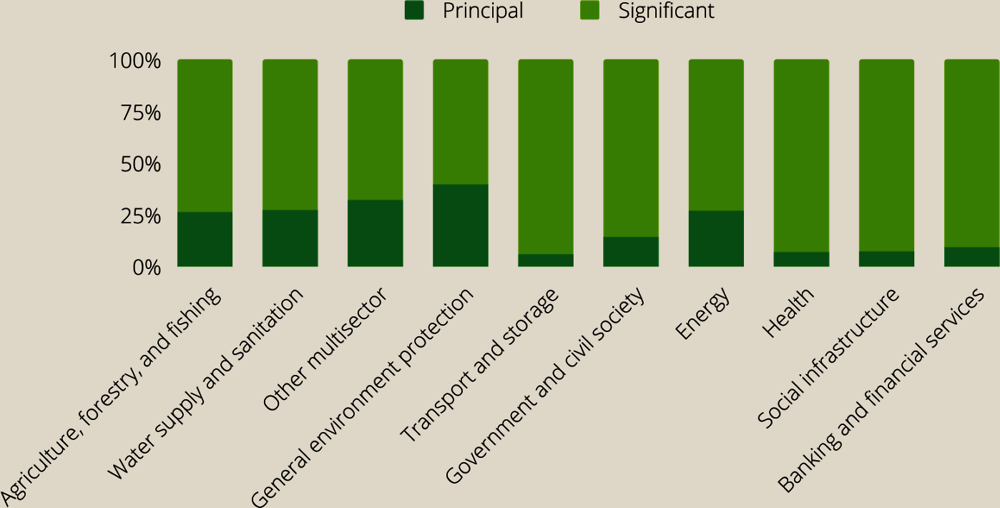
Over 2016-20, 27% of bilateral adaptation climate-related development finance from DAC members was marked as having a “principal” (i.e., main) adaptation objective and 73% was marked as having adaptation as a “significant” objective. By comparison, 44% of mitigation-related development finance over this period was marked as having mitigation as a principal objective, showing that adaptation finance is often mainstreamed into development activities. (Box 1.2 provides additional context and explanations of Rio markers.)
The share of climate-related development finance with adaptation as a principal or significant objective varied greatly across sectors over the 2016-20 period (Figure 2.5). For example, an above-average share of finance was marked as principal in the sectors of disaster prevention and preparedness (52%), reconstruction relief and rehabilitation (48%) and general environment protection (48%). In all other sectors, however, most adaptation-related development finance is marked as significant, suggesting that adaptation finance focuses on aligning development with resilience rather than on stand-alone adaptation projects. In the two biggest sectors of adaptation-related development finance, the share of finance marked as principal was close to the average at 27% in agriculture, forestry and fishing and 28% in water supply and sanitation.
In some major sectors, adaptation is already widely mainstreamed into development finance. In agriculture, forestry, and fishing, 91% of official development finance went to projects with an adaptation marker; the share was 93% in water supply and sanitation, and 85% in general environmental protection. A much lower share went to such projects in other important sectors of adaptation-related development finance such as transport and storage (21%) and energy (15%), suggesting there is potential for further mainstreaming in these sectors.
Source: OECD (2023[2]), Creditor Reporting System: Aid activities targeting Global Environmental Objectives, https://doi.org/10.1787/9c778247-en
2.1.3. Middle-income countries received the most international public climate finance for adaptation
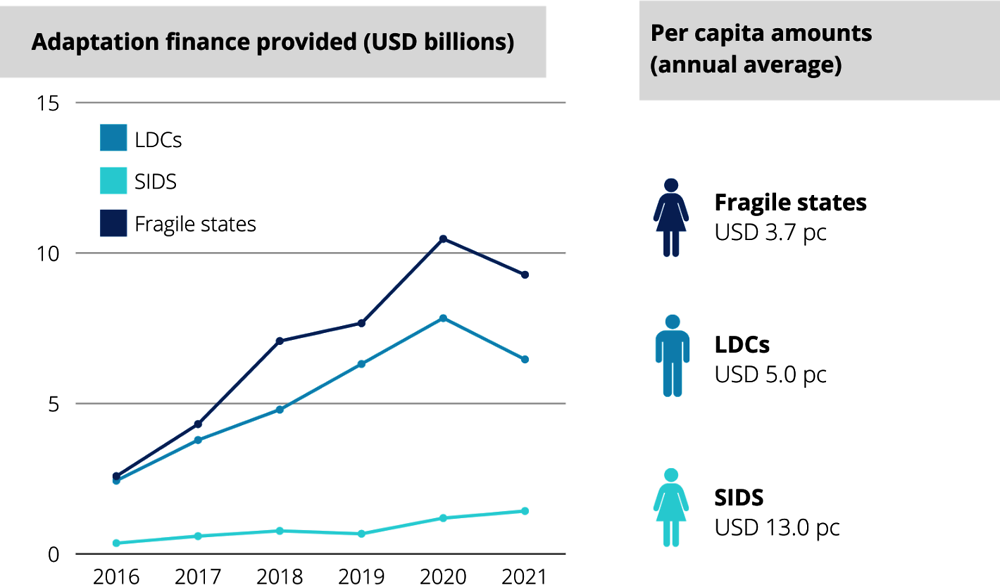
Middle-income countries received 67% (USD 70.7 billion) of the USD 106 billion of public climate finance for adaptation provided between 2016 and 2021, with low-income countries receiving only 18% (USD 19 billion) (Figure 2.6). On a per capita basis, middle-income countries received a yearly average of USD 3.0 per capita, compared to USD 5.0 per capita in low-income countries. Small island developing states (SIDS) and the least developed countries (LDCs) received 5% (USD 5 billion) and 30% (USD 31.6 billion), respectively, of total public adaptation finance provided over the five years, and an annual per capita average of USD 13.0 and USD 5.0, respectively. For both SIDS and LDCs, public adaptation finance consistently increased in both absolute and relative terms. Fragile states4 received 39% (USD 41.4 billion) of total public adaptation finance, which corresponds to a per capita average of USD 3.7. While public adaptation finance to fragile states increased in absolute terms, it remained stagnant in relative terms at around 40% of the total.
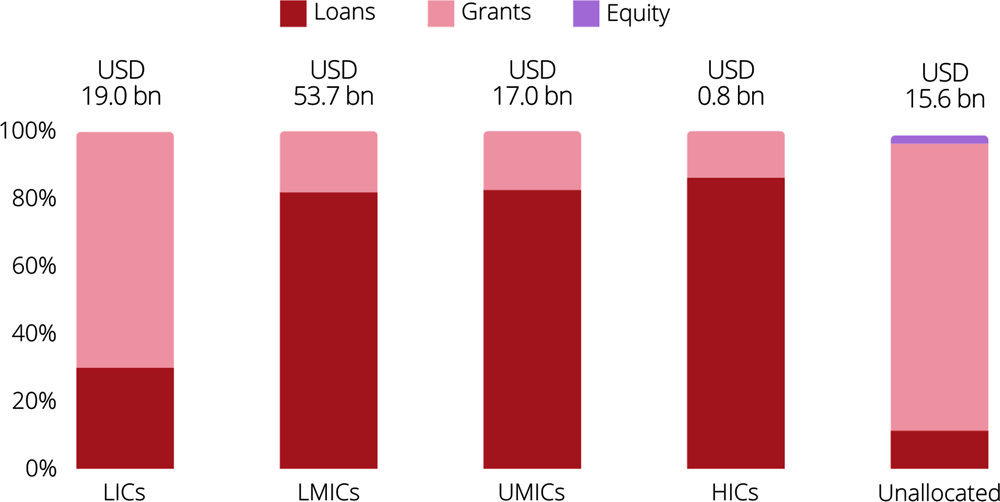
Note: The graph uses income groups according to World Bank definitions: Low-Income Countries (LIC), Lower-Middle Income Countries (LMIC), Upper-Middle Income Countries (UMIC) and High-Income Countries (HIC).
Source: Based on Biennial Reports to the UNFCCC, OECD DAC statistics, complementary reporting to the OECD.
Climate finance for adaptation was also highly concentrated in a few countries with large populations. For example, between 2016 and 2021 the top 10 recipients, which together have 59% of the total population of recipient countries’, received 32% of climate finance for adaptation. In contrast, the bottom 50 recipients, accounting for 8% of recipient countries’ combined population, only received 1.5%. Among the 20 top recipient countries, 15 were lower-middle income countries, 3 were low-income countries and only 2 were upper-middle income countries.
In terms of financial instruments, almost 70% of public climate finance for adaptation in low-income countries was provided in the form of grants, and 30% was provided as loans. In lower-middle income countries the share of grants represented 18% of public climate finance for adaptation and 17% in upper-middle income countries. The breakdown of financial instruments remained stable over the years across the different income groups.
Source: Based on Biennial Reports to the UNFCCC, OECD DAC statistics, complementary reporting to the OECD.
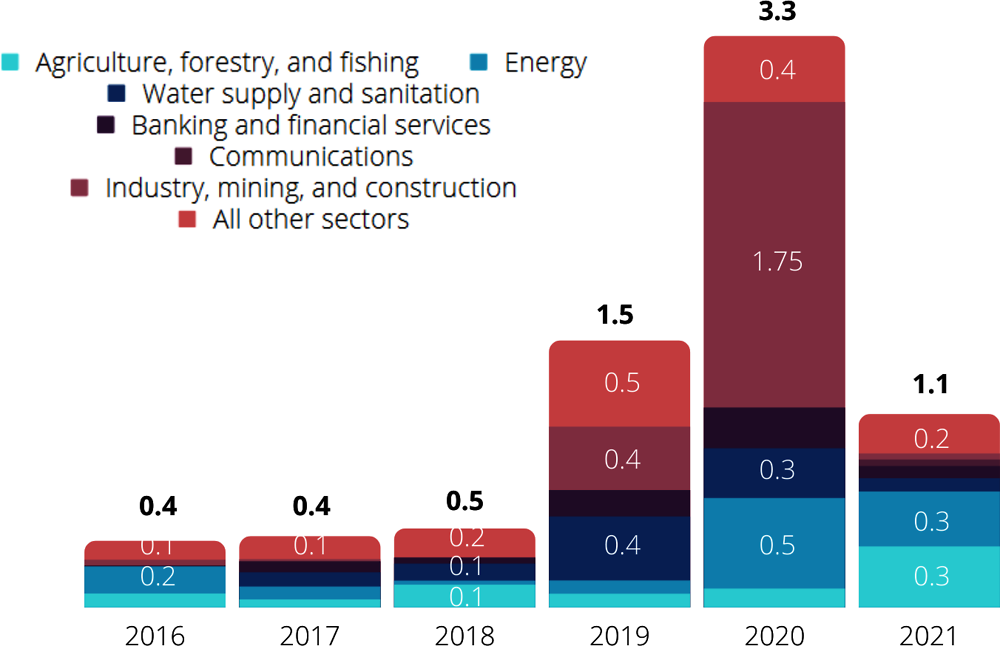
The impact of bilateral and multilateral public climate finance on directly mobilising private finance for adaptation remains very low. Historically, public climate finance has mobilised significantly lower levels of private finance for adaptation than it has for mitigation objectives (OECD, 2022[1]). Between 2016 and 2021, developed countries’ public finance interventions mobilised in total USD 7.1 billion of private finance for adaptation, i.e., USD 1.2 billion per year on average (Figure 2.8). By comparison, their public finance interventions mobilised USD 69.5 billion of private finance for mitigation over the period. It should be noted, however, that the sharp increase in private finance mobilised for adaptation in 2020 compared to other years was due mainly to a single large infrastructure project in the industry sector in Mozambique.
Many factors influence the ability of international providers to mobilise private finance. One is the composition of providers’ portfolios – e.g., the balance between mitigation and adaptation, the instruments and mechanisms employed, and the sectors and geographies targeted. Also relevant are the broader policy and enabling environment in developing countries and macroeconomic conditions most broadly. A general lack of knowledge in the private sector about existing or future adaptation projects creates an additional obvious investment barrier (OECD, 2022[1]).
The mobilisation of private finance for adaptation by bilateral and multilateral public climate finance primarily took place in large infrastructure projects. Between 2016 and 2021, 30% of total private adaptation finance mobilised targeted the industry, mining, and construction sector; 16% targeted the energy sector; another 13% targeted the water supply and sanitation sector; 11% targeted agriculture, forestry, and fishing and 8% targeted banking and financial services. This sectoral split differs significantly from the sectoral distribution observed in international public climate finance for adaptation.
Source: Based on OECD DAC statistics and complementary reporting to the OECD.
Due to confidentiality constraints of several providers, detailed information on the nature and scope of the underlying projects, notably private sector projects, is often unavailable. Regarding those projects for which a description is publicly available, however, the mobilisation of private finance for adaptation seems to concern mainly climate mitigation projects that include a smaller adaptation component. More than 60% of private adaptation finance mobilised by DAC members had a “significant” adaptation Rio marker compared with 37% that had a “principal” adaptation Rio marker. An example is the financing of a 500-megawatt solar photovoltaic power plant in an Asian developing country: A share of the support was counted as adaptation finance for the purposes of developing and implementing design modifications to make the solar photovoltaic infrastructure more resilient to extreme weather events, rising temperatures and other impacts of climate change.
MDBs mobilised the biggest share (55%) of private adaptation finance; bilateral provider countries mobilised 30%, and multilateral climate funds mobilised the remaining 15%. Direct investments in companies were by far the most widely used leveraging mechanism, accounting for 44% of total private adaptation finance mobilised. These were followed by guarantees (17%), syndicated loans (15%), simple co-financing (13%), shares in collective investment vehicles (CIVs) (8%) and credit lines (3%). The breakdown of different actors and leveraging mechanisms in mobilising private finance for adaptation largely corresponds to that observed in the mobilisation of private finance for mitigation (OECD, 2023[3]).
The private finance mobilised for adaptation in 2016-21 was distributed between income groups more evenly than was the case for international public adaptation finance. Low-income countries benefitted from 25% of total private adaptation finance mobilised, lower-middle income countries from 24%, upper-middle income countries from 20%, and high-income countries from 13%. LDCs and fragile states received each a 33% of private finance mobilised for adaptation. At the same time, SIDS received only 0.6% of private finance mobilised for adaptation, amounting to just USD 45 million or USD 0.1 cents per capita per year. The figures should be interpreted with caution as there were large variations year to year due to the small number of projects.
Importantly, data on private finance mobilised directly by international public climate finance only provide a partial picture of private finance. For example, stand-alone private finance that does not involve international public climate finance providers is not included. Therefore, the discussion in this section is not a comprehensive overview of all private sector participation in financing adaptation in developing countries. Further, the data do not reflect the effect that public interventions such as international capacity building or domestic policies may have in catalysing private sector finance and participation over time.
The flow of finance from providers can cascade through multiple intermediaries and end beneficiaries. For instance, adaptation finance might flow from a provider country's extending agency to an MDB as earmarked funding, be forwarded to a recipient country's national government, and then flow from the national government to local authorities and end beneficiaries. Analysis of channels of delivery can provide useful information on the end-users of adaptation finance and, in turn, help providers better tailor the options for scaling up adaptation finance. The data analysis presented in this section is based on the OECD DAC Creditor Reporting System (CRS) data on climate-related development finance5 and provider interviews conducted for this study, as information on delivery channels is not available in the context of OECD work on tracking progress towards the USD 100 billion goal.
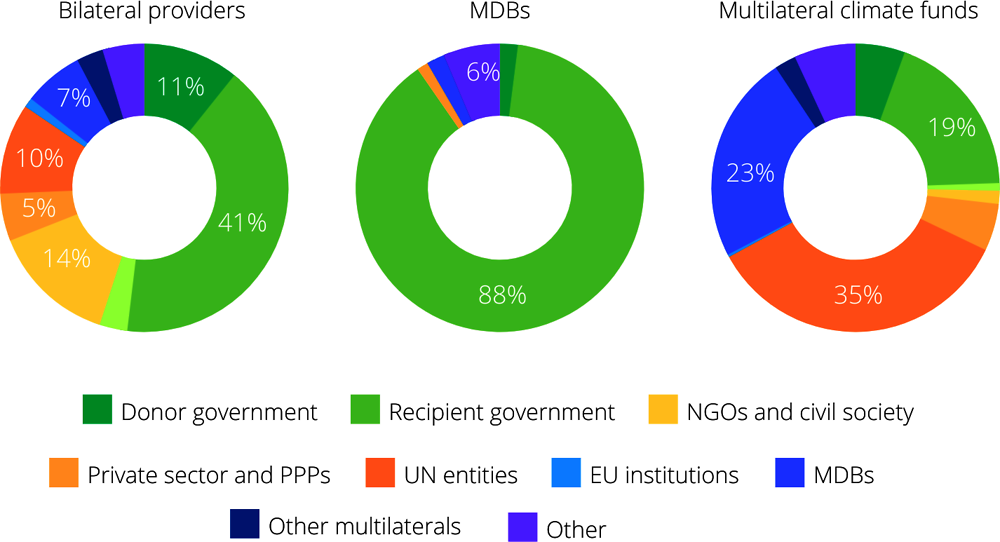
The majority (56%) of adaptation-related public development finance provided between 2016 and 2021 was delivered through recipient country governments (see Figure 2.9. ). Multilateral organisations were the second most important channel of delivery, accounting for 17% of this finance; non-governmental organisations (NGOs), civil society delivered 8%, provider governments delivered 6%, and private sector institutions 3%. Among multilateral institutions, UN entities were the top implementers with 7% of the overall total, followed by regional development banks and the World Bank Group that each delivered 3% of public development finance for adaptation. Among NGOs, donor country-based NGOs dominated, delivering 5% of all such finance. Developing country-based NGOs delivered only 1% of the total.
Source: Data based on OECD (2023[2]), Creditor Reporting System: Aid activities targeting Global Environmental Objectives, https://doi.org/10.1787/9c778247-en
The channel of delivery for adaptation finance has a significant impact on how funds are used, the efficiency of resource allocation and the overall effectiveness of adaptation projects. Each channel of delivery has its own strengths and weaknesses that can influence the impacts of adaptation finance; different channels are active in different sectors and implement different types of projects. Based on 2016-21 OECD DAC CRS data on adaptation-related development finance the following findings are highlighted:
Multilateral institutions primarily delivered 35% of adaptation-related development finance targeting the environmental policy and administrative management sub-sector. Among all multilateral institutions, UN entities, given their prominence in humanitarian and emergency interventions, delivered 37% of all adaptation-related development finance for food assistance and 56% of all adaptation-related development finance for emergency response. EU institutions and MDBs delivered 59% of total adaptation-related development for energy generation. Most of the finance delivered by multilateral institutions (82%) was in the form of grants; the average project size ranged from USD 5.1 million for UN entities to USD 26 million for EU institutions.
Governments of bilateral providers6 tend more often to be involved in smaller-scale projects related to general environmental protection. Bilateral providers delivered 13% of general environment protection finance. Bilateral providers also delivered 17% of the total adaptation-related development finance for the government and civil society sector. The overwhelming majority (88%) of adaptation-related development finance delivered by bilateral providers is in the form of grants, and the average project size is USD 3.4 million.
Recipient country national governments are the primary channel of delivery for adaptation finance in subsectors related to domestic infrastructure investments, having delivered 88% of finance for road transport, 92% for large water supply systems and 85% for agricultural water resources. Delivery by recipient country national governments can help ensure that adaptation finance is used in ways that align with national priorities and local contexts. However, the effectiveness of this channel depends on the capacity of the government to manage and allocate resources. Most of this finance delivered by recipient governments (79%) was in the form of loans, and projects were relatively large with an average project value of USD 21.4 million.
NGOs and civil society organisations (CSOs) often have strong local networks and a deep understanding of community needs that can enable them to implement targeted and locally tailored adaptation projects. However, NGOs and CSOs may face challenges in accessing large-scale funding and may have limited capacity for project management and monitoring. NGOs and civil society were most active in fields relating to social policies, humanitarian action and civil society. They delivered 85% of all adaptation-related development finance for democracy and civil society, 24% of development food assistance, and 17% of agricultural development. NGOs and civil society implemented almost exclusively grants (99.7%), focusing on small projects with an average size of USD 1.2 million.
Private sector implementation channels for adaptation finance can provide innovative solutions, increase efficiency, and leverage additional resources. However, profit-driven private sector investment can result in a focus on projects with clear financial returns, potentially neglecting the needs of the most vulnerable communities. Private sector institutions mainly delivered adaptation finance in subsectors linked to financial returns such as banking and financial services (17%) and energy generation (11%). Projects implemented by the private sector with international public finance are also relatively small, with an average size of USD 2.8 million.
The channels of delivery vary across recipient country income groups. The use of multilateral organisations and NGOs is slightly more prevalent in LDCs than in other recipient countries. Recipient country national governments, however, deliver 59% of adaptation finance in LDCs, 74% in UMICs and 59% in SIDS and are the primary channel of delivery in fragile states. In SIDS, multilateral organisations deliver 20% of adaptation projects. Private sector institutions and public-private partnerships are less common in SIDS than in other countries.
References
[2] OECD (2023), “Creditor Reporting System: Aid activities targeting Global Environmental Objectives”, OECD International Development Statistics (database), https://doi.org/10.1787/9c778247-en.
[3] OECD (2023), Scaling up the mobilisation of private finance for climate action in developing countries: Challenges and opportunities for international providers, OECD Publishing, https://doi.org/10.1787/17a88681-en.
[1] OECD (2022), Climate Finance Provided and Mobilised by Developed Countries in 2016-2020: Insights from Disaggregated Analysis, Climate Finance and the USD 100 Billion Goal, OECD Publishing, Paris, https://doi.org/10.1787/286dae5d-en.
Notes
← 1. Data used by the OECD to track progress towards the USD 100 billion goal is based on Based on Biennial Reports to the UNFCCC, OECD DAC statistics, complementary reporting to the OECD. Importantly, for both multilateral public and mobilised private climate finance, the OECD work on Climate Finance and the USD 100 Billion Goal only considers the share of finance that is attributable to developed countries, recognising developing countries shareholders contribute to the financing and operations of multilateral development banks and development finance institutions. The approach of considering only the “attributed” share of these two components is taken in the context of focusing on developed countries’ contributions and their progress towards the UNFCCC USD 100 billion goal.
← 2. Further information about the methodologies used by the OECD to gather these data is presented in Annex A of a 2022 report in the Climate Finance and the USD 100 Billion Goal series titled Climate Finance Provided and Mobilised by Developed Countries in 2016-2020: Insights from Disaggregated Analysis.
← 3. Financing provided bilaterally by the EU Commission from the EU budget and European Development Fund.
← 4. Fragile states are generally defined as presenting weak capacities to carry out basic governance functions and lacking the ability to develop mutually constructive relations with society (OECD, 2022[1]).
← 5. Within the OECD CRS database, the channel of delivery is defined as the first implementing partner. It is the entity that has implementing responsibility over the funds and is normally linked to the extending agency by a contract or other binding agreement and is directly accountable to it. By focusing on the first implementing partner, the OECD CRS database does not capture co-implementing agencies that may be involved in the realisation of development projects. Nonetheless, the channel of delivery combined with qualitative information from interviews with providers can serve as an indication for some key trends in adaptation finance delivery.
← 6. This refers to the channels of delivery called “donor government” and “third country government (delegated co-operation)” in the CRS. In practice, these flows will often be transferred to other channels of delivery. For example, EU institutions may fund a project planned by KfW, in which case the EU would report the project as delivered through “third country government (delegated co-operation)”, but KfW may transfer the funding to a local organisation for actual implementation.