copy the linklink copied!Hospital beds and discharge rates
The number of hospital beds provides an indication of the resources available for delivering services to inpatients. The influence of the supply of hospital beds on admission rates has been widely documented, confirming that a greater supply generally leads to higher admission numbers (Roemer’s Law that a “built bed is a filled bed”). Therefore policymakers are recognising that simply increasing the number of hospital beds will not solve problems of overcrowding or delays in hospitals.
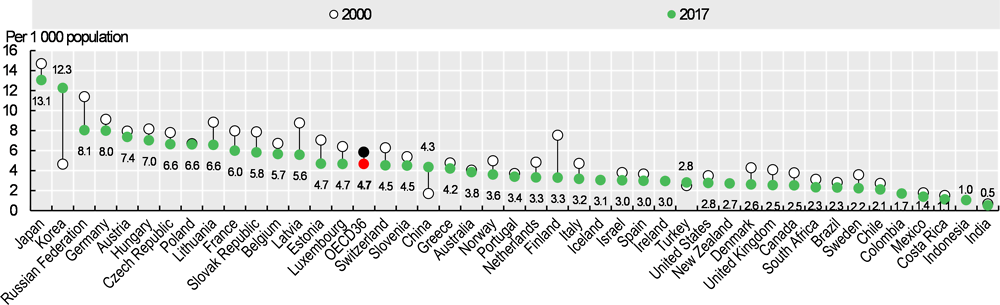
Across OECD countries, there were on average 4.7 hospital beds per 1 000 people in 2017. In Japan and Korea, rates were much higher (13.1 and 12.3 beds per 1 000 people respectively). Two-thirds of OECD countries reported between 3 and 8 hospital beds per 1 000 population, with rates lowest in Mexico, Chile and Sweden.
Since 2000, the number of beds per capita has decreased in nearly all OECD countries. The largest reduction occurred in Finland, with a fall of more than 50% (from 7.5 beds per 1 000 population in 2000 to 3.3 in 2017), mainly affecting long-term care beds and psychiatric care beds. Several other countries reduced capacity by 2 beds or more per 1 000 population (Estonia, France, Latvia, Lithuania and the Slovak Republic). Part of the decrease can be attributed to advances in medical technology, allowing more surgery to be performed on a same-day basis, or as part of a broader policy strategy to reduce the number of hospital admissions. On the other hand, the number of beds has strongly increased in Korea (+164%), with a significant number of these dedicated to long-term care.
Hospital discharge rates measure the number of patients who leave a hospital after staying at least one night. Improving timely discharge of patients can help the flow of patients through a hospital, allowing hospitals to reduce the number of beds. Both premature and delayed discharges not only worsen health outcomes, but also increase costs: premature discharges can lead to costly readmissions; delayed discharges use up limited hospital resources.
On average across OECD countries, there were 154 hospital discharges per 1 000 population in 2017. Hospital discharge rates were highest in Germany, Austria and Lithuania (over 200 per 1 000 population) and lowest in Mexico, Canada, Chile and the Netherlands (less than 100). The number of discharges fell in the majority of OECD countries, with some of the largest reductions observed in countries where there were also large decreases in the number of beds (e.g. Italy, Finland, Estonia, Sweden and Latvia). On the other hand, hospital discharge rates doubled in Korea, Turkey and China.
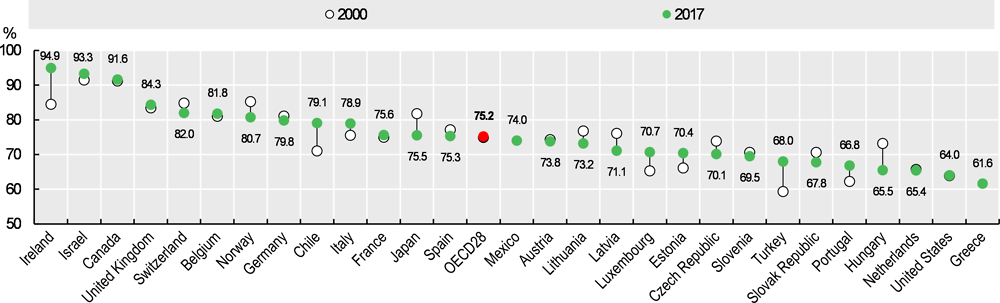
High occupancy rates of curative (acute) care beds can be symptomatic of a health system under pressure, and may lead to bed shortages and higher rates of infection. Overly low occupancy rates may reflect underutilised resources. The National Institute of Health and Care Excellence (NICE) in the United Kingdom recommend that health care providers should plan capacity to minimise the risks associated with occupancy rates exceeding 90% (NICE, 2018[1]). The occupancy rate was over 90% in Ireland, Israel and Canada in 2017. In Ireland, this represents a ten percentage point increase since 2000 (from 85% to 95%). Occupancy rates were comparatively low in Greece, the United States, the Netherlands and Hungary (around 65% or less). Around half of OECD countries have bed occupancy rates of 70-80%, and the OECD average is 75%.
Hospital beds include all beds that are regularly maintained and staffed and are immediately available for use. They include beds in general hospitals, mental health and substance abuse hospitals, and other specialty hospitals. Beds in residential long-term care facilities are excluded. In the United Kingdom, data are restricted to public hospitals. Data for Sweden exclude private beds that are privately financed. Beds for use by patients recovering from day surgery but released the same day may be included in countries where they cannot be distinguished from inpatient beds (e.g. Austria, Luxembourg and the Netherlands). Cots for healthy infants are included for a few countries (e.g. Canada, the Netherlands and Poland).
Discharge is defined as the release of a patient who has stayed at least one night in hospital. It includes deaths in hospital following inpatient care. Same-day discharges are usually excluded, with the exceptions of Chile, Japan, Norway and the United States which include some same-day discharges. Healthy babies born in hospitals are excluded from hospital discharge rates in several countries (Australia, Austria, Canada, Chile, Estonia, Finland, France, Greece, Ireland, Lithuania, Luxembourg, Mexico, the Netherlands and Norway). These comprise around 3-10% of all discharges. Data for some countries do not cover all hospitals. For instance, data for Mexico, New Zealand and the United Kingdom are restricted to public or publicly funded hospitals. Data for Ireland cover public acute and psychiatric (public and private) hospitals. Data for Canada, the Netherlands and the United States include only acute care/short-stay hospitals.
The occupancy rate for curative (acute) care beds is calculated as the number of hospital bed-days related to curative care divided by the number of available curative care beds (multiplied by 365).
References
[1] NICE (2018), “Bed occupancy”, https://www.nice.org.uk/guidance/ng94/evidence/39.bed-occupancy-pdf-172397464704.
[2] OECD (2014), Geographic Variations in Health Care: What Do We Know and What Can Be Done to Improve Health System Performance?, OECD Health Policy Studies, OECD Publishing, Paris, https://dx.doi.org/10.1787/9789264216594-en.
Source: OECD Health Statistics 2019.

1. Data exclude discharges of healthy babies born in hospital (3-10% of all discharges).
2. Data include discharges for curative (acute) care only.
Source: OECD Health Statistics 2019.
Source: OECD Health Statistics 2019.
Metadata, Legal and Rights
https://doi.org/10.1787/4dd50c09-en
© OECD 2019
The use of this work, whether digital or print, is governed by the Terms and Conditions to be found at http://www.oecd.org/termsandconditions.