
2. Mapping Brazil’s participation in digital trade
This chapter reviews existing data to map different aspects of Brazil’s participation in digital trade. It shows that, despite considerable progress in connecting individuals to the Internet, Brazil still maintains barriers on ICT goods and services. This is affecting the ability of Brazilian firms to effectively leverage digital technologies to increase trade. In particular, Brazil lags in the use of ICT inputs in key export sectors such as agriculture, forestry and fishing and in manufacturing. However, Brazil has emerged as a strong regional supplier of digitally deliverable services. Moreover, further engagement in trade in parcels can provide new avenues for exports of Brazilian SMEs.
Brazil has a strong potential to benefit from digital trade. Not only does trade represent nearly a third of its GDP but Brazil has tripled the share of its population with access to the internet in just 15 years.
Barriers to ICT goods and services remain which could explain why Brazil is at the lower end of ICT use in the production of exports.
Brazilian SMEs rely on trade in parcels as a means for accessing export markets.
Digitally deliverable services represent an important and growing share of Brazil’s exports, and, in this area, Brazil outperforms many regional partners.
Although traditional trade statistics record many of the trade transactions that fall under the purview of digital trade, they do not differentiate among transactions that have been digitally ordered or delivered. This means that digital trade remains largely invisible in official trade statistics (and more broadly in GDP statistics). While efforts are underway to better capture digital trade in official statistics (OECD-WTO-IMF, 2020[1]), it will be some time before robust and internationally comparable measures are developed (Box 2.1). This implies that gauging the extent of a country’s participation in digital trade has to proceed with caution and using existing indicators and statistics to shed light on particular aspects of trade in the digital era.
This chapter reviews existing data to map different features of Brazil’s evolving participation in digital trade. It first looks at general trends in digitalisation, placing Brazil in the context of the budding digital transformation. Then it identifies how Brazil has performed with respect to access to different digital enablers which include goods such as network equipment, the devices used to access the internet as well as telecommunications or computer and related services. The mapping exercise then turns to the use of ICT goods and services across different sectors, benchmarking Brazil’s performance in this area against other countries. This is followed by an analysis of the evolving environment for trade in parcels, proxied by trade sent via the post, looking at issues related to getting goods to the border, across the border and beyond. The analysis then discusses digitally deliverable services and the share of trade that they occupy. A wider look at GVC participation across sectors of varying digital intensity follows.
Unfortunately, and owing to the unavailability of comparable data, the analysis largely focuses on the trade patterns before the COVID-19 crisis. However, where available, the analysis uses more recent data.
Although digital trade remains largely invisible in official trade statistics, this does not mean that digital trade transactions are not being recorded. They are mostly captured in aggregates, but are not separately identifiable (OECD-WTO-IMF, 2020[1]). That is, traditional trade statistics for goods record many digitally enabled or ordered trade transactions, but they do not differentiate among goods transactions according to whether they have been digitally ordered or not. Similarly, in services, measurement of cross-border transactions has always been difficult, but for digital trade the challenge is compounded by the need to identify those services which are digitally ordered as well as those which are digitally delivered.
Some aspects of digital trade are less well covered in trade statistics. For instance, as the value of digitally ordered parcels often falls below de minimis thresholds, there is a concern that small parcel trade may not be fully captured in official statistics (although the impact on overall values of trade is likely to be marginal). More significant challenges exist in the area of trade in services (digitally delivered), particularly to households. Data from VAT returns from firms are being used to improve current measurement. These approaches typically lead to upward revisions, but the overall impact remains small, amounting to revisions of less than 0.4% of total imports (OECD, 2018[2]).
To address these challenges, countries are exploring new data sources, such as credit card information, and developing projects linking business register data with customs data to provide information on the size of imports and exports by e-tailers (classified as NACE 47.91). Government statistical agencies are also exploring the scope for adding new questions to existing surveys.
Other challenges relate to when, how and whose trade flows should be recorded. Digital intermediary platforms, which facilitate transactions for a fee, do so without ever taking ownership of the products involved. The identification of these platforms in business registers, their classification in terms of the actual services they provide, and the treatment of the transactions they facilitate – including which parts should actually be recorded as being cross-border, and with which partner country – can pose significant conceptual and empirical challenges.
Efforts are underway to better capture digital trade in official trade statistics, including through the ‘living’ Handbook for measuring digital trade (OECD-WTO-IMF, 2020[1]) which is in its first revision and is co-ordinated by the OECD and WTO-led inter-agency Task Force on International Trade Statistics (TFITS). This taskforce brings together representatives from international agencies (OECD, UNCTAD, WTO, IMF, EUROSTAT, UN and the World Bank Group) plus more than 25 countries, including Brazil, China, India, Indonesia, the Russian Federation, South Africa and Thailand, in addition to many OECD members. Nevertheless, it will be some time before robust and internationally comparable measures are identified, reflecting also the broader challenges in measuring digitalisation (see (OECD, 2019[3])). Until better measures for digital trade are available, analysis has to proceed carefully, using existing statistics to shed light on particular aspects of trade in the digital era.
Source: OECD (2020[4]).
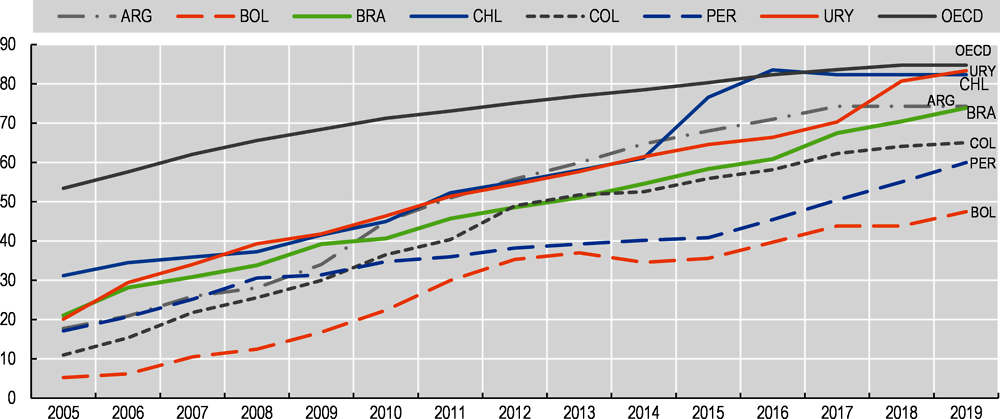
The potential for Brazil to benefit from digital trade, and digitalisation more broadly, will depend, in part, on the existing degree of internet penetration among consumers and producers. In this respect, while Brazil has made important progress, tripling the share of its population with access to the Internet in just 15 years, access remains below the OECD average (Figure 2.1).
At the same time, broadband penetration remains low, despite Brazil having lower than average prices for basic broadband (Figure 2.2). The growing rate of access to the Internet in Brazil is therefore largely driven by a higher adoption of mobile technologies where deployment across remote populations may also be easier (OECD, 2020[5]).
Recent OECD analysis identifies the persistence of digital divides along well-established lines. There is a widening age and income gap in terms of access to the Internet and there continues to be a rural-urban divide with penetration rates 25 percentage points lower in rural areas (OECD, 2020[5]). Tackling these digital divides will be important to ensure more inclusive access to the opportunities that digital trade offers to Brazilian firms and citizens.1
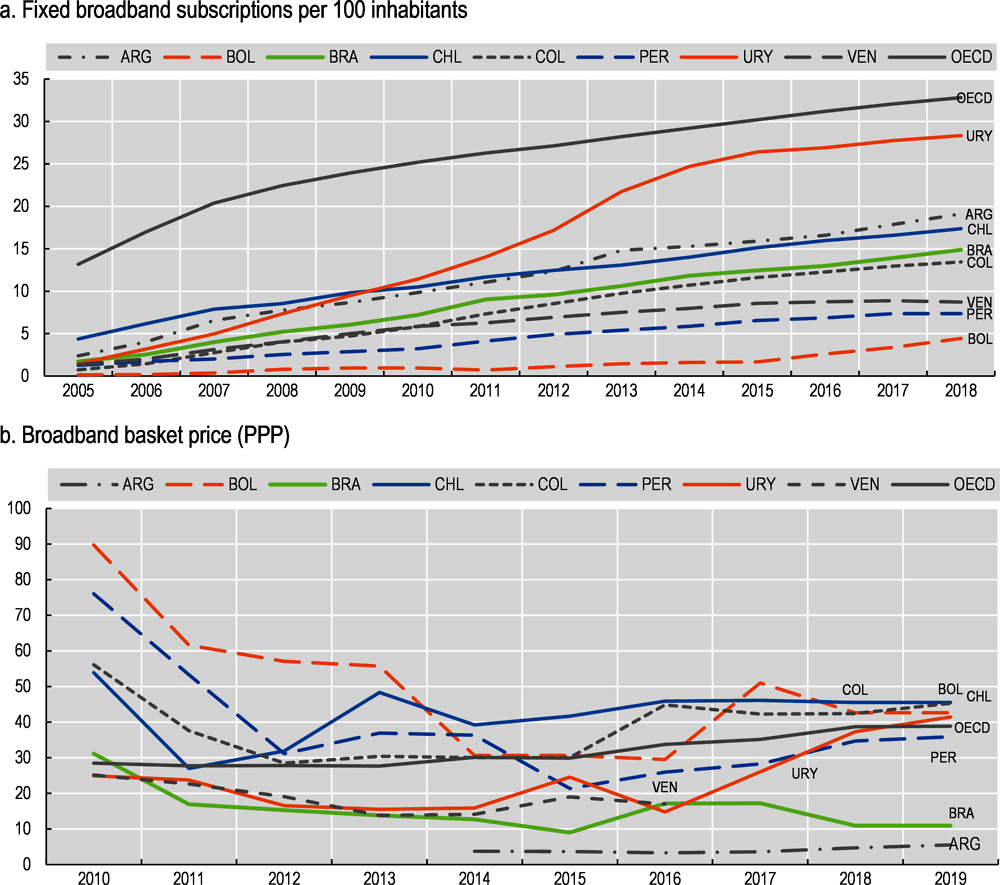
Note: Broadband basket prices 2008-2017 data refer to a fixed-broadband basket with a monthly data usage of (a minimum of) 1 GB. 2018 and onwards data refer to revised a fixed-broadband basket with a monthly data usage of (a minimum of) 5 GB.
Source: ITU.
2.2.1. Barriers to digital trade enablers need to be reduced
Digital trade enablers are the goods and services that are needed to support digital trade transactions. These range from the goods needed to support digital infrastructure such as fibre-optic cables, insulated cables, routers and switching appratus, to the devices that people and businesses use to connect to the Internet and the services that underpin access and support (e.g. telecommunications and computer and related services).2
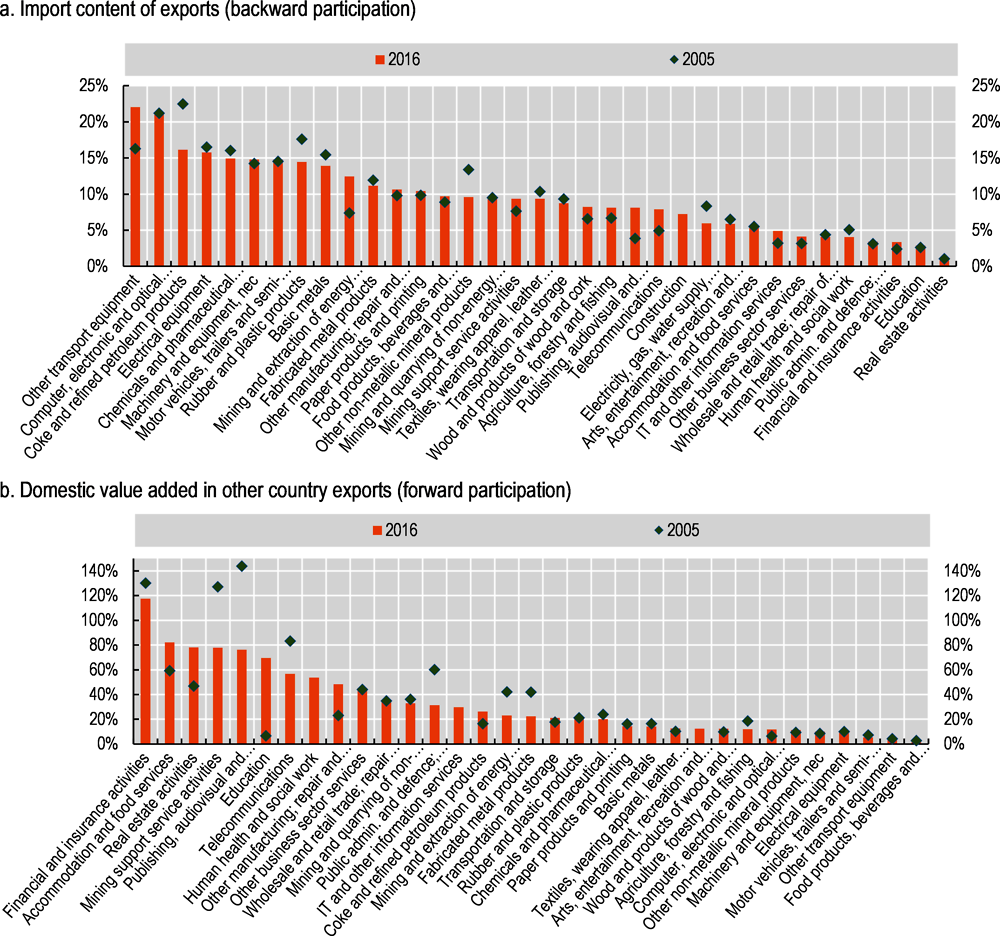
Trade plays a key role in the production of these products which are the result of complex and highly internationalised value chains. Indeed, on average, around 80% of the value added in domestic consumption of computer and related equipment is from abroad, making this sector one of the most internationalised globally. For IT and other information services, the foreign value added content of domestic consumption stands at about 40% (OECD, 2020[6]).
Goods that support digital trade transactions continue to face barriers in Brazil
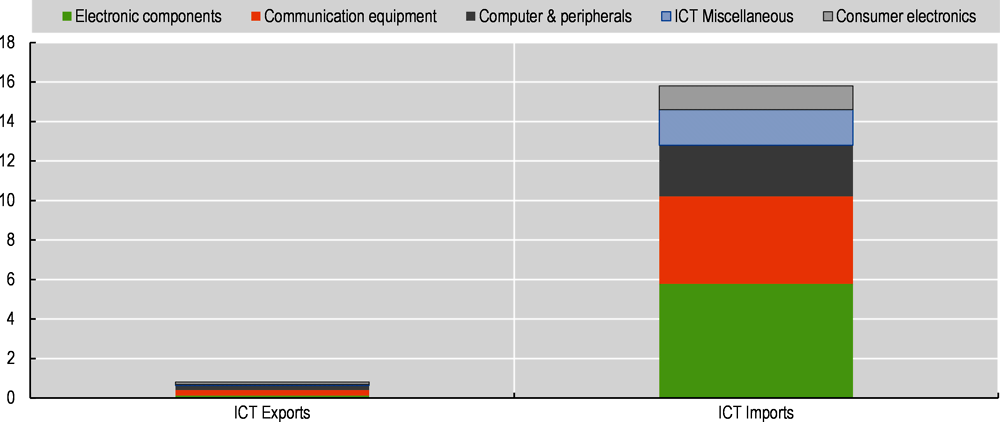
Where goods are concerned, ICT imports make up around 9% of Brazil’s total imports in 2019, however ICT exports accounted for less than 0.04% of Brazil’s exports, underscoring that Brazil relies on trade for access to the ICT goods it needs (Figure 2.3). ICT items that are most imported by Brazil include telephone set parts (HS 851770, 15.7% of total ICT imports), processor chips (HS 854231, 12.1% of total ICT imports), and reception and transmission apparatus (HS 852990, 9.9% of total ICT imports). The main origin of ICT imports is China (47.2% of the total value of ICT imports), followed by the United States (10.9%) and Korea (9.4%).
Note: ICT goods definition obtained from https://unctadstat.unctad.org/en/Classifications/DimHS2017Products_Ict_Hierarchy.pdf
Source: BACI database.
Despite Brazil’s reliance on foreign markets for access to ICT goods, tariffs on these products remain high (Brazil is not a member of the WTO Information Technology Agreement (ITA), affecting the cost of access to digital technologies. Applied tariffs are highest on consumer electronic equipment, which includes items such as sound amplifiers and headphones. They are lower (and sometimes equal to zero) on electronic components such as semiconductors and semiconductor devices, processors and controllers, and other electrical apparatus (Figure 2.4).3 However, and in general, Brazil’s tariffs on ICT goods tend to be about 9-10 percentage points higher than world averages in all ICT product categories except electronic components (+5 percentage points relative to the world average) (Figure 2.4). This also remains the case after the COVID-19 pandemic, with MFN duties in 2021 closely resembling their pre-crisis levels. Brazil has also bound its duties at the higher level of 30-35%, potentially creating additional uncertainty related to the tariff overhang (WTO, 2015[7]).
ICT good imports in Brazil are also subject to a range of non-tariff measures (NTMs). The term NTM covers a diverse set of measures in terms of purpose, legal form and economic effect. NTMs comprise all policy measures other than tariffs and tariff rate quotes that have more or less direct impact on international trade. They can affect the price of traded products, the quantity traded or both. International trade in goods and services can be strongly affected by NTMs that originate from domestic regulations. These measures are generally imposed to address market failures, such as information asymmetries or negative externalities. They can provide a signal of quality, strengthening consumer confidence that foreign products abide by domestic regulations (see Cadot et al. (2018[8]), Henson and Jaffee (2007[9]), Maertens and Swinnen (2007[10]), Xiong and Beghin (2014[11])). But while countries may share the same objectives, they often apply different standards or methods to ensure compliance with regulatory measures. These differences can raise costs for businesses seeking to access more than one market.
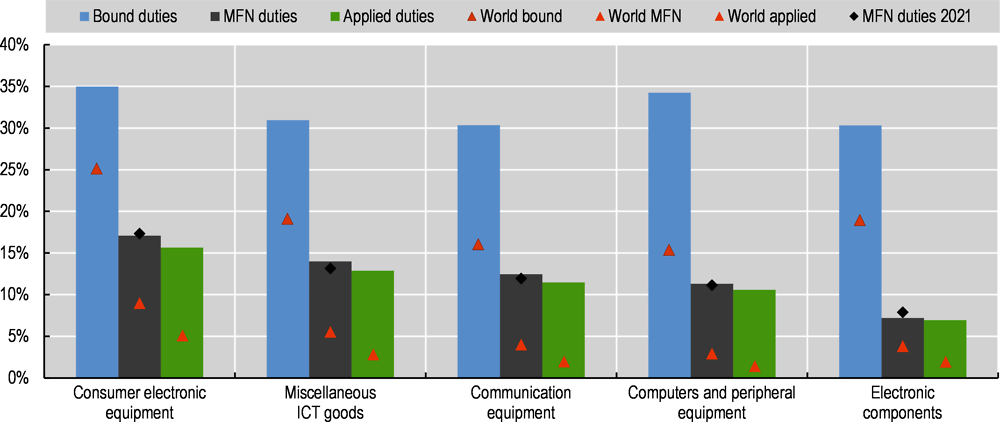
Note: Tariff data is collected for the years 2017-2018 and averaged both Brazil and the World. The average over 2017-2018 is selected in order to gather a larger number of observations in the world average tariff. ‘BRA applied duties 2021’ are extracted from the WTO Integrated Database (IDB). Information on tariff rates for HS 851950, 852873, 854012 and 854040 is missing for Brazil in 2017-2018 in TRAINS. ‘Applied duties’ refer to effectively applied tariffs (AHS), i.e. A customs duty which is lower than the statutory duty – in light of preferential arrangements with exporters or lower temporary duties passed by Parliament or decided on and put into effect by a government for economic reasons (WITS, 2021).
Source: TRAINS and WTO Integrated Database.
According to the TRAINS data base which uses a harmonised classification and method for identifying NTMs and which was last updated in 2020 for Brazil, an average of 10-12 non-tariff measures (NTMs) apply per product (Box 2.2), with computers and peripheral equipment most affected.4 The category of Technical barriers to trade (TBT) is most common. It includes issues such as certification, labelling, and authorisation requirements from relevant government agencies.5 However, licensing, quotas and other quantity-control measures, which include ‘non-automatic’ licenses and import controls are also present.6 A number of export-related measures, including export controls and other technical export measures are also in place7 (see Annex Table 2.A.2 for a list of all NTMs identified).8,9
Non-tariff measures refer to all measures affecting trade flows that are not tariffs. They take many forms and fulfil a broad range of objectives, some trade-related, others not.
Two different types are usually distinguished. The first, often referred to as “technical” measures, includes primarily sanitary and phytosanitary (SPS) and technical barriers to trade (TBT) measures. The second type, often referred to as “non-technical” measures, includes quantitative restrictions (QRs), forced logistics or distribution channels, price measures and so forth.
Technical measures: there are as many as 34 different types of SPS measures and 24 types of TBTs.
Non-technical measures: there are five different types of BCM (border-control measures such as pre-shipment inspection) and 28 types of QRs (quantitative restrictions such as non-automatic import licensing, quotas, etc.).
The overall number of NTMs per ICT product (Figure 2.5) is, however, lower than the OECD average, especially in communication equipment, consumer electronic equipment and computer and peripheral equipment. Nevertheless, it remains higher than for some regional partners like Chile (2.77 NTMs per ICT good on average), Colombia (2.03) and Mexico (3.15).
Although the average number of NTM per good is lower than OECD averages, Brazil ranks relatively high in terms of the number of goods affected by NTMs. The frequency ratio of NTMs, that is, the number of individual HS goods affected by at least one NTM as a share of the total number of ICT goods, is high (Figure 2.6). According to the TRAINS database, all ICT goods in Brazil are subject to at least one NTM measure in every NTM category (SPS measures,10 TBT measures, Inspection and other formalities, licensing requirements and export-related measures).11 This contrast with regional partners like Colombia where less than 30% of Colombia’s ICT tariff lines face a TBT restriction and fewer than 20% of ICT tariff lines report NTM licensing requirements (Figure 2.6).
In particular, according to the TRAINS database, Brazil’s ICT goods are subject to a higher number of export measures relative to other countries (red bar in Figure 2.6), which may affect Brazil’s ability to participate in ICT value chains as an exporter. In addition, the broad application of Brazil’s NTMs, as identified from the frequency ratios calculated from the TRAINS database, suggests that there might be potential for more targeted NTMs (in terms of product scope or adopting only some types of NTMs) to promote trade in ICT goods.
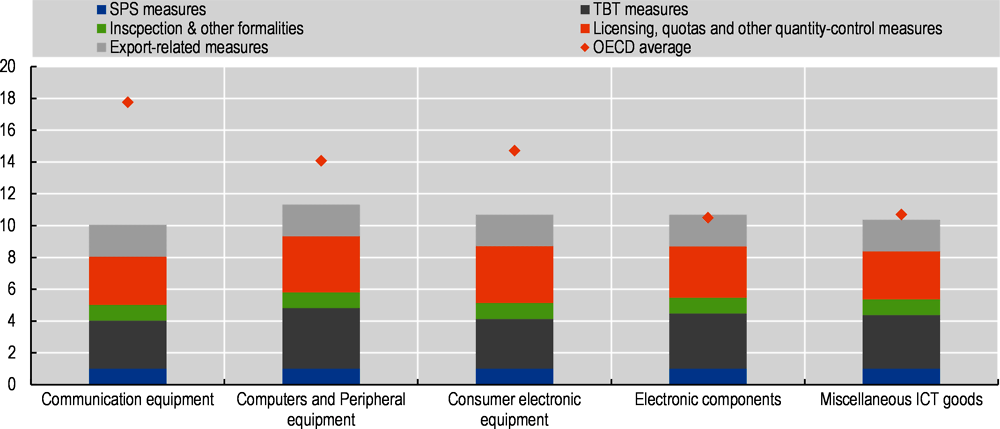
Note: The figure shows the number of Non-Tariff Measures (NTMs) for each 8-digits HS codes for ICT imports in Brazil for the latest available year (2018). For instance, there are 100 8-digit products imported in the category of Computers and Peripheral equipment in Brazil, with 381 TBT barriers on these imports, meaning that Computer and Peripheral equipment products will face on average 3.81 TBT measures. The figure includes information on NTM measures of partial coverage. SPS measures relate to certification of conformity requirement (A83) in UNCTAD’s international classification of non-tariff measures (UNCTAD, 2019). The comparison is made with respect to measures A,B,C,E,F,H,P of general application (bilateral measures are excluded). The OECD average includes the European Union as a whole and uses 2018 or the latest available year, identifying ICT goods in HS2012 when reported in this nomenclature.
Source: WITS TRAINS NTM database.
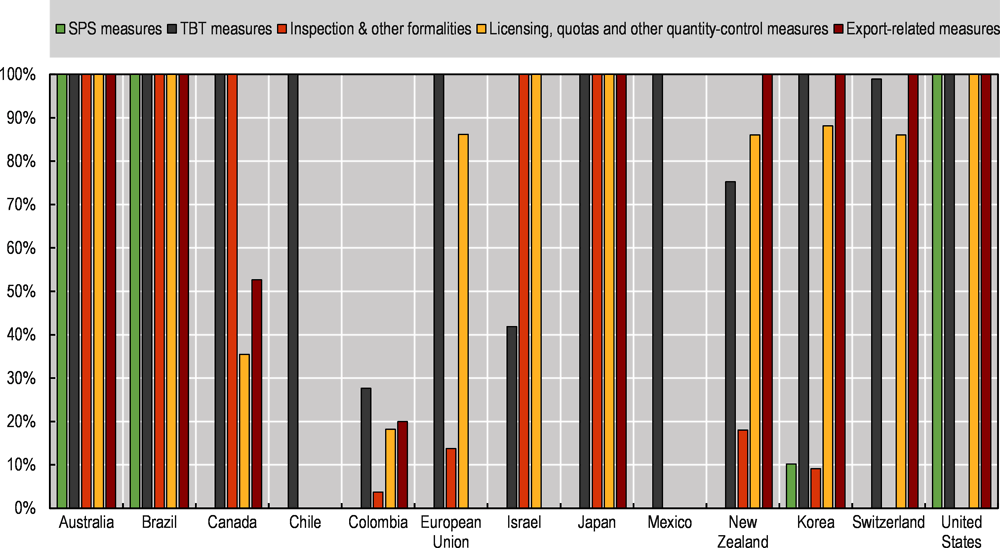
Note: The figure shows the frequency ratio (e.g. the proportion of HS 6 digit lines attracting an NTM over the total number of ICT HS 6 digit lines) for Brazil and OECD countries. A value of 100% for TBT measures means, for instance, that every ICT import at the 6 digit level attracts at least one TBT measure, while a value of 30% means that 30% of the total ICT tariff lines were subject to at least one TBT measure. When a bar is missing for a particular country/region it means that the country/region does not have restrictions of that type on ICT goods (e.g. no export-related measures).The comparison is made with respect to those NTM types for which data is available in all countries/regions (A,B,C,E,P), using data from 2018 or the latest available year, in the HS nomenclature of 2017 and 2012.
Source: WITS TRAINS NTM database, year 2018.
Beyond ICT goods, there are a range of products that underpin digital infrastructures such as electronic apparatus, cables, and specialised telecommunication apparatus. These also tend to attract relatively high tariffs of 12% and occupy an important share in Brazil’s imports (USD 1.25 billion in 2019) (Figure 2.7). As for ICT goods, MFN duties also resembled their pre-COVID-19 levels in 2021.Trade liberalisation in these products is likely to contribute to reductions in prices of critical digital infrastructure products thereby promoting further digital connectedness in Brazil.
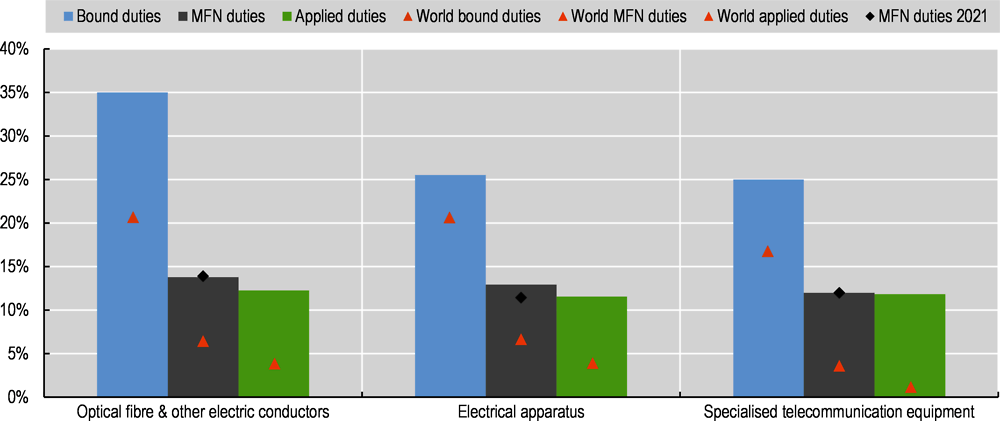
Note: The figure is based on a list of ten HS2017 goods. Optical fibre & other electronic conductors includes HS: 854442,854449,854470,900110. Electrical apparatus includes HS 853630, 853650, 853669, 853690, 853810. Specialised telecommunication equipment includes HS 903040.
Source: TRAINS and WTO IDB database.
Services that underpin access and use of digital solutions also remain subject to barriers
ICT services, which include telecommunication and computer services, are the backbone of digitally enabled activities. Indeed, cloud computing, remote storage, or communication and related software solutions enable the digital transformation of businesses. In Brazil, in 2019, ICT services represented over 7% of both services exports and imports with this share rising in 2020 to 8% of exports and 12% of imports (Figure 2.8). In particular, computer services exports accounted for about USD 2.07 billion while imports were worth USD 5.02 billion in 2020.The expansion of ICT services trade in 2020, in the contexts of a generalised reduction in services trade, reflects the consequences of the pandemic, with activities increasingly becoming digital. However, the growth of the sector pre-dated COVID-19, meaning that the pandemic appears to have accelerated an existing pre-crisis trend (Figure 2.8). The relatively high participation in ICT services exports also contrasts with the relatively low degree of participation in ICT goods exports and places Brazil as a more specialised exporter of ICT services.
According to firm-level data, the United States is Brazil’s main trade partner for ICT services, followed by regional partners (Chile is the destination of 18% of ICT exports) and other OECD countries12 (Figure 2.9). Brazilian firm level data also confirms that ‘information and technology services’ make up the bulk of Brazil’s ICT services exports, totalling 91% of the total value of ICT exports in 2018. However, telecommunication services appear to play a more important role on the import side, with 27% of the total value of ICT imports in ‘telecommunication, broadcasting and information services’.
However, despite the importance of computer services imports for Brazil, trade in this category of services might be restricted owing to the presence of relatively high restrictions. According to the OECD Services Trade Restrictiveness Index, Brazil ranks 44th out of 48 economies in terms of restrictions to trade in computer services, well above OECD averages. Moreover, Brazil has become more, rather than less, restrictive to trade in this sector since 2014 (Figure 2.10).
Note: Percentage figures refer to the sum of Computer and Telecommunication services as a share of total services exports and imports. Telecommunications (9.1) and Computer Services (9.2) in EBOPS 2010 (BPM6) are classified as ICT services. See OECD Guide to Measuring the Information Society (2011:22). Data labels show the share of ICT services imports over total services imports.
Source: UNCTADSTAT Balance of Payments statistics, EBOPS classification.
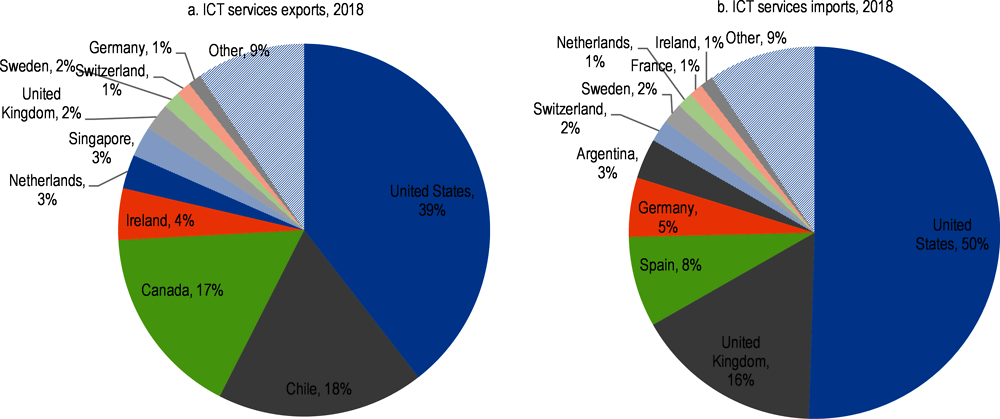
Note: ICT Services are defined as Serviços de tecnologia da informação (NBS 115) and Serviços de telecomunicação, difusão e fornecimento de informações (NBS117).
Source: OECD using SISCOSERV, year 2018.
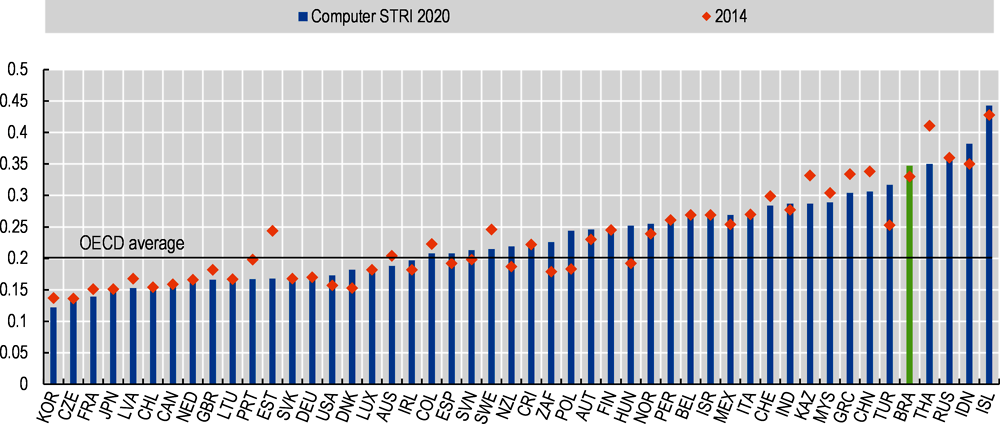
Note: Higher values identify higher restrictions. Triangles identify values for 2014.
Source: OECD Services Trade Restrictiveness Index.
2.2.2. Brazil has a low share of ICT inputs in the production exports
In the absence of more detailed statistics on the adoption of digital technologies, the use of ICT goods and services inputs to produce non-ICT exports can provide a useful proxy measure for the digital footprint of economic activity.13 In this respect, and on aggregate, Brazil appears to be at the lower end of use of ICT inputs to produce non-ICT exports (Figure 2.11). However, this reflects, in part, that Brazil is a natural resource exporter and that these sectors tend to rely less on ICT inputs.
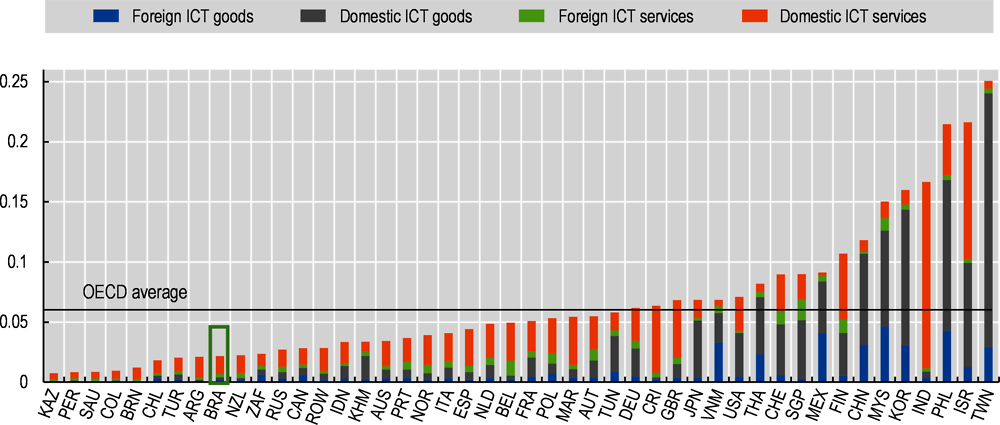
Note: ICT use comprises ICT goods (ISIC rev 4 sector 26) and ICT services (ISIC rev 4 sectors 61 to 63). Values identify the value added of ICT goods and services as a share of total non-ICT exports.
Source: Own calculations using OECD TiVA ICIO (2018).
Indeed, when looking at ICT use across sectors, Brazil exhibits a higher use of ICT inputs in the production of non-ICT exports than the rest of the world in mining, quarrying and food production (Figure 2.12). However, the relative use of ICT goods and services in other sectors is otherwise low, including in important export sectors such as agriculture, forestry and fishing.
Before turning to a more detailed analysis of the use of ICT in the production of exports across different sectors, it is worth noting that differences in use of ICT can arise for reasons beyond differences in the adoption of outsourced ICT technologies. For instance, they may reflect different export product compositions within broad industrial categories. That is, it might be that some form of agriculture production has the potential to be more ICT intensive than another (aggregation bias). If a country trades a particular product more intensively then this will be reflected in the ICT use shares provided. Nevertheless, within broadly similar aggregates, the analysis can provide useful guidance on comparative performance.
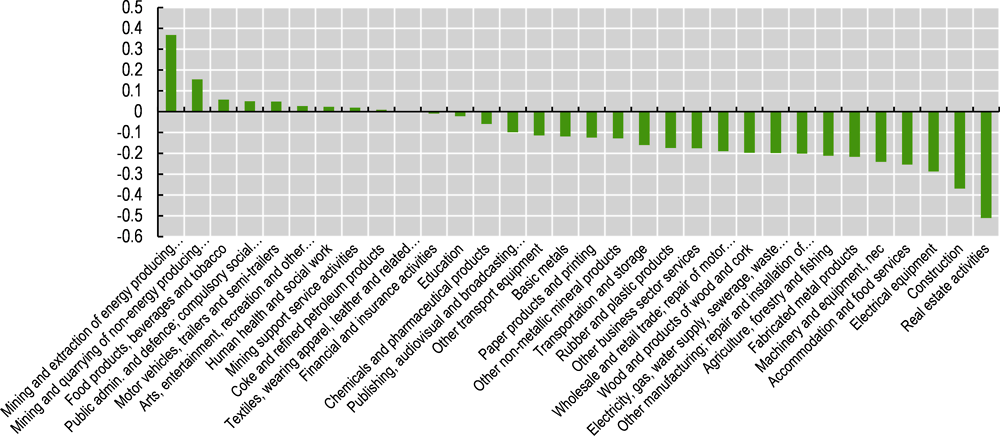
Note: The figure shows the share of ICT goods and services inputs used by Brazil divided by the share of ICT goods and service inputs used by the rest of the world across a range of sectors. Positive values identify a higher use of ICT inputs by Brazil than other countries. ICT inputs are ICT goods (ISIC rev 4 sector 26) and ICT services (ISIC rev 4 sectors 61 to 63).
Source: Own calculations based on OECD TiVA database (2018).
Use of ICT inputs in agro-food exports
Agro-food products represents about a third of Brazil’s total goods and services exports, in turn representing around 5.4% of global agro-food trade. In terms of average use of ICT inputs, whether domestic or imported, the agro-food sector is at the lower end of the spectrum – on average, only about 1.1% of the value of global agro-food exports are composed of ICT inputs.14 However, Brazil has an even lower content of ICT inputs in its agro-food exports (around 1%), largely driven by a low use of ICT inputs in agriculture rather than in food sectors (Figure 2.13).15
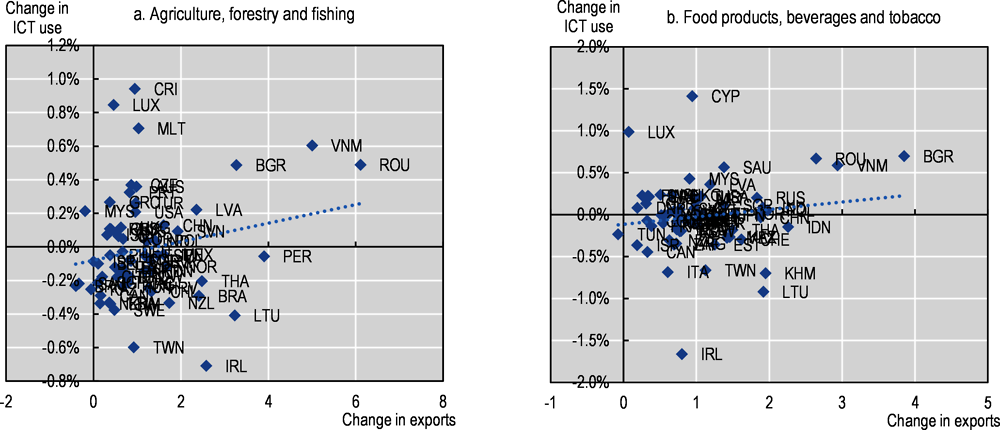
This shortfall matters because positive changes in ICT use as a share of agro-food exports are associated with positive changes in gross exports (Figure 2.14). Brazil may therefore not be making the most out of ICT inputs to develop its agro-food exports which represent a significant share of total merchandise exports. More needs to be done to enable a greater use of ICT technologies in production and trade, especially in agriculture, forestry and fishing.
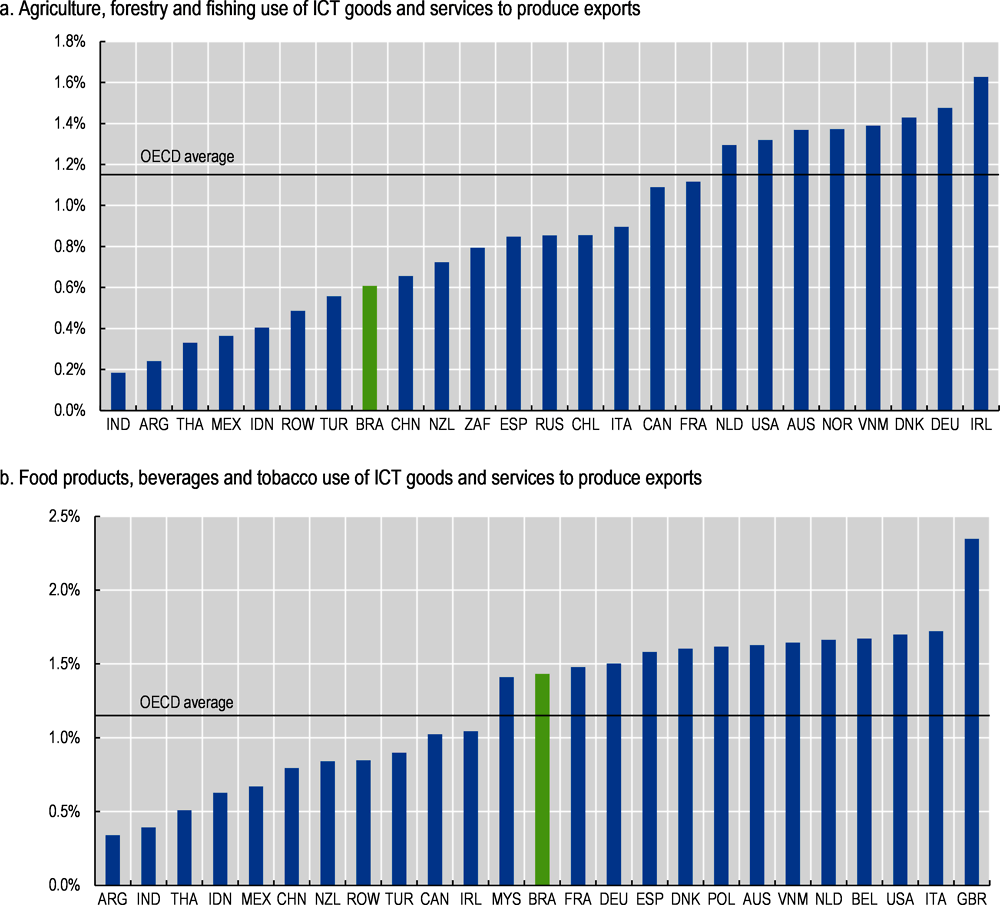
Note: The figure shows the value of ICT inputs (domestic and imported) in the production of sectoral exports for the top 25 producers of agro-food trade. ICT use comprises ICT goods (ISIC rev 4 sector 26) and ICT services (ISIC rev 4 sectors 61 to 63).
Source: Own calculations based on OECD TiVA database (2018).
Note: The horizontal axis identifies the percentage changes in the value of exports net of ICT inputs. The vertical axis shows the percentage point change in the use of ICT inputs as a share of exports. ICT use comprises ICT goods (ISIC rev 4 sector 26) and ICT services (ISIC rev 4 sectors 61 to 63) and includes domestic and international value added.
Source: Own calculations from OECD TiVA 2018.
Use of ICT inputs in mining sectors
The two sectors of activity with the highest relative use of ICT inputs in Brazil are mining and extraction of energy producing products and mining and quarrying of non-energy producing products (Figure 2.15). The ICT content of Brazilian mining and extraction exports is the 5th highest in the world in a sector that represents just below 5% of Brazilian goods and services exports in 2016 and 1.16% of global goods and services trade. In turn, the ICT content of mining and quarrying of non-energy producing products is also within the top ten. This is a sector which represents 7% of Brazilian gross exports of goods and services, which, in turn, represents 7% of global trade in this sector. High ICT use is likely to reflect a more advanced exploitation of digital technologies in these sectors contributing to Brazil’s strong comparative advantage.
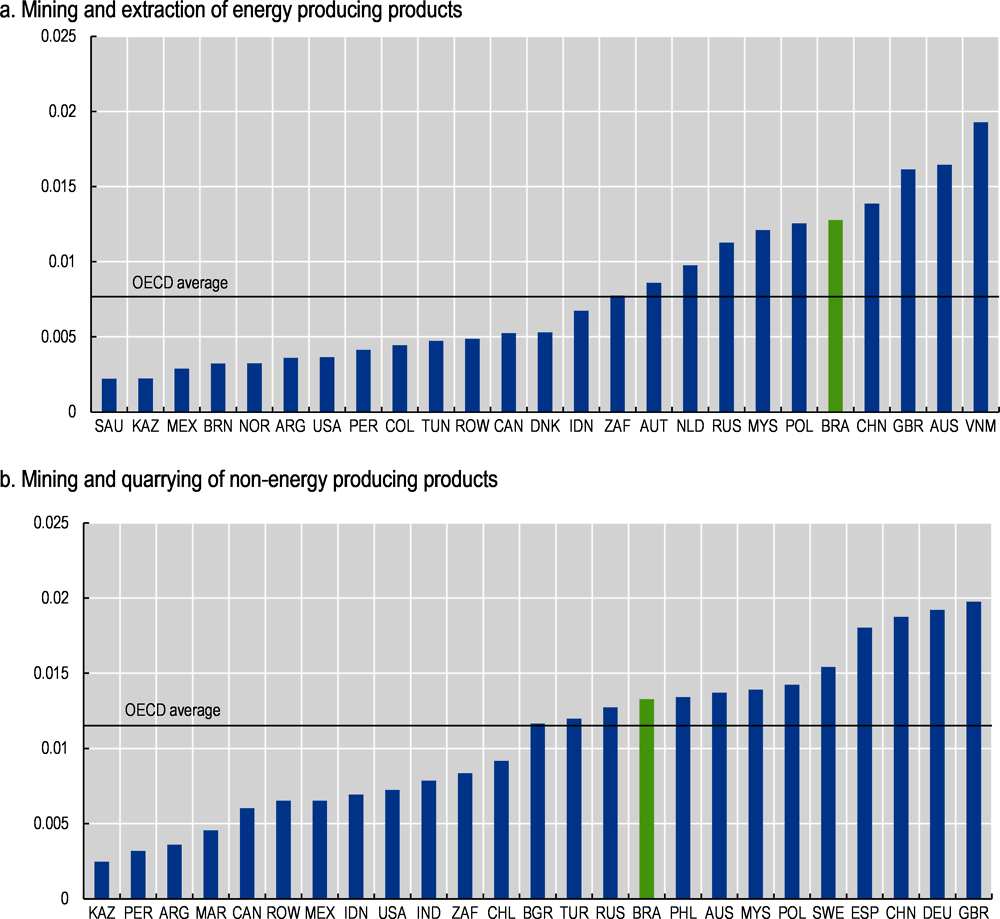
Note: The figure shows the value of ICT inputs (domestic and imported) in the production of sectoral exports for the top 25 producers of Mining and mining and quarrying. ICT use comprises ICT goods (ISIC rev 4 sector 26) and ICT services (ISIC rev 4 sectors 61 to 63).
Source: Own calculations based on OECD TiVA database (2018).
Use of ICT inputs in manufacturing exports
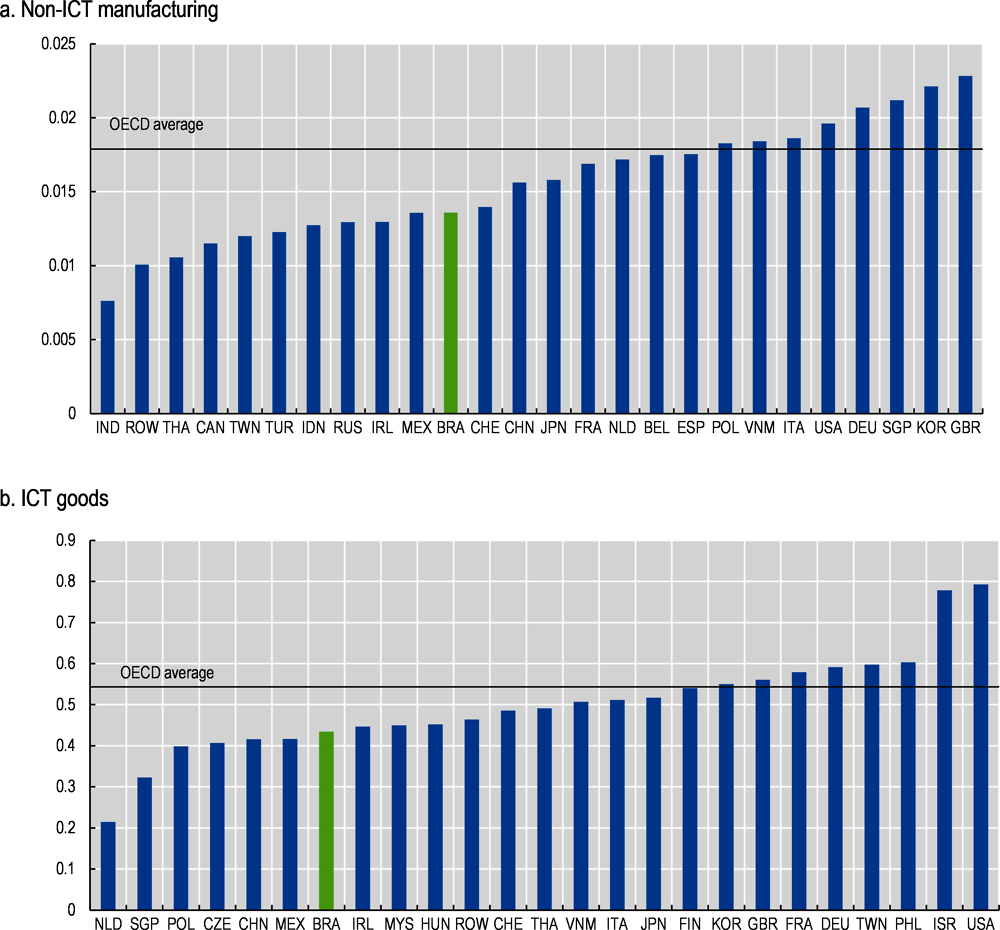
Manufacturing exports represented 35% of Brazil’s exports of goods and services in 2016 (key export sectors include basic metals and motor vehicles occupying 7.3% and 5.5% of gross exports of goods and services). While there is heterogeneity in the use of ICT inputs across sectors, including in motor-vehicles where Brazil is above world averages, the use of ICT inputs in Brazil’s manufacturing exports is, relative to other countries, low (Figure 2.16). This is especially the case in the production of ICT goods where Brazil does not appear to have a comparative advantage and where the use of ICT inputs as a share of exports is much lower than OECD averages.
Note: The figure shows the value of ICT inputs (domestic and imported) in the production of manufacturing exports for the top 25 producers of manufacturing exports globally. ICT use comprises ICT goods (ISIC rev 4 sector 26) and ICT services (ISIC rev 4 sectors 61 to 63).
Source: Own calculations based on OECD TiVA database (2018).
Use of ICT inputs in services exports
Services exports represent about a quarter of Brazil’s gross exports with wholesale and other business services representing half of exported services. However, the use of ICT inputs in these sectors remains low relative to other countries and well below OECD averages although use of ICT inputs in ICT exports are high (Figure 2.17).
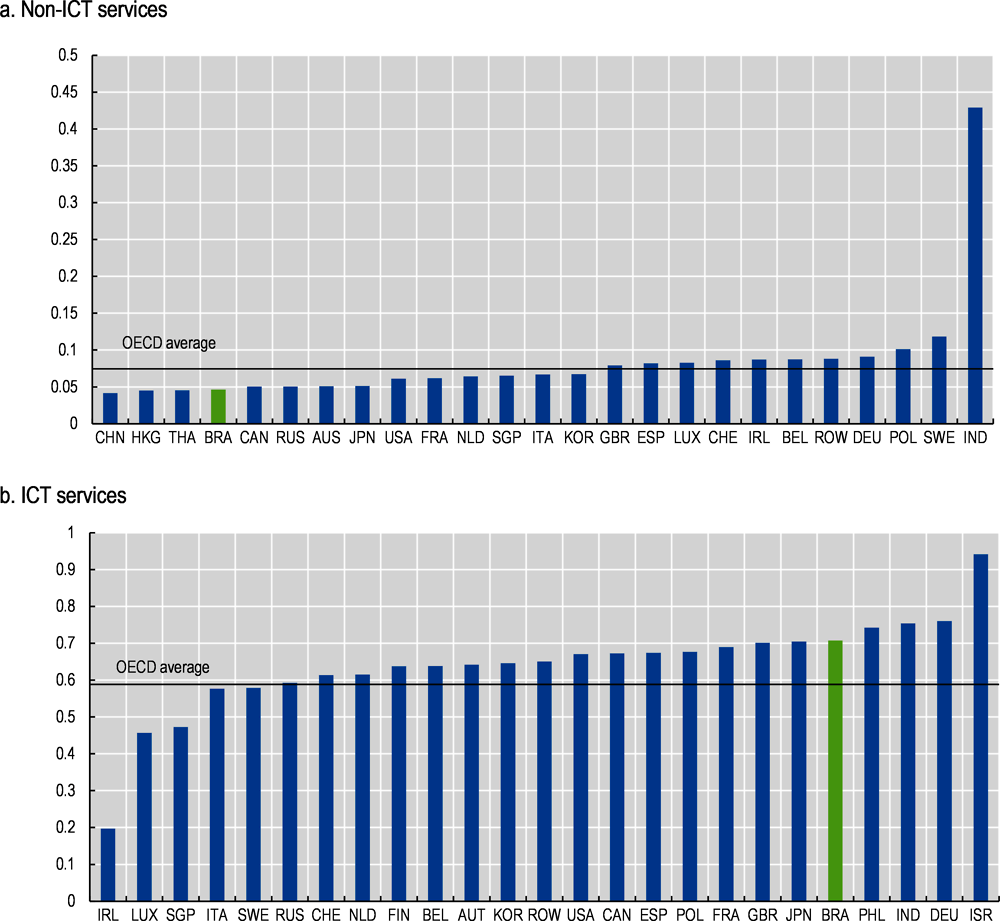
Note: The figure shows the value of ICT inputs (domestic and imported) in the production of services exports for the top 25 producers of services exports globally. ICT use comprises ICT goods (ISIC rev 4 sector 26) and ICT services (ISIC rev 4 sectors 61 to 63).
Source: Own calculations based on OECD TiVA database (2018).
The wider use of digital platforms to order goods has contributed to a dramatic increase in the number of parcels crossing borders. By some estimates, over the last decade, the volume of cross-border parcel trade has grown over three times faster than the volume of global merchandise trade (UPU, 2020[13]). Compared to ‘traditional’ container trade, parcel trade involves a more complex network of interlinked actors and policies. This means that ensuring that parcels get to where they are needed requires policy action across a diverse set of issues, including in the context of physical distancing as a result of the COVID-19 pandemic.
Measuring trade in parcels is difficult. Most parcels are delivered by post or via courier services and fall under de minimis thresholds. This means that they are often not captured in customs statistics. Still, estimates suggests that parcel trade is growing and that it amounts to an average of 1-3% of total trade (with cited peaks of up to 15% in countries like Azerbaijan) (OECD-WTO-IMF, 2020[1]). At the same time, while there is likely to be a strong correlation between trade in parcels and digital ordering, not all trade in parcels will be digitally ordered. That said, recent analysis shows that parcel trade might be more sensitive to digitalisation than traditional trade, that is, that progress in connecting individuals and firms to the internet might increase trade in parcels more than ‘traditional’ trade (López González and Sorescu, 2021[14])). However, owing to the paucity of data, any analysis of trade in parcels has to proceed with care, using available statistics to shed lights on different elements of this evolving environment.
2.3.1. Smaller firms are especially reliant on parcels to export
Although only capturing certain aspects of trade in parcels, insights can be gleamed from looking at trading activities by postal mode of delivery (see also López González and Sorescu (2021[14])). This, however, is an imperfect measure of trade in parcels. On the export side, most small operations are carried out via a simplified export declaration (DSE) which has a more simplified procedure for data collection and weak validation (this was discontinued on 2018). On the import side, parcels are often dealt with by postal services and due, to challenges in filling out documentation as well as lower use of automated declaration of information on cross-border transactions, are often not captured in trade statistics. These are the traditional challenges associated with capturing trade in parcels as noted in the Handbook for Measuring Digital Trade.
Data on modes of delivery, obtained from the SECEX database, while unable to capture the overall volume of trade in parcels, can help understand certain facets of this evolving environment related to changes and trends in cross-border trade, firm characteristics and main sectors of activity.
Where changes are concerned, since 2014, the number of firms exporting using postal delivery increased nearly six-fold with an even higher increase in the value of this trade (nearly nine-fold). Although only capturing part of the value of trade in parcel exports, these numbers suggest that there has been fast growth in this form to trade, likely related to growing adoption of digital technologies (Figure 2.18).
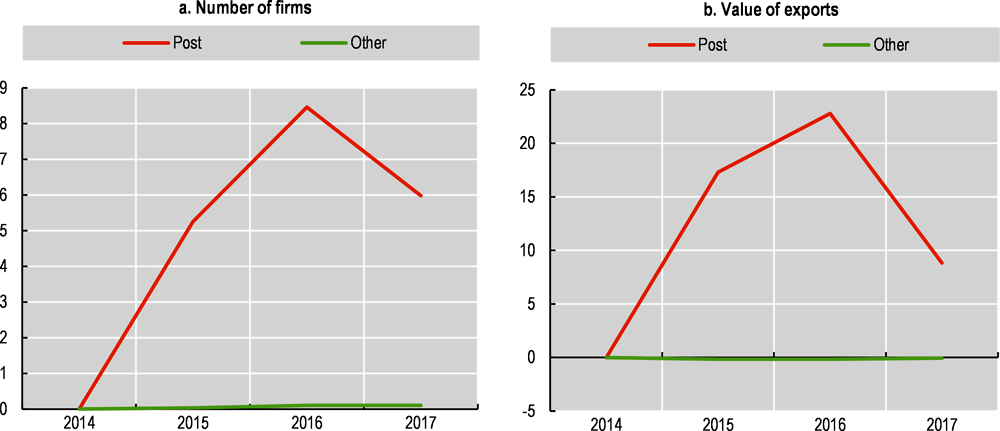
Note: The figure maps the number of firms and the value of exports by mode of delivery. Post includes those items that have been sent via the post while other includes items sent via land, air and water transport.
Source: Author’s calculations based on SECEX.
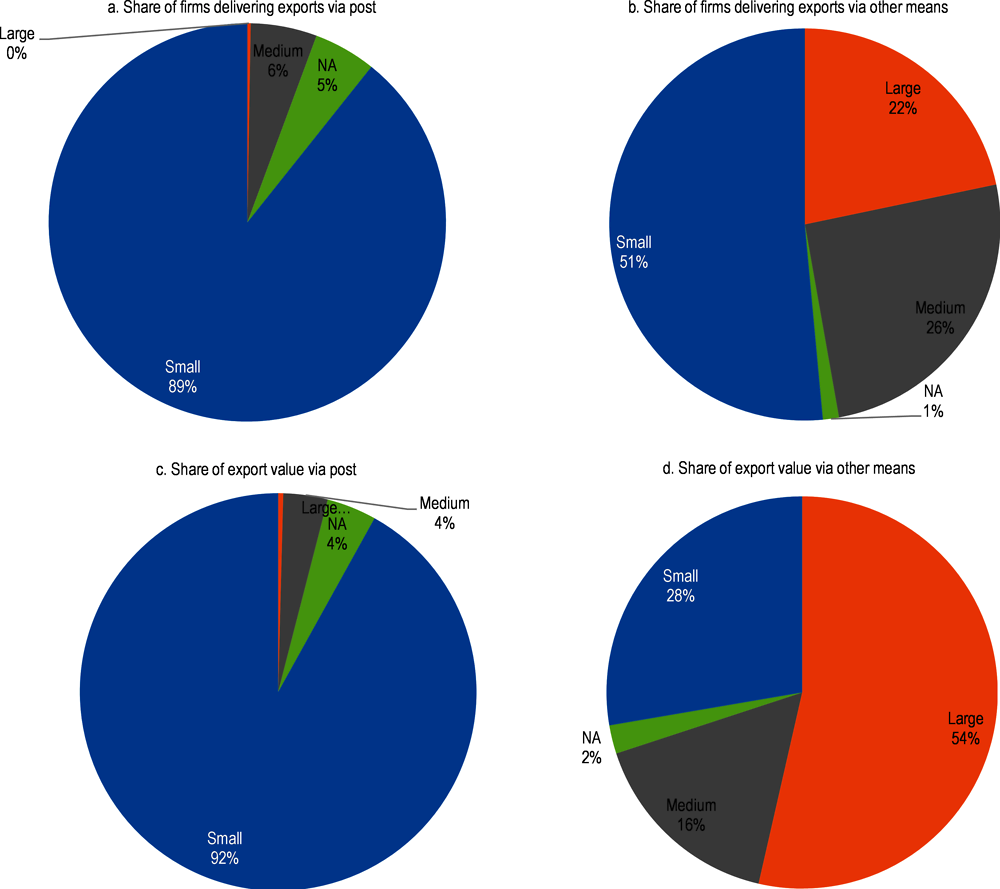
The products exported via parcels differ significantly from those exported by other means. The number of goods exported is relatively limited but has grown, from 40 in 2014 to 189 in 2017. By contrast, Brazil exported 2912 products by other means in 2014 and 2949 in 2017 (Table 2.1).
Parcel exports in Brazil also have a higher value to weight ratio and are more concentrated. The top 10 parcel exports occupy 64% of exports via parcels while the equivalent across the different modes of exports is 48%. At the same time, parcel trade appears to occupy final products, largely in manufacturing sectors (Table 2.2), in contrast to the structure of Brazil’s exports which tend to be natural resource based (Chapter 1).
2.3.2. Postal services provide foundational support to trade in parcels
Part of the regulatory environment that matters for parcel trade relates to the ability to receive goods and to get these to the border. In this respect, postal services provide foundational support to trade in parcels. Relative to other neighbouring countries, Brazil performs well in terms of coverage of postal services (Table 2.3). That is, it has one of the highest staff per office ratio and offices that are relatively well connected to electronic networks. At the same time, the share of the population receiving mail at home is above 97% with only 1.5% of the population without postal services (the lowest among those sampled).
However, parcel trade might be curtailed by existing measures that affect post and courier services. According to the OECD STRI, Brazil is the third most restrictive country (out of 44) in the courier services sector. At the same time, Brazil’s existing de minimis regime covers postal packages valued at USD 50 or less shipped for personal (non-commercial) purposes meaning that many parcels, even those of little value, have to be cleared at customs and pay border and internal taxes. This goes against the existing trend where countries have increasingly adapted and expanded their de minimis levels to cater for growing trade in parcels (See Chapter 4 for a discussion of the environment faced by parcels in Brazil).
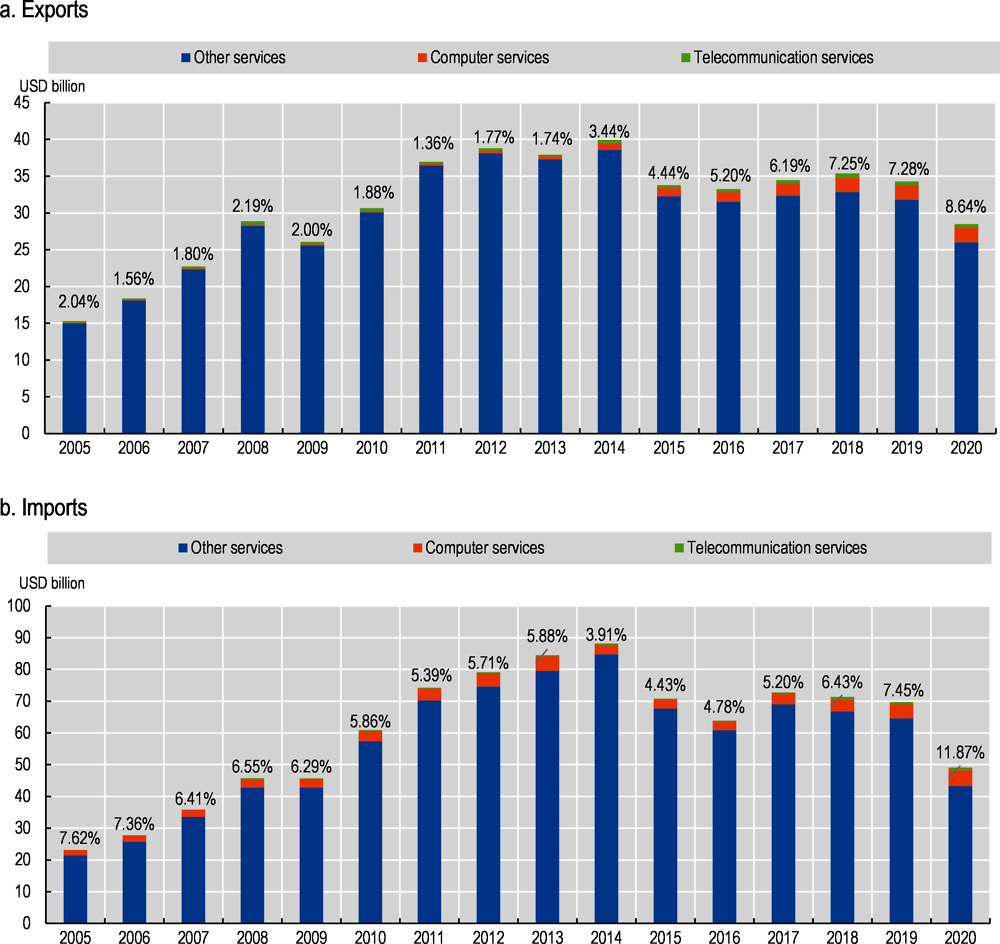
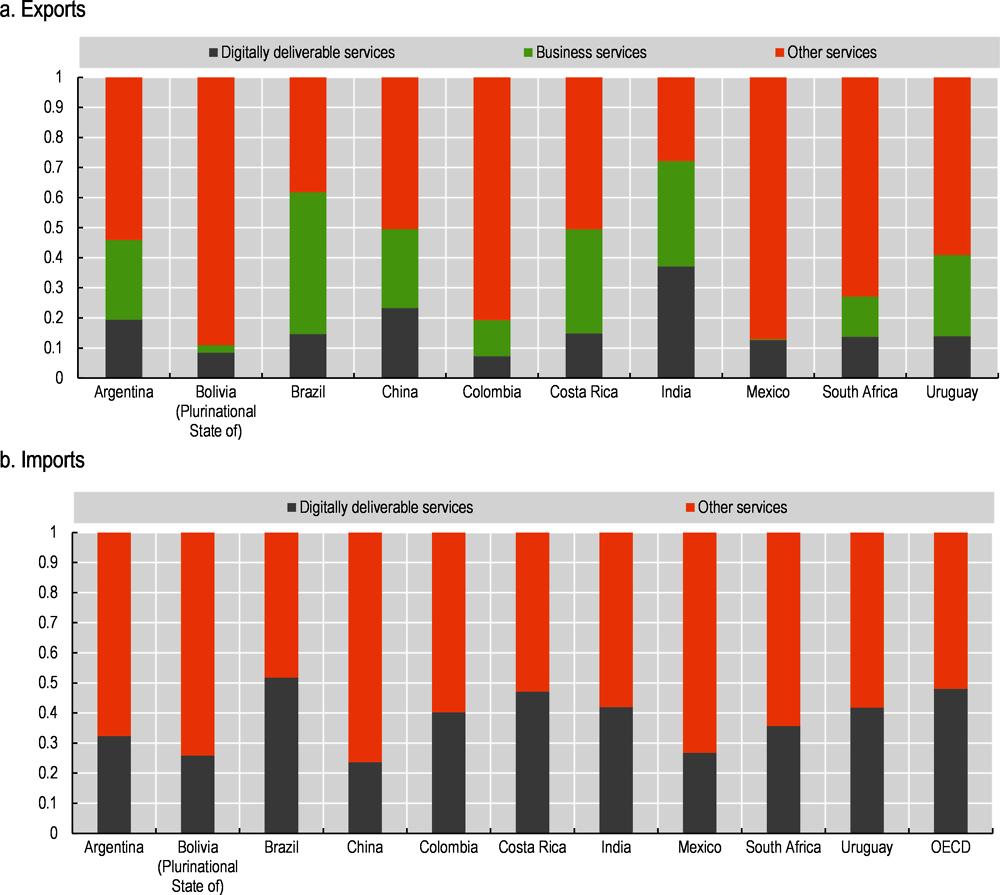
Digitally deliverable services are those that can be delivered over digital networks (OECD-WTO-IMF, 2020[1]). They include ICT services (i.e. computer and telecommunication services) and other business services such as financial or consultancy services and audio-visual services. Digitally deliverable services play an important role in Brazil’s exports and imports (Figure 2.20), accounting for 61.7% of services exports and 51.7% of services imports in 2018. This is significantly higher than most trade partners in the region and also high by OECD standards.16
Over time, the share of digitally deliverable services imports has been relatively stable, representing around half of Brazil’s services imports, with the exception of 2020 when they experienced a notable expansion (Figure 2.21). However, digitally deliverable services exports have witnessed a sustained upward trend, growing from 47% of total services exports in 2005 to 62.9% in 2019, just before the COVID-19 pandemic. Despite the overall decrease in the value of services trade as a result of COVID-19 in 2020, the share of digitally deliverable exports rose. This sustained growth was fuelled by exports of computer services (growing from USD 80 million in 2005 to USD 1.99 billion in 2019 and to 2.07 billion in 2020, despite COVID-19) and professional and management consulting services (from USD 500 million in 2005 to USD 4.38 billion in 2019, and USD 3.98 billion in 2020).
Note: Digitally deliverable services are defined using the Digital Trade handbook definition (OECD-WTO-IMF, 2020[1]) – corresponding to UNCTAD’s ICT-enabled services definition, as platform services and mode 1 travel services could not be separately identified in the available Balance of Payments (BoP) data. Due to unequal coverage in sector aggregation across countries and to facilitate cross-country comparison, digitally deliverable services are distinguished in broader sector categories in EBOPS. Relative to the handbook definition, this leads to the inclusion of EBOPS 10.3.2 (Waste treatment and de-pollution, agricultural and mining services), 10.3.3 (Operating leasing services), 10.3.4 (Trade-related services) and EBOPS 11.2.4 (‘other personal services), in the list of digitally deliverable services. Data on Construction services (in ‘other services’) is missing for Mexico. The OECD aggregation is based on the simple average of ‘digitally deliverable services’ and ‘other services’ shares at the country level. In this aggregation, beyond missing data for Construction services in Mexico, data for Goods-related services, Construction services, and Government goods and services (n.i.e.) is missing for Chile.
Source: UNCTADstat Balance of Payments statistics, year 2018.
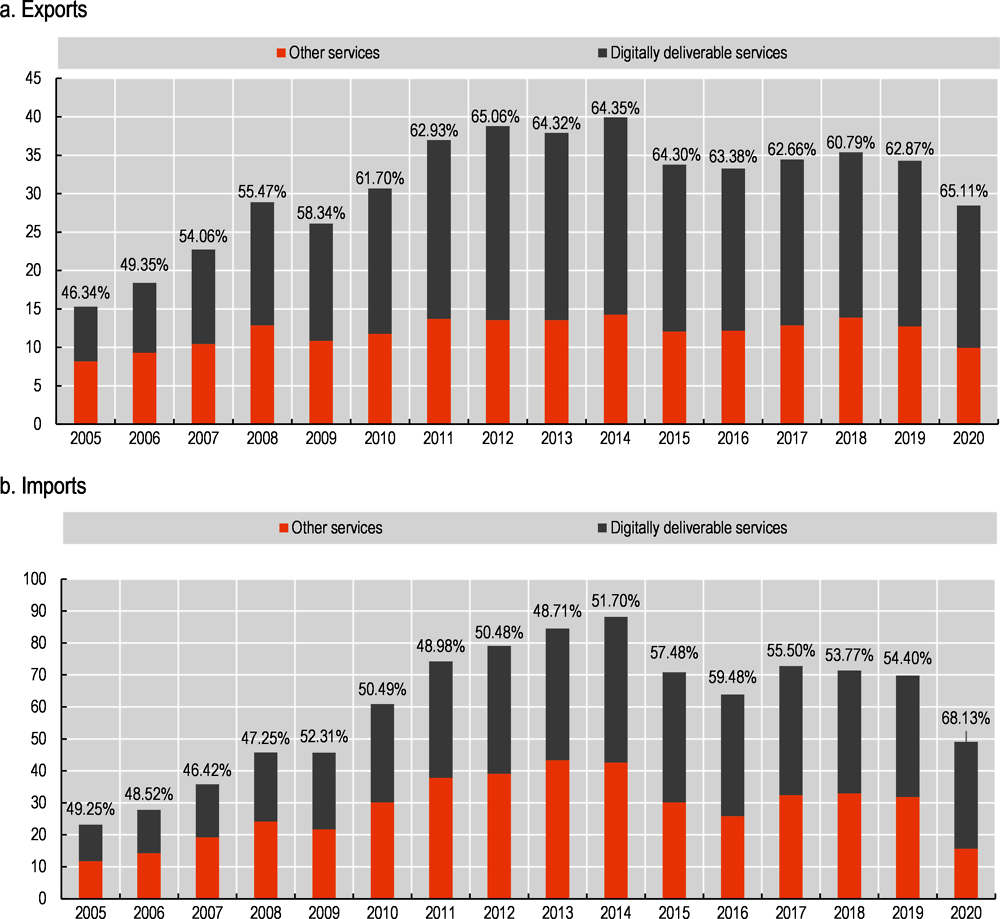
Note: Due to data availability constraints, digitally deliverable services includes EBOPS 10.3.2 (Waste treatment and de-pollution, agricultural and mining services), 10.3.3 (Operating leasing services) and 10.3.4 (Trade-related services), as these could not be individually separated in BoP statistics for Brazil. It includes other personal services (EBOPS 11.2.4) due to similar aggregation issues. Data labels show the value of digitally deliverable services trade as a share of total services trade.
Source: UNCTADstat Balance of Payments statistics.
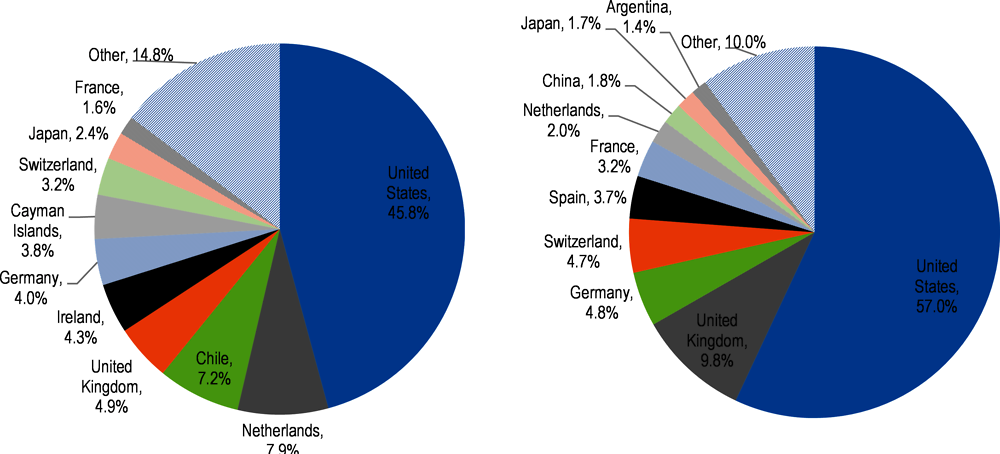
According to firm-level data, the main export destinations for Brazil’s digitally deliverable services include the United States (45.8% of total digitally deliverable exports), followed by the Netherlands (7.9%) and Chile (7.2%). The main products exported were professional, technical and business services and information technology services (Figure 2.22). Brazil mostly imports IP and business services from the United States (57.0% of total digitally delivered services imports), services including IT and financial services from the United Kingdom (9.7%), and services including financial and business services from Germany (4.7%).
Note: The figure is obtained through a correspondence between ICT-enabled services in EBOPS as per OECD-WTO-IMF (2020[1]) and Brazil’s NBS classification for trade in services, at the NBS 5-digit level of aggregation.
Source: Authors’ calculations based on SISCOSERV.
2.4.1. Digitally deliverable services tend to reach larger and more distant markets
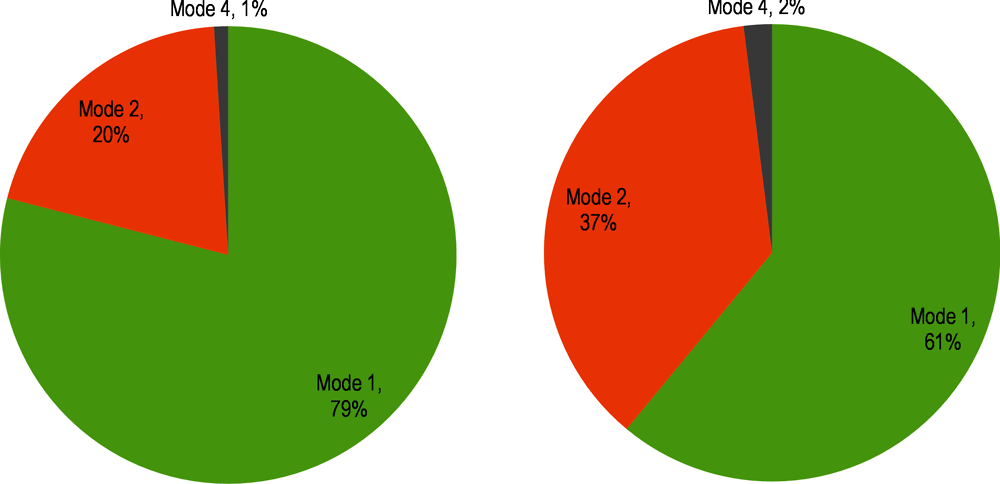
Globally, firms operating in digitally deliverable service sectors tend to export to larger and more distant markets (Figure 2.23). This is likely due to the ability to deliver trade across international borders via digital transfers (Mode 1); see Box 2.3 for a description of the different modes of supply for services.
There are four modes of supply for services.
Mode 1, cross-border trade, involves the supply of a service to a customer located abroad (e.g. the provision of cloud services by an IT company in Brazil to a firm in Argentina).
Mode 2, consumption abroad, is where a service is consumed in a foreign country (e.g. a tourist purchasing accommodation services while travelling through Brazil).
Mode 3, commercial presence, occurs when a company based in one country establishes a commercial presence in another to serve the local market (e.g. a Brazilian company sets up a branch in the US to distribute its services). Lastly,
Mode 4, presence of natural persons, is when services providers cross border to supply foreign customers (e.g. a Brazilian engineer goes to Chile to provide consultancy services).
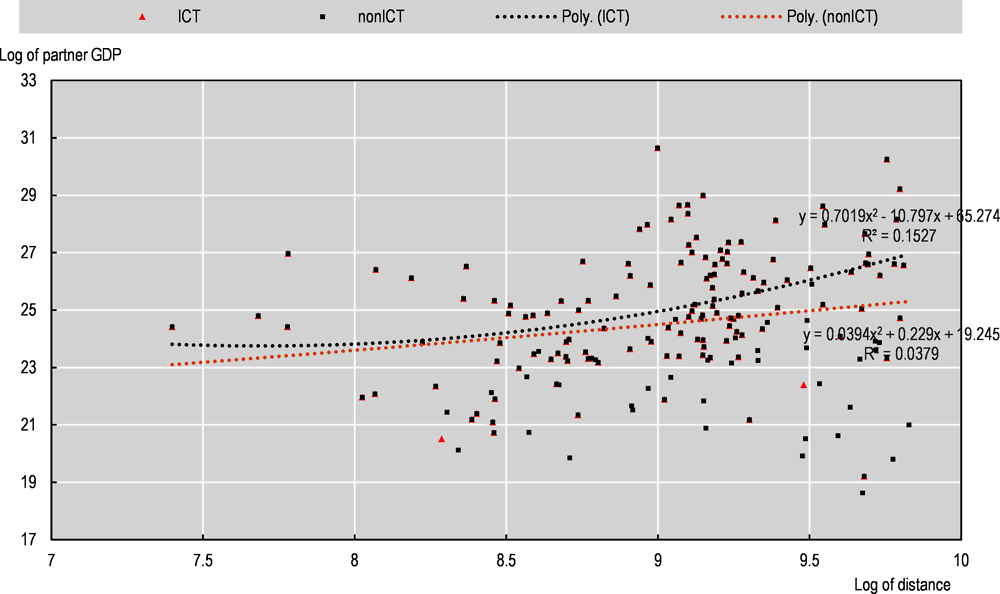
Note: The figure plots average trade distance of partner country against average GDP of partner country across a number of digitally deliverable services (called here ICT) sectors and non ICT sectors. Points further away from the origin reflect trade with more distant and larger partners while points closer to the origin show more proximous and smaller partners.
Source: OECD calculations on SISCOSERV, CEPII’s gravity (distance), WDI database (GDP, current USD).
As might be expected, digitally deliverable services are largely supplied via mode 1. In Brazil, 79% of digitally deliverable services trade are supplied cross-border contrasting with 61% for other services trade (Figure 2.24). Mode 2 still represents 20% of digitally deliverable services while it represents 37% of other services exports. Where mode 4 is concerned, this category of services supply is the smallest across both digitally deliverable and other services.
Source: OECD calculations on SISCOSERV.
2.4.2. Exporters of digitally deliverable services include a high share of smaller firms
On average, and except for ‘information services’, ‘licences’ and ‘insurance and finance’, over 50% of exports of digitally deliverable services come from SMEs (Figure 2.25). These also represent the highest share of firms operating in digitally deliverable sectors.
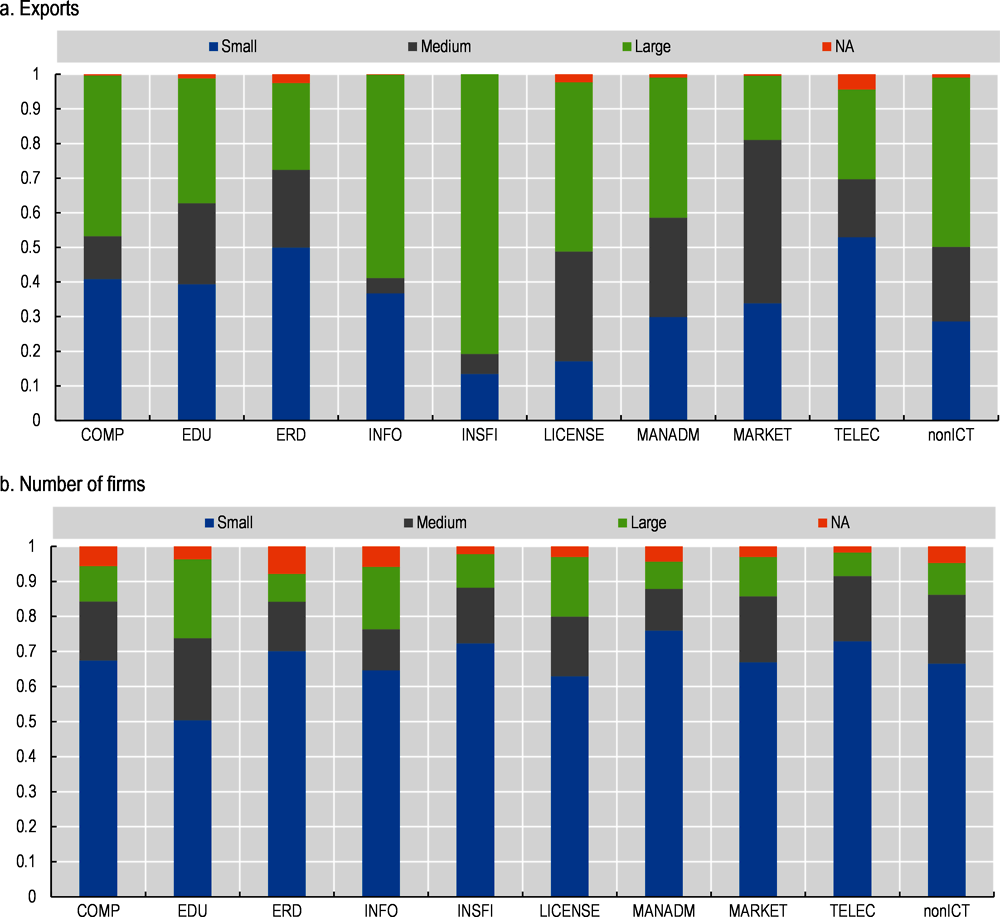
Source: Base de dados do Comércio Exterior Brasileiro.
Source: Own calculations from OECD Inter-Country Input-Output Table.
References
[8] Cadot, O., J. Gourdon and F. Tongeren (2018), Estimating Ad Valorem Equivalents of Non-Tariff Measures: Combining Price-Based and Quantity-Based Approaches, OECD Trade Policy Papers, No. 215, OECD Publishing, Paris,, https://doi.org/10.1787/f3cd5bdc-en.
[12] López González, J. et al. (2019), “Participation and benefits of SMEs in GVCs in Southeast Asia”, OECD Trade Policy Papers, No. 231, OECD Publishing, Paris, https://dx.doi.org/10.1787/3f5f2618-en.
[14] López González, J. and S. Sorescu (2021), “Trade in the time of parcels”, OECD Trade Policy Papers, No. 249, OECD Publishing, Paris,, https://doi.org/10.1787/0faac348-en.
[10] Maertens, M. and J. Swinnen (2007), “Standards as Barriers and Catalysts for Trade and Poverty Reduction”, Journal of International Agriculture Trade Development, Vol. 4, pp. 47-61.
[5] OECD (2020), Going Digital in Brazil, https://doi.org/10.1787/e9bf7f8a-en.
[6] OECD (2020), Leveraging digital trade to fight the consequences of COVID-19, https://www.oecd.org/coronavirus/policy-responses/leveraging-digital-trade-to-fight-the-consequences-of-covid-19-f712f404/.
[4] OECD (2020), Opportunities and challenges for trade in the digital era.
[3] OECD (2019), Measuring the Digital Transformation: A Roadmap for the Future, OECD Publishing, Paris, https://dx.doi.org/10.1787/9789264311992-en.
[2] OECD (2018), How to deal with globalisation in the framework of national accounts, http://www.oecd.org/iaos2018/programme/IAOS-OECD2018_Schreyer-vandeVen-Ahmad.pdf.
[1] OECD-WTO-IMF (2020), Handbook on Measuring Digital Trade, https://www.oecd.org/sdd/its/Handbook-on-Measuring-Digital-Trade-Version-1.pdf.
[9] Swinnen, J. (ed.) (2007), The Costs and Benefits from Compliance with Food Safety Standards for Exports by Developing Countries: The Case of Fish and Fishery Products, Oxford, UK: CABI, pp. 26-41.
[15] UNCTAD (2012), International classification of non-tariff measures, https://unctad.org/system/files/official-document/ditctab20122_en.pdf.
[13] UPU (2020), Postal Statistics.
[7] WTO (2015), “Trade Policy Uncertainty as Barrier to Trade”, WTO Working Papers, No. 2015/05, World Trade Organization, Geneva, https://dx.doi.org/10.30875/6c9ef04c-en.
[11] Xiong, B. and J. Beghin (2014), “Disentangling Demand-enhancing and Trade-cost Effects of Maximum Residue Regulations”, Economic Inquiry, Vol. 52, pp. 1190-1203.
Notes
← 1. Efforts are already underway to tackle issues arising from digital divides. Policies supporting greater access in rural areas as well as free-of-charge programmes and tax incentives (Programa Nacional de Banda Larga) are underway (OECD, 2020[5]).
← 2. Indeed, in recognition to the role of ICT devices, the Federal Government established, in 2005, the Lei do Bem (11,196/2005) seeking to incentivise purchases of digital enablers by providing tax exemptions for retail sales as well as for smartphones. This law was later discontinued.
← 3. According to the WTO Integrated Database (IDB), 37% of the total specific tariff lines containing Electronic components received duty-free treatment (i.e. zero tariffs) in 2021, with tariffs imposed on the remaining 63% of HS lines explaining the overall tariff level in this category.
← 4. The TRAINS database is coordinated by UNCTAD: “Based on the MAST classification, UNCTAD has been collecting data on NTMs since 2012. Today, with the collaboration with partner agencies including ITC, WTO, and World Bank among others, UNCTAD features comprehensive and comparable trade Regulations and NTM data for 109 countries (covering more than 65000 measures).” See https://trainsonline.unctad.org/about
← 5. According to the TRAINS NTM database, TBT measures covering ICT goods are related to, for instance, ‘Portaria Nº004 de 4/I/11’, ‘Decreto Nº62465 de 26/03/1968. Reglamento de la Ley 5280/67.’ And ‘Decreto Nº96036 de 12/05/1988. Reglamento de la Ley Nº7646, de 18/12/1987, implementado por Decreto Nº1207 de 01/08/1994’. Brazilian authorities have informed that: Ordinance (Portaria) Nº004 of 4/I/11 seems to refer to Ordinance (Portaria) No.4 of 1/4/2011 issued by the National Institute of Metrology, Standardization and Industrial Quality (INMETRO), which regulates photovoltaic energy equipment and systems, and that Decree Nº96036 of 05/12/1988; Law Nº7646, of 12/18/1987; Decree Nº1207 of 08/01/1994 have been revoked. They have also informed that Decree Nº62465 of 03/26/1968 was revoked by Decree s/nº of 04.25.1991, DOU 04.26.1991. They have also informed that Law 5280/67 is in force, but that the above decree which regulates it was revoked.
← 6. According to the TRAINS NTM database, these measures are related to ‘Portaria Nº23 de 14/07/2011’ and Portaria Nº10 de 25/1/2010. Modificada por Portaria Nº562 de 23/12/2014. Brazilian authorities have informed that Ordinance Nº10 of 01/25/2010 and Ordinance 562 of 12/23/2014 seem to refer to ordinances issued by the National Institute of Metrology, Standardization and Industrial Quality (INMETRO) which regulate the safety of electrical appliances for household and similar purposes, in line with IEC 60335.
← 7. According to the TRAINS NTM database, export-related measures are related to ‘Ley Nº10184 de 12/02/2001. Reglamentado por la Resolución Nº27 de 06/05/2008 y Nº126 de 26/12/2013.’ and ‘Portaria Nº23 de 14/07/2011 y sus modificaciones’.
← 8. For further information on Brazil’s NTMs or their product scope, refer to https://trainsonline.unctad.org/home. See a list of the different types of non-tariff measures in Annex Table 2.A.1.
← 9. It should however be noted that legislative changes (e.g. repeal of measures) occurring between the last update of the dataset (2020) and the time of writing are not captured by this analysis.
← 10. The SPS measure, classified as A83 in the international classification of Non-Tariff Measures, is related to ‘Portaria Nº23 de 14/07/2011.’
← 11. It should, however, be noted that Brazil does not have price control measures (F) or Measures affecting competition (H) on ICT goods, which are not included in Figure 2.6 because information on these NTM types is not available for all comparator countries.
← 12. Figure 2.9 uses data from the SISCOSERV firm-level database, based on the NBS services classification. This means that ICT service sectors are identified in the NBS nomenclature and that they are not directly comparable to statistics from the Balance of Payments (i.e. Figure 2.8).
← 13. Noting that input-output tables generally capture the use of ICT goods and services from external sources (outside of the firm/factory) rather than the extent to which ICT inputs are being used within the firm or factory.
← 14. Calculations are based on OECD TiVA data for 2016.
← 15. These figures are, in part, driven by the types of products produced across different countries and are therefore subject to some aggregation bias. Some sectors could be more digitisable than others within broad identified categories.
← 16. It should, however, be noted that this is a high estimate as there are some sectors within the broad category of business services that may not be considered as digitally deliverable (see note to Figure 2.20).