
6. Inclusion, quality of life and COVID-19
The impacts of COVID-19 on quality of life have not been distributed evenly across the populations of OECD countries. While men and the elderly were more likely to die from the virus, women and young people have been more likely to suffer a deterioration in mental health and life satisfaction. People on lower incomes or without employment and/or members of racial and ethnic minority groups are more likely to experience worse physical and mental health outcomes. Children from disadvantaged households are at risk of being left behind as schools shift to remote learning, widening existing gaps in knowledge and skills. Inequalities in access to green space, which helps bolster mental well-being, further disadvantage low socio-economic and racial and ethnic minority groups during lockdowns.
6.1.1. Excess mortality
Men, the elderly, racial and ethnic minorities and those from lower socio-economic status had the highest rates of excess mortality over the first year of the pandemic
The risk of death from COVID-19 is slightly lower for women than for men. Statistics on the total number of deaths from 29 OECD countries show that deaths for men increased by 15% over the first year of the pandemic, compared to 2015-19 averages, compared to only 12% for women.1 The same pattern of higher excess deaths for men holds in 26 of the 29 OECD countries for which data are available (Figure 6.1, Panel A). Across the OECD, excess deaths first peaked in April 2020, before subsiding from May to September, and then steadily rising again through the end of 2020; the overall pattern is similar across genders, though male rates are higher for all months (Figure 6.2). Even though women are at a lower risk of death, they are more likely to suffer long-term symptoms of COVID, including extreme tiredness, shortness of breath and chest pain (often termed “long COVID”). For example, two studies in the United Kingdom found that women aged 40-60 were more likely to have worse long-term health outcomes than men who had also contracted COVID, even if they did not have any pre-existing health problems (Kelland, 2021[1]). Similarly, a hospital in France reported that, among the 30 cases of long COVID treated from May to July 2020, female patients outnumbered males by 4 to 1 (Chinnappan, 2021[2]). Data from the United Kingdom Office for National Statistics show that long COVID is most common in women, those aged 35 to 69, those from low-income areas and those with pre-existing medical conditions (see Box 6.1).
Especially in the early stages of the pandemic, the elderly had much higher excess mortality rates than other age cohorts (Figure 6.2). The population aged 65 and over had the highest increase in total deaths over the first year of the pandemic in all but two OECD countries with data (Figure 6.1, Panel B).2 The gaps in excess death rates between those aged 65 and over and those aged 45-64 peaked in April 2020 before dropping sharply from May through September 2020 – a period that coincided with an overall drop in COVID-19 cases in many OECD countries.3 However, the gap increased again, surpassing the initial peak, from October to December 2020 (Figure 6.2). As of the beginning of 2021, the gaps in excess death rates between age cohorts have diminished, which may in part be a result of increasing vaccination rates in the older populations beginning early in 2021 (Lu, 2021[3]).
Already pre-COVID, there was ample evidence that those with lower levels of education and income had shorter lives (OECD, 2020[4]; Marmot et al., 2010[5]; Chetty et al., 2016[6]). People with lower levels of education and income are also more likely to suffer from medical conditions that put them at greater risk of COVID infections, such as diabetes (OECD, 2017[7]). Once the pandemic struck, these groups suffered mortality rates higher than the general population. A population-based cohort study in Sweden found that a low level of education also increases the risk of death from COVID-19, even when controlling for other risk factors (Drefahl et al., 2020[8]). According to this evidence, those with only a primary or secondary education may be twice as likely to die from the pandemic. In Germany, data from the second wave of the pandemic (Q4 2020 through Q1 2021) showed that mortality rates in socially disadvantaged regions were 50 to 70% higher than in regions with low levels of social disadvantage (Robert Koch Institut, 2021[9]). Studies in the United States and France, and cross-country studies in Europe, have also shown that poorer regions experienced higher COVID-19 mortality rates (Stantcheva, 2021[10]). A study in Ontario, Canada found that people with a recent experience of homelessness were more likely to contract COVID-19, and once positive, 20 times more likely to be admitted to a hospital, 10 times more likely to need intensive care and 5 times more likely to die of the virus (Richard et al., 2021[11]).
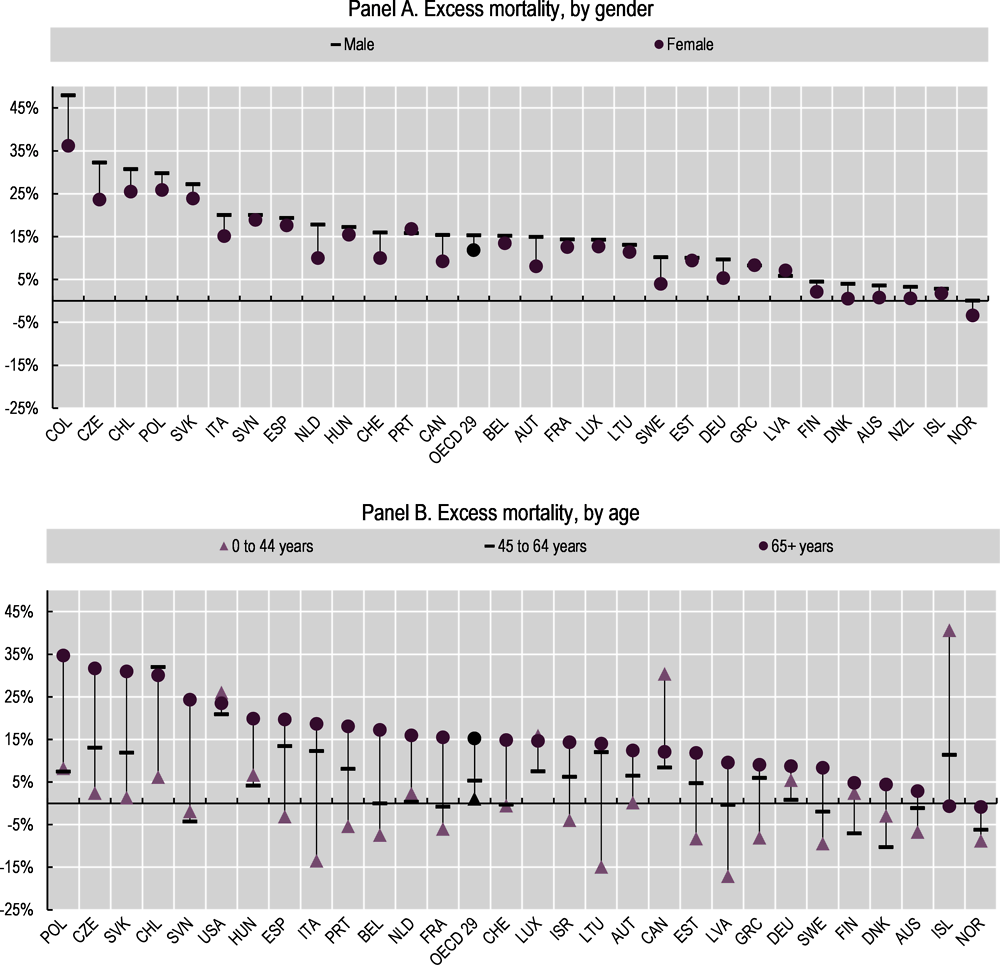
Note: The figure shows the increase in the number of reported deaths from all causes for the period March 2020 (week 11) to early May 2021 (week 18), compared to the average from 2015-2019 for the same period. In Panel A, the OECD average excludes Costa Rica, Ireland, Israel, Japan, Korea, Mexico, Turkey, the United Kingdom and the United States. In Panel B, the OECD average excludes Colombia, Costa Rica, Ireland, Japan, Korea, Mexico, New Zealand, Turkey and the United Kingdom. Data for Chile, Germany and Greece are compared against the average for 2016-2019. Those for Australia refer to doctor-certified deaths only. Deaths for the most recent weeks may be under-reported and subject to revision. Data from week 53 of 2020 are excluded from the overall average.
Source: OECD calculations based on OECD (n.d.[12]), COVID-19 Health Indicators (database), https://stats.oecd.org/index.aspx?queryid=104676#.
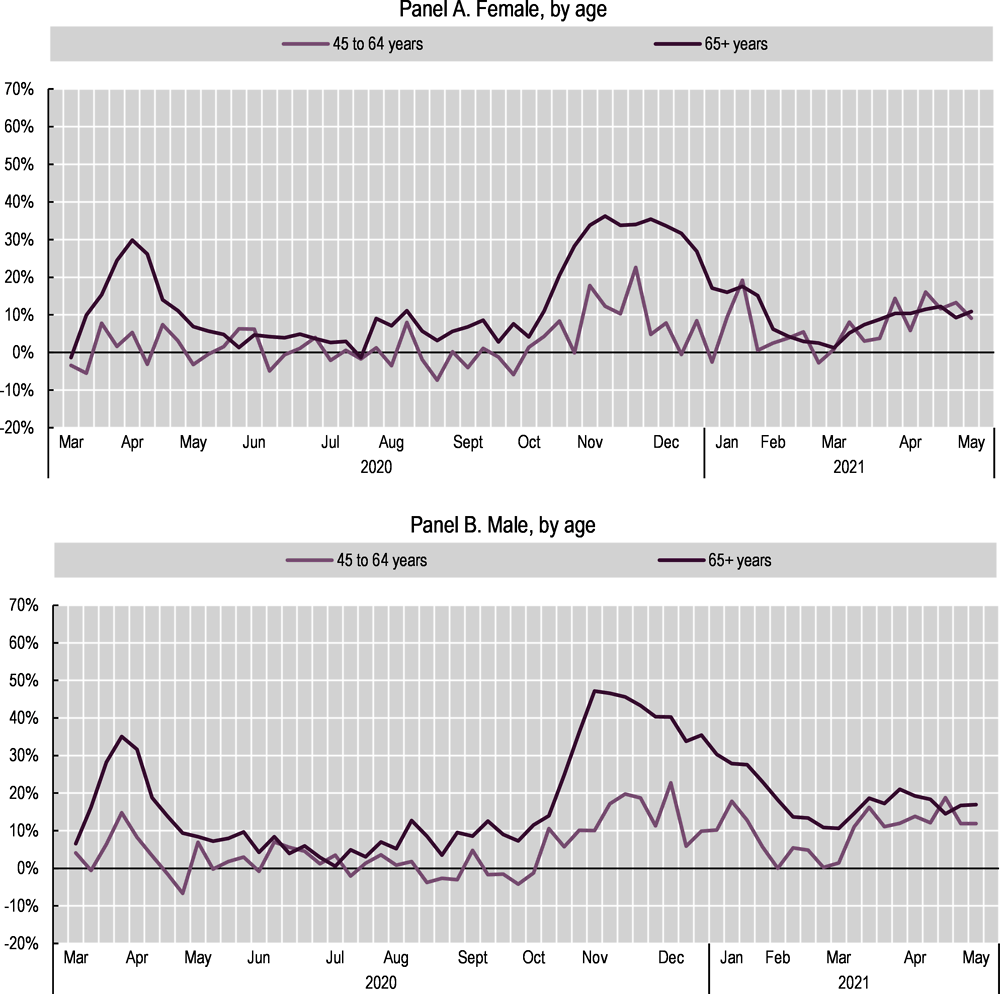
Note: Both panels show excess deaths from March (week 11) 2020 to early May (week 18) 2021. Data refer to outcomes for people aged 45-64, and those aged 65 and over. The OECD average includes Australia, Austria, Belgium, Canada, Chile, the Czech Republic, Denmark, Estonia, Finland, France, Germany, Greece, Hungary, Iceland, Italy, Latvia, Lithuania, Luxembourg, the Netherlands, Norway, Poland, the Slovak Republic, Slovenia, Spain, Switzerland and the United States.
Source: OECD calculations based on OECD (n.d.[12]), COVID-19 Health Indicators (database), https://stats.oecd.org/index.aspx?queryid=104676#.
The United Kingdom’s Office for National Statistics (ONS) administered the Coronavirus (COVID-19) Infection Survey in April-May 2021 to measure the prevalence of long COVID and identify its symptoms. 339 707 individuals over two-years-old living in private households were interviewed from 4 April to 2 May 2021. Parents and/or carers completed the survey for children under 12-years-old. Responses are weighted to be representative by age group, sex and region, and account for non-responses. Prevalence of long COVID was defined as having symptoms that persisted for more than four weeks after the initial onset of infection and that could not be otherwise explained. The data are self-reported, rather than clinical diagnoses, and thus may reflect differences in reporting between socio-demographic groups.
Data from the survey show that as of early May 2021, an estimated 1 million people (around 1.6% of the private household population) were experiencing self-reported symptoms of long COVID-19. The prevalence (and severity) of symptoms was greatest (and most severe) for women (Figure 6.3, Panel A), people aged 35 to 69 (Figure 6.3, Panel B), those living in deprived areas and those with pre-existing conditions. In September 2021, the ONS published updated information, taking into account data up to 1 August 2021, which found that the prevalence of long COVID may be lower than initially thought: 643 000 people in private households may have experienced symptoms of long COVID (rather than 1 million), with anywhere between 3-12% (depending on the measurement approach used) of those who had previously been infected with coronavirus still showing symptoms after 12 weeks. Women continue to have higher prevalence of self-reported long COVID-19, compared to men (ONS, 2021[13]).
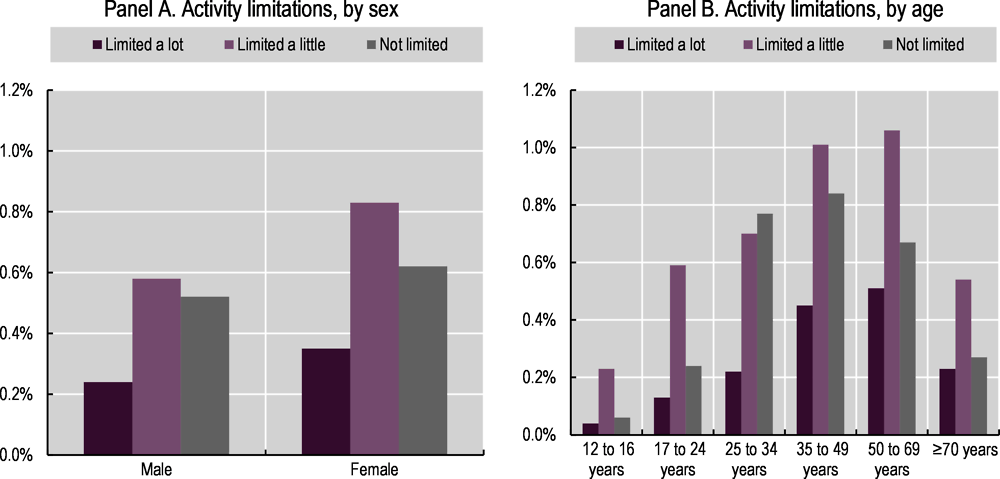
Source: ONS (2021[14]), Prevalence of ongoing symptoms following coronavirus (COVID-19) in the UK (database), Office for National Statistics, https://www.ons.gov.uk/peoplepopulationandcommunity/healthandsocialcare/condisionsanddiseases/bulletins/
prevalenceofongoingsymptomsfollowingcoronaviruscovid19infectionintheuk/4june2021.
The jobs held by low-income, low-education workers also put them at higher risk of infection. In addition to having more pre-existing risk factors, these workers are much less likely to be in roles that enable teleworking (Chapter 5) and much more likely to be working in fields (e.g. essential retail, transport, cleaning and other service jobs) that require them to commute and work in contact with others throughout the pandemic (Finch and Hernández Finch, 2020[15]; Eichenbaum, Rebelo and Trabandt, 2020[16]). A study in the United States found that frontline workers – who were required to continue working in person – have lower levels of education than the population at large: around 70% had less than a university degree (Rho, Brown and Fremstad, 2020[17]). A study on frontline workers in Toronto, Canada found that neighbourhoods with the highest concentration of frontline workers had cumulative per-capita rates of death from COVID-19 that were 2.5 times higher than neighbourhoods with the lowest concentration (Rao et al., 2021[18]).
The (sparse) available data4 on COVID-19 mortality rates of migrants show that they are over-represented in terms of both incidence and severity, despite having a younger age on average. Migrants5 made up a larger share of confirmed COVID-19 cases in Norway, Sweden, Denmark and Canada compared to their share of the population (OECD, 2020[19]). Mortality estimates in France and Sweden indicate that excess mortality among migrants between March and April 2020 was twice that of non-migrants and that the share of migrants among all deaths increased by between 2-4 percentage points compared to 2015-19 (OECD, 2020[19]). Data from Canada early in the pandemic (March to July 2020) show that COVID-19 mortality rates for migrants were much higher than migrant’s share of the Canadian population, especially for men under the age of 65 (Statistics Canada, 2021[20]).
Migrants’ working and living conditions make them more susceptible to COVID-19 exposure and infection, including: higher rates of relative poverty; a higher likelihood of using public transportation and living in sub-standard accommodation, in overcrowded dwellings and in higher density buildings (e.g. collective housing for asylum seekers, which complicates social distancing and increases the likelihood of infection) (OECD, 2020[19]). In three-quarters of OECD countries, migrants also have fewer options to telework (the share of those able to do so is at least 5 percentage points below that of their native counterparts), and they are over-represented in domestic services and workplaces linked to cluster outbreaks, such as slaughterhouses (OECD, 2020[19]). Moreover, migrants may face greater barriers to following containment measures: those in precarious jobs with little access to social protection, or those with an irregular visa status may be less inclined to go for a test or to hospitals, while a lack of host-country language proficiency may hamper access to care and information on COVID-19 (McFarling, 2020[21]).
The available data suggest that racial and ethnic minorities and Indigenous people face higher COVID-19 health risks at every stage, from exposure to severity of the illness and eventually death. A review of the published medical literature up until August 2020, concluded that Black and Asian people had a higher risk of COVID-19 infection compared to white individuals (Sze et al., 2020[22]).6 Indeed, the death rates of ethnic minorities in England – with the exception of Chinese – up to the end of July were higher compared to those of white individuals, particularly for Black and South Asian individuals (Figure 6.4, Panels A and B). Taking into account age, geography, socio-economic characteristics and pre-existing health conditions (using both hospital records and self-reported data on health status), Black African males in England experienced a death rate 2.5 times higher than white males, while death rates for women were 2.1 times higher. In Canada, up until the end of October 2020, neighbourhoods with the highest proportion of visible minorities7 (25% or more) experienced about twice the COVID-19 mortality rate of the least diverse communities (Figure 6.4, Panel C). In the United States, data up until the end of November 2020 indicate that Black, Hispanic/Latino and Native American COVID-19 cases and deaths by far exceeded their respective proportions of the population (Figure 6.4, Panel D). While life expectancy for the United States population as a whole dropped by a full year in the first half of 2020 (see Chapter 3), Black and Hispanic/Latino men suffered a 2.7 year and 2.4 year decline, respectively, over the same period (Arias, Tejada-Vera and Ahmad, 2021[23]). This large decline means that the gap in life expectancy between white and Black Americans – which had been narrowing in recent years – has now widened further (Tavernise and Goodnough, 2021[24]).

Note: In Panels A and B, Cox proportional hazards regression models are used to estimate how differences in the risk of death involving COVID-19 change when adjusting for a range of factors affecting both the risk of infection and the risk of death if infected, including age, geography (region of residence and population density), socio-economic characteristics (individual and household deprivation measures, based on income, employment, education, health and housing) and health status (self-reported health status and presence of pre-existing conditions). Both plots show the COVID-19 death rates for different racial and/or ethnic groups relative to the white population, adjusting for a range of characteristics. Therefore a value of two indicates that a given population group, controlling for a series of characteristics, is twice as likely to die from COVID-19 than the white population with the same characteristics. More information about how these categories are defined, along with the regression models, can be found in the technical annex of the working paper, located at https://www.ons.gov.uk/peoplepopulationandcommunity/birthsdeathsandmarriages/deaths/methodologies/coronaviruscovid19relateddeathsbyethnicgroupenglandandwalesmethodology#modelling-analysis. In Panel C, Canadian Vital Statistics Death data, released on 28 October 2020, are used to estimate the mortality rates; these vital statistics are provisional, as some deaths that occurred during the reference period have not yet been reported. Visible minorities include South Asian, Chinese, Black, Filipino, and Arab categories. In Panel D, calculations for cases use only the 61% of reports with race/ethnicity information available as of 3 April 2021.
Source: ONS (2020[25]), Updating ethnic contrasts in deaths involving the coronavirus (COVID-19), England and Wales: deaths occurring 2 March to 28 July 2020 (database), Office for National Statistics, https://www.ons.gov.uk/peoplepopulationandcommunity/birthsdeathsandmarriages/deaths/articles/updatingethniccontrastsindeathsinvolvingthecoronaviruscovid19englandandwales/deathsoccurring2marchto28july2020#main-points (Panels A and B); Statistics Canada (2020[26]), COVID-19 mortality rates in Canada’s ethno-cultural neighbourhoods (database), https://www150.statcan.gc.ca/n1/pub/45-28-0001/2020001/article/00079-eng.htm (Panel C); and CDC (2021[27]), COVID-19 hospitalization and death by race/ethnicity (database), https://www.cdc.gov/coronavirus/2019-ncov/covid-data/investigations-discovery/hospitalization-death-by-race-ethnicity.html#footnote01 (Panel D).
The relationship between health, race and ethnicity is complex – and a broader range of socio-economic factors, that are likely to stem from structural racism and discrimination, can help explain why racial and ethnic minority communities are disproportionately affected by coronavirus. Overall, racial and ethnic minority groups are more likely to be at increased risk of acquiring the infection: for example, in the United Kingdom, ethnic minority communities are more likely to live in overcrowded and multigenerational households, in deprived regions and to be born abroad, all factors that create additional barriers in accessing public services (ONS, 2020[28]). In many OECD countries, rural areas – which during COVID-19 suffered from challenges to public service delivery, including shortages of medical workers and a strain on resources, as city dwellers left urban centres during lockdowns – are more likely to include a significant share of Indigenous peoples (OECD, 2020[29]). In the United States, Black and Hispanic/Latino individuals are more likely to live in neighbourhoods with higher exposure to pollutants and a lack of healthy food options, green spaces, recreational facilities, lighting and safety; they are also less likely to have access to good health care, are subject to racial bias in medical treatment and have a higher probability of being poor; longer-term systemic barriers in housing, opportunity and other realms have exacerbated these problems (Graham et al., 2020[30]). In both the United States and the United Kingdom as well as Canada, members of racial and ethnic minority groups are also more likely to hold essential jobs in the health and transportation sectors where social distancing is impossible: Black Americans, who make up 13.4% of the United States population (US Census Bureau, n.d.[31]), represent nearly 30% of bus drivers and nearly 20% of all food service workers, janitors and cashiers (Ray, 2020[32]); in Canada, 34% of frontline workers – including those employed as nurse aides, orderlies and patient service associates – identified as a member of a visible minority8 in 2016 (compared with 21% in other sectors) (Statistics Canada, 2020[33]). Similarly, Black and Asian men in the United Kingdom are more likely to work in occupations that have a higher risk of COVID-19 death (Figure 6.5). Once they become infected, some racial and ethnic groups are also more likely to be at increased risk of poorer outcomes due to a range of prevalent co-morbidities such as asthma, diabetes and cardiovascular disease, partly due to the same structural factors listed above leading to the higher risk of infection (ONS, 2020[28]; Graham et al., 2020[30]). In the United States, the much higher hospitalisation and death risks of American Indians or Alaska Natives compared to white people (Figure 6.4, Panel D) partly reflect health disparities that have affected Native communities for decades (Lakhani, 2021[34]; Hlavinka, 2020[35]).9
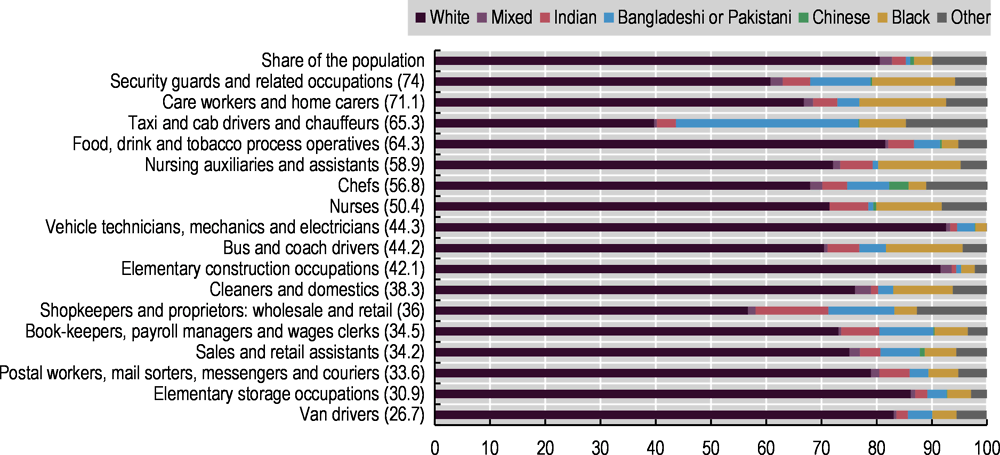
Note: The horizontal bars show the proportion of different ethnic groups within each high risk occupation. Data in parentheses refer to the age-standardised COVID-19 death rate, per 100 000 population, for each occupation type. The overall age-standardised mortality rate involving COVID-19 for the working-age population during this period was 19.1 deaths per 100 000 men and 9.7 deaths per 100 000 women.
Source: ONS (2020[28]), Why have Black and South Asian people been hit hardest by COVID-19? (database), Office for National Statistics, https://www.ons.gov.uk/peoplepopulationandcommunity/healthandsocialcare/conditionsanddiseases/articles/whyhaveblackandsouthasianpeoplebeenhithardestbycovid19/2020-12-14.
The health impact of COVID-19 on Indigenous communities, whose situation is not directly comparable across countries, has taken different turns depending on the context. Data up to February 2021 indicate that Indigenous communities in Australia experienced lower case rates and lower death rates than the general population: out of 909 deaths and 29 135 cases recorded in the whole country, there have been no deaths, 150 cases and only 20 hospitalisations among Indigenous Australians (Australian Government Department of Health, 2021[36]).10 This pattern, which completely reversed the detrimental death toll of past pandemics like the 2009 H1N1 flu among Indigenous Australians, has been credited to multiple factors, including the government giving way to Indigenous leadership; increased training in Aboriginal-controlled health services; remote communities shutting down access to their territories as early as March 2020; Indigenous-tailored media messaging; and the promotion of consistent, culturally appropriate health literacy (Keck, 2020[37]; AIHW, 2021[38]). In Canada, First Nations, Inuit and Métis communities slowed the spread of cases during the first wave of the pandemic through self-imposed border closures and community-based responses such as public health campaigns grounded in the local context of the various nations. In July 2020, the prevalence of COVID-19 among Indigenous people in Canada was less than one-quarter that of non-Indigenous Canadians, with a third of the fatalities and a 30% higher recovery rate (Richardson and Crawford, 2020[39]). However, newly reported cases in Canada’s First Nations communities rose rapidly during the second wave. During the week of 8-14 November 2020, there were a total of 558 new cases in First Nations communities (Government of Canada, 2020[40]) – close to four times the total number of Indigenous people infected during the first wave (Alhmidi, 2020[41]) – compared to an estimated 32 000 in Canada as a whole (based on a 7-day average of 4 560 new cases per day) (Dong, Du and Gardner, 2020[42]). While the share of cases for First Nations (1.7%) was lower than their population share (4.9%, as of 2016 (OECD, 2020[43])), it has nonetheless grown since the first wave of the pandemic.11 In New Zealand, rapid measures imposed by the government also helped to contain the spread of COVID-19. With initial clusters concentrated in areas such as Southland and Canterbury, which have small Māori populations, Pākehā (i.e. non-Māori groups) tended to be over-represented among cases (Cook et al., 2020[44]). Up through February 2021, Māori represented only 8.4% of cases, well under their 16% share of the population (Ministry of Health New Zealand, 2021[45]). However research using data through 25 September 2020 showed that for those who do test positive for COVID-19, Māori have a 2.5 times higher probability of being hospitalized, compared to the non-Māori non-Pacific population (Steyn et al., 2021[46]).
Data from Latin American OECD countries suggest that Indigenous peoples had higher fatality rates than did non-Indigenous peoples. Data referring to 4 October 2020 show that Indigenous peoples in Colombia had a case fatality rate (defined as the share of those who die from COVID-19, out of all those who tested positive) of 3.5%, slightly higher than that of the overall population (including both Indigenous and non-Indigenous peoples), at 3.12% (ECLAC, 2021[47]; Our World in Data, n.d.[48]). Similarly, October 2020 data from Mexico suggest that the lethality of COVID-19 for Indigenous-language speakers was 17.5%, much higher than the lethality for the non-Indigenous population (10.4%) (ECLAC, 2021[47]).
6.1.2. Depression, anxiety, eating disorders and deaths from suicide
Rates of depression and anxiety doubled in some places, and mental health outcomes worsened in particular for women, parents of school-age children, young people, those with more precarious financial and employment situations, racial and ethnic minorities, and LGBTI+ youth
Women have higher reported rates of anxiety and depression than men, and these gaps have widened over the course of the pandemic. Data from 16 OECD countries collected from April through December 2020 show that women are more likely to be at risk of depression (29.4%) and anxiety (23.9%) than men (26% and 23.7%, respectively) (Figure 6.6, Panel A), using the PHQ-4 scale.12 For seven of the eight European countries for which broadly comparable pre-COVID data are available,13 the gender gaps in risks for depression have widened (Figure 6.6, Panel B). A study conducted during the first wave of the pandemic in the United Kingdom also found that working women experienced some of the largest deteriorations in mental health (OECD, 2021[49]). A longitudinal study of 1 301 Canadian women, from 20 May – 15 July 2020, found that anxiety and depression rose for all women, compared to baseline years, with larger increases for women experiencing negative income shocks, those who had trouble balancing home schooling and work responsibilities, and those with difficulty accessing childcare (Racine et al., 2021[50]) (see Box 6.2 for additional evidence of gender inequalities in mental health in Canada). A meta-analysis of 18 studies found that maternal depression and anxiety rose during the pandemic, and that older mothers were more likely to have higher clinically significant symptoms of depression and anxiety (Racine et al., 2021[51]).

Note: Panel A shows the share of respondents at risk for depression and anxiety disorders, based on their responses to the PHQ-4 questionnaire. Data reported are pooled averages from April through December 2020, aside from Mexico and the United States, where they are averages from April through September 2020. The OECD average includes only the 16 countries shown. Panel B shows the share of respondents at risk of depression, based on responses to the PHQ-2 questionnaire, in 2020 and 2014. Data from 2020 come from a different data source than do data from 2014; although both use the same mental health diagnostic tool (PHQ-2), caution should be taken when interpreting exact numerical increases in any individual country. Baseline data come from the European Health Interview Survey (EHIS) wave 2.
Source: OECD calculations based on Imperial College London YouGov (2020[52]), COVID-19 behaviour tracker data hub (database), https://github.com/YouGov-Data/covid-19-tracker; and OECD calculations based on European Health Interview Survey (EHIS) wave 2 data (n.d.[53]), https://ec.europa.eu/eurostat/statistics-explained/index.php?title=Glossary:European_health_interview_survey_(EHIS).
In April 2020, Statistics Canada launched a weekly online crowdsourcing survey to gauge the real-time impacts of COVID-19 (Statistics Canada, 2020[54]). Rotating topics included in the survey so far have included COVID-19 experiences by disability, sexual orientation and gender identity, as well as physical health, mental health and well-being, income and expenditure, discrimination, interpersonal trust and trust in public institutions. Links inviting respondents to complete the survey are posted on Statistics Canada’s website, and all Canadian residents are eligible to participate. Sample sizes vary by wave. As respondents are self-selected, statistical inferences about the entire Canadian population cannot be made from the results. Nevertheless, crowdsourcing is a cost-effective and timely way to collect granular data, particularly when normal data collection operations have been interrupted by the pandemic.
Around 46 000 residents completed the Impacts of COVID-19 on Canadians – Your mental health round of data collection from 24 April to 11 May 2020. Canadians participating in the study who identify as gender diverse were much more likely to report that their mental health is “somewhat” or “much” worse since social distancing began (71%, compared to 57% for women and 47% for men) (Figure 6.7, Panel A). In addition, gender-diverse respondents in the study reported more symptoms consistent with "moderate" or "severe" generalised anxiety disorder (GAD-7) in the two weeks prior to the survey (61.8%, as compared to 29.3% for women and 20.5% for men) (Figure 6.7, Panel B).

Note: Respondents are categorised as gender diverse if they do not report their gender as exclusively male or female (i.e. includes those who are unsure of their gender, who identify as both male and female, or who identify as neither). Note that outcomes for “male” and “female” respondents include both cisgender (current gender and sex assigned at birth) and transgender individuals.
Source: Statistics Canada (2020[55]), Gender differences in mental health during the COVID-19 pandemic (database), https://www150.statcan.gc.ca/n1/pub/45-28-0001/2020001/article/00047-eng.htm.
Young people’s mental health has been particularly affected during the pandemic, against a backdrop of school closures, labour market shocks and disruption to mental health services in schools and workplaces (Figure 3.9) (OECD, 2021[56]). Before the pandemic, 35% of adolescents receiving mental health services in the United States received these services exclusively from the school system – especially those from low-income households and those belonging to racial and ethnic minority groups – therefore disruptions to these services are likely to disproportionately impact these groups (Ali et al., 2019[57]). March 2021 data from Belgium, France and the United States showed that the share of young people with anxiety and depression symptoms had more than doubled compared to pre-pandemic data (OECD, 2021[56]). Survey data from 12 OECD countries from April 2020 to December 2020 meanwhile indicate that anxiety and depression rates for 15-24 year-olds are higher than older age cohorts (41.2% depression and 38.9% anxiety, compared to 27.9% and 26.0% for 25-64 year-olds, and 14.9% and 14.7% for those aged 65 and over) (Figure 6.8, Panels A and B). Similarly, data from 8 OECD countries throughout 2020 and 2021 show that full-time students had levels of depression and anxiety similar to those among the unemployed (Figure 6.8, Panels C and D): in 2020, 39.6% of full-time students in 8 OECD countries reported symptoms of depression and 35.0% symptoms of anxiety, compared to 39.4% and 37.2%, respectively, among the unemployed. Full-time students are likely to be younger, thus it is difficult to disentangle whether being a student or being younger is the factor driving their lower mental health.
In addition to elevated depression and anxiety, eating disorders have been on the rise for young people during the pandemic (Spettigue et al., 2021[58]; Touyz, Lacey and Hay, 2020[59]). In March 2021, the United Kingdom National Health Service noted that child and adolescent eating disorder referrals almost doubled in in the year since the start of the pandemic (Solmi, Downs and Nicholls, 2021[60]). According to the CMME (clinique des maladies mentales et de l’encéphale) clinic in Paris’s Sainte-Anne hospital, cases of bulimia, overeating and anorexia have increased significantly since the start of the pandemic and subsequent lockdowns, while the French Anorexia Bulimia Federation’s national (FFAB) hotline saw a 30% increase in calls in 2020 compared to previous years. Young people aged 18-21, primarily women, are most affected by eating disorders (Raybaud, 2021[61]).
LGBTI+ individuals, especially youth, reported poor mental health outcomes during the pandemic, especially those confined in homes where they may not be accepted. Surveys in the United States and United Kingdom found that those identifying as a sexual minority or LGBTI+ were more likely to report symptoms of depression (OECD, 2021[56]). Another study of LGBTI+ respondents in the United Kingdom, running from 27 April to 13 July, found that depression and stress were present in almost 70% of the population, with 17% reporting some form of discrimination since the start of the pandemic because of their sexual orientation (Kneale and Bécares, 2020[62]). One reason for these elevated levels of mental distress is that young LGBTI+ people may be forced to quarantine with family members who do not accept them. A study of 632 LGBTI+ youth aged 16 to 35 in Portugal, from 17 April to 4 May 2020, found that 59% of respondents felt uncomfortable within their family, 30% felt very uncomfortable living with their parents during confinement, and 35% reported feeling “suffocated” because they could not express their true identity with their family (Durães e Lusa, 2020[63]). Data from the mental health hotline opened by the Colombian Ministry of Health and Social Protection in April 2020 showed that a higher percentage of transgender callers (14%) reported problems with interpersonal relationships as compared to cisgender women (4.5%) or men (4.8%) (El Heraldo, 2021[64]).
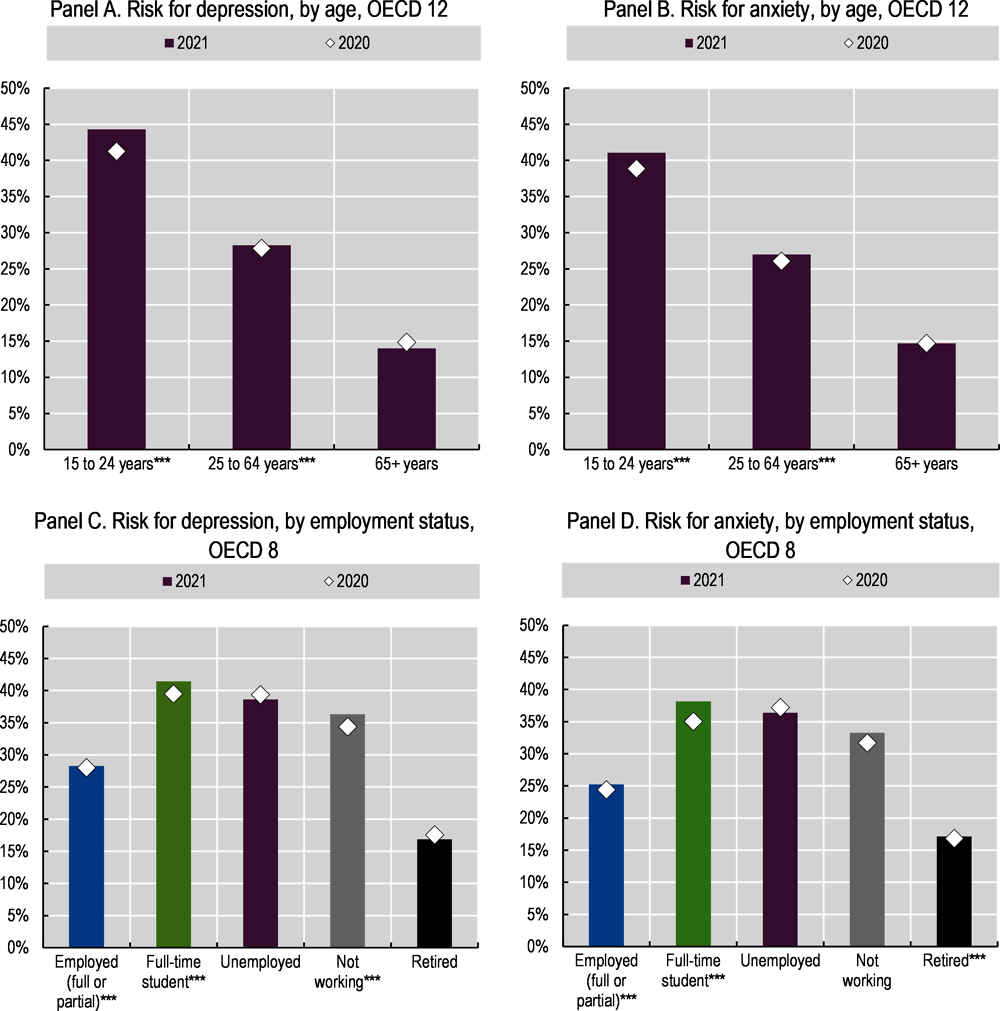
Note: Groups followed by *** experienced statistically significant (at the 5% level) changes in outcomes from 2020 to 2021. All figures depict the share of respondents at risk for depression and anxiety disorders, based on their responses to the PHQ-4 questionnaire. Panel A shows age breakdowns for the 12 OECD countries with complete data from April 2020 to June 2021: Australia, Canada, Denmark, France, Germany, Italy, Japan, Korea, Norway, Spain, Sweden and the United Kingdom. Panels C and D show employment status breakdowns for eight OECD countries with complete data: Canada, France, Germany, Italy, Japan, Korea, Spain and the United Kingdom.
Source: OECD calculations based on Imperial College London YouGov (2020[52]), COVID-19 behaviour tracker data hub (database), https://github.com/YouGov-Data/covid-19-tracker.
Symptoms of depression and anxiety are also more common among the unemployed and those experiencing financial difficulties (OECD, 2021[49]). Survey data from the United Kingdom, collected between 27 January and 7 March 2021, showed that 40% of unemployed individuals reported depression, compared to only half that level among those employed or self-employed (19%) (ONS, 2021[65]). In the United States, survey data collected from the COVID Impact Survey in June 2020 reveal that households with income of less than USD 30 000 were among the groups that reported the highest rates of hopelessness (45% compared to 25% for households making more than USD 125 000) and depression (46%, compared to 33%) (Wozniak et al., 2020[66]; COVID Impact Survey, 2020[67]). Another United States-based study from 19-24 March 2020 found that 33% of lower-income Americans experienced high distress, compared to 17% of people in upper-income households (Keeter, 2020[68]).14 An online national survey in Japan, administered in two waves (16-18 April 2020 and 15-17 May 2020) to 2 000 total respondents, found that the unemployed had higher rates of depression (measured using PHQ-9)15 and anxiety (using GAD-7)16 than did permanent employees: 31.2% vs. 18.9% at risk of depression, and 25.4% vs. 11.7% at risk of anxiety, respectively. Part-time temporary workers reported better mental health outcomes than the unemployed, but still significantly below those of permanent employees (20.6% at risk for depression, and 12.6% at risk of anxiety). Similarly, rates of depression and anxiety were more than twice as large for households whose finances were worse off following the start of the pandemic, compared to those whose finances were unchanged or improved (Ueda et al., 2020[69]).
Children from lower-income families also report low mental health outcomes. According to the Tulsa SEED study in the United States, low-income parents and their children have struggled with mental health since the pandemic began. One in four parents experienced depressive symptoms, which were often tied to food insecurity: parents who were food insecure were twice as likely to report feeling depressed as parents who were food secure. Similarly, 47% of parents said their child experienced increased emotional or behavioural problems since the pandemic began (Tulsa SEED Study Team, 2020[70]). A study from the United States Center for Translational Neuroscience reveals similar trends (Center for Translational Neuroscience, 2020[71]).17
An additional concern is the toll that COVID-19 is taking on the mental health of frontline health-care workers (United Nations, 2020[72]; OECD, 2021[49]). Frontline workers are facing the stress and anxiety of working long hours, the death of many patients – often without the presence of family members – and fear of contracting the virus themselves and/or infecting family members. In April 2020, a survey of 578 Canadian health-care workers revealed that 47% reported a need for psychological support; with regards to their current work situation, 67% felt anxious, 49% unsafe, 40% overwhelmed, 29% helpless, 28% sleep deprived and 28% discouraged (Potloc, 2020[73]). A 2021 study by McKinsey & Company of 400 frontline nurses found that 22% reported a desire to leave their current position; among these, 60% said their desire to quit their job had increased since the start of the pandemic (Berlin et al., 2021[74]). Even before the pandemic arrived, physicians around the world had higher suicide rates, alcoholism and general substance abuse rates than the general population (Schernhammer and Colditz, 2004[75]; Kaliszewski, 2021[76]).18 There are also growing concerns about high suicide rates among health workers, including doctors and nurses treating COVID-19 patients, in some of the worst-hit areas (Rahman and Plummer, 2020[77]; MacBride, 2020[78]). Unpaid adult caregivers are also at risk for worse mental health outcomes, increased substance abuse and higher levels of suicidal ideation (Czeisler et al., 2020[79]).
Although there are few data, migrants’ mental health seems to have declined more than non-migrants’ during the pandemic. In Germany, those with a migration background experienced a sharper increase in symptoms of anxiety in April 2020 vis-à-vis pre-pandemic years, compared to those without a migration background (Figure 6.9, Panel A). In a nationally representative survey conducted in July and November 2020 in Australia, the share of those saying that they had been “unhappy” or “very unhappy” over the past year rose from 16% in 2018-19 to 23% for respondents born abroad with a non-English speaking background, compared to a decline in unhappiness for those born in Australia from 22% to 20% (The Scandlon Foundation, 2021[80]).
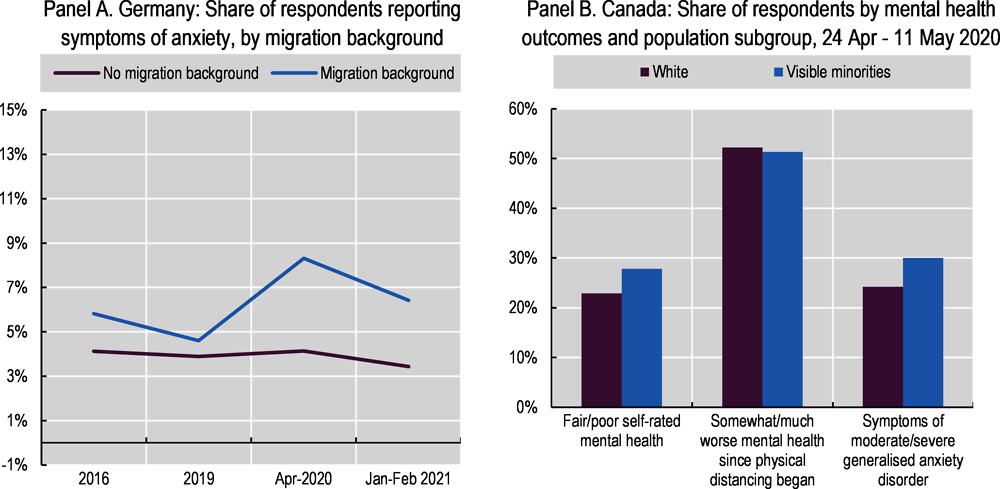
Note: In Panel A, the two-item Generalised Anxiety Disorder (GAD-2) scale was used to obtain information about symptoms of anxiety. In Panel B, visible minority groups include South Asian, Chinese, Black, Filipino, Latin American, Arab, Southeast Asian, West Asian, Korean, Japanese, visible minority not included elsewhere, and multiple visible minority categories; Indigenous peoples are not included. Outcomes are compared to the white (non-Indigeneous) population). Anxiety was measured using the GAD-7 scale; those with a score of 10 or higher are considered to have moderate to severe symptoms of generalised anxiety disorder in the two weeks prior to completing the survey.
Source: Kühne et al. (2020[81]), “The need for household panel surveys in times of crisis: The case of SOEP-CoV”, Survey Research Methods, Vol. 14/2, pp. 195-203, https://doi.org/10.18148/srm/2020.v14i2.7748 (refer to Box 3.1 for methodological details) (Panel A); Statistics Canada (2020[82]), The mental health of population groups designated as visible minorities in Canada during the COVID-19 pandemic (database), https://www150.statcan.gc.ca/n1/pub/45-28-0001/2020001/article/00077-eng.htm (Panel B).
Mental health deteriorated for almost everyone in 2020, but gaps in mental health outcomes between racial and ethnic groups were large and in some cases increased over time. In Canada, similar proportions of visible minority19 and white (non-Indigenous) participants reported that their mental health had worsened since the beginning of physical distancing in a survey in May and April 2020 (Statistics Canada, 2020[82]) (refer to Box 6.2 for survey methodology). However, a larger share of visible minority participants rated their mental health as fair or poor and exhibited symptoms of generalised anxiety disorder in the previous two weeks (Figure 6.9, Panel B). Moreover, 38% of Indigenous respondents, as compared to 23% of non-Indigenous respondents in the same survey, reported fair or poor mental health, and 48% of Indigenous women compared to 31% of Indigenous men experienced symptoms of anxiety (Statistics Canada, 2020[83]).20 In the United Kingdom, self-reported mental health (based on the GHQ-12 score,21 and after adjusting for a range of socio-economic and demographic conditions including social support) deteriorated across most groups during the first lockdown (April 2020 versus 2019), but the decline was most noticeable in the Indian group compared to those of white British or Other white ethnicity (ONS, 2020[84]).22 In a different United Kingdom survey (the COVID-19 Social Study, a large longitudinal study but without a probability sample), 23.6% of respondents with an ethnic minority background reported thoughts of suicide or self-harm between 1 March and 20 April, as compared to 17.1% among white respondents (Iob, Steptoe and Fancourt, 2020[85]). Data from the United States Census Bureau Household Pulse survey suggest gaps in mental health outcomes between different racial and ethnic groups were small in 2019, but widened in 2020 as overall levels of anxiety and depression increased rapidly during the pandemic (Figure 6.10). On average, more than 40% of Black and Hispanic/Latino Americans showed symptoms of anxiety and/or depressive disorder between April 2020 and May 2021, compared to 35% of white and 31% of Asian adults. However, additional nationally representative survey evidence indicates that, despite experiencing far greater material hardship during the pandemic (Chapter 5), levels of hope and optimism for the future among Hispanic/Latino and Black individuals remained more resilient.23 This mirrors the lower prevalence of deaths by suicide, acute alcohol abuse and drug overdose (“deaths of despair”) among these communities, compared to white communities, in the years preceding the pandemic (Graham et al., 2020[30]): the gap between Black and white respondents holds for all income levels, but is largest when comparing low-income Black and white adults.24
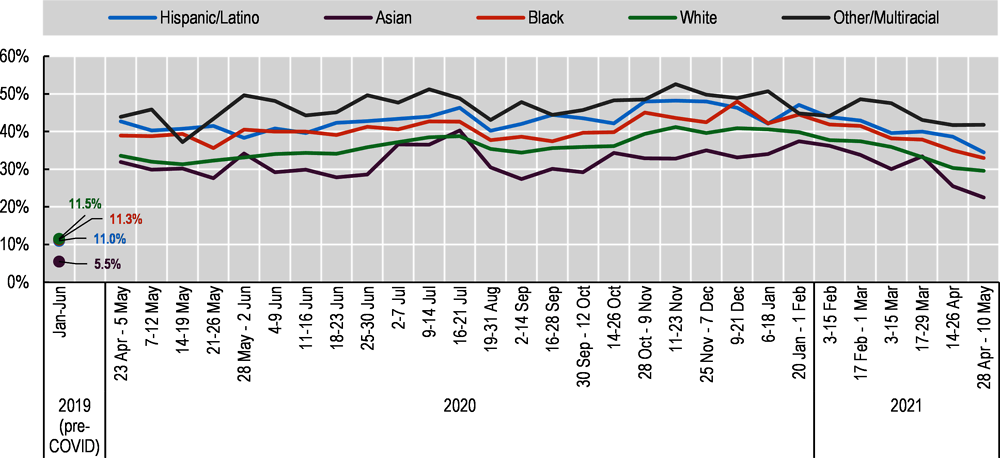
Note: Pre-pandemic data are January-June 2019 averages. Data before and during the pandemic use the two-item Patient Health Questionnaire (PHQ-2) and the two-item Generalised Anxiety Disorder (GAD-2) scale to obtain information on the frequency of anxiety and depression symptoms. The results may not be directly comparable as the two-week reference period in 2019 was modified to one week in 2020-2021. Results for the Other/Multiracial category are not available in 2019.
Source: 2019 data: NCHS (2020[86]), National Health Interview Survey Early Release Program (database), National Center for Health Statistics, https://www.cdc.gov/nchs/data/nhis/earlyrelease/ERmentalhealthbyrace-508.pdf; 2020-2021 data: United States Census Bureau (n.d.[87]), Measuring household experiences during the coronavirus pandemic (database), https://www.census.gov/householdpulsedata (refer to Box 3.1 for methodological details).
Suicides among young people have not risen as feared, but intentional self-harm among some population groups is on the rise
Despite the rapid rise in mental health difficulties among young adults, prompting early fears of an increase in youth suicide rates in the United States, later evidence showed no significant increases in 2020 (Bartlett, 2021[88]). In other countries, however, some studies have found evidence of increases in suicides or self-harm hospitalisations, especially among other segments of the population (see Box 6.3 for evidence from Japan). A study in England from 23 March to 17 May 2020, in Oxford and Derby hospitals, found that COVID-19 and lockdown restrictions contributed to self-harm, especially for women (Hawton et al., 2021[89]). Data from private health-care claims in the United States showed that claims for intentional self-harm as a percentage of all medical claim lines for those aged 13-18 nearly doubled from April 2019 to April 2020 (FAIR Health, 2021[90]).
Suicides in Japan rose to a five-year seasonal high in October 2020 (Box 3.2), primarily reflecting an increase in suicides among young Japanese women. Even though the overall level of suicides among women is lower than for men in Japan, the pace of increase for women has been concerning: up 15% from 2019 (Figure 6.11). Potential reasons for this increase include higher job losses, the fact that 1 in 5 women in Tokyo live alone, gender disparities in the burden of housework and childcare, and the rise of domestic violence and sexual assault over the same period (Rich and Hida, 2021[91]). In 14 OECD countries, deaths of despair – including deaths from both suicides and substance abuse – had increased for women between 2010 and 2016 (OECD, 2020[4]).

Source: Japanese National Police Agency (2021[92]), 令和2年中における自殺の状況, https://www.npa.go.jp/safetylife/seianki/jisatsu/R03/R02_jisatuno_joukyou.pdf.
As compared to mental health, life satisfaction remained surprisingly resilient for many over the course of 2020 but declined for some groups
Although average measures of subjective well-being in OECD countries remained relatively stable from 2019 to 2020 (Chapter 3), some population groups were more adversely impacted by the pandemic than others (Figure 6.12). Women (especially women who have children in the home), those living in a home with children under the age of 18, young people, and those working part-time experienced some of the largest declines in life satisfaction from 2019 to 2020. These declines in life satisfaction are more or less mirrored in negative affect balance.25 In addition, life satisfaction in 2020 declined for the unemployed. Conversely, while the large changes in negative affect balance for the unemployed are visually striking (and counterintuitive), they are not statistically significant. They likely stem from the fact that overall unemployment rates increased in many countries in 2020, changing drastically the composition of the unemployed (Helliwell et al., 2021[93]).26
In 2020, women experienced slightly larger declines in both life satisfaction and negative affect balance relative to men (Figure 6.12). According to the Global Attitude Survey from the Pew Research Center, 68.8% of women in Germany, France and the United States reported in November-December of 2020 that their life had changed a great deal/fair amount as a result of the COVID-19 outbreak, while only 59.3% of men did (Devlin and Kent, 2021[94]).27 According to data from the Gallup World Poll, life satisfaction for women fell by 0.06 points on a 0-10 scale, on average in the OECD, compared to 0.03 points for men; negative affect balance deteriorated by 1.4 percentage points, compared to 0.7pp for men. While these average falls are small, they mirror women’s higher risk of job losses (Adams-Prassl et al., 2020[95]; Alon et al., 2020[96]) and domestic violence during lockdown periods (Leslie and Wilson, 2021[97]; Armbruster and Klotzbücher, 2020[98]), as well as higher childcare burdens stemming from school and day-care closures (Adams-Prassl et al., 2020[95]).
Regardless of gender, life satisfaction for parents of school-age children fell during 2020, and this effect was stronger in areas that underwent more school closures (Huebener et al., 2020[99]) (Figure 6.13). In fact, changes in life satisfaction were significant only for countries where school closures exceeded the OECD average (Figure 6.13, Panel A), with deteriorations for those with school-age children and significant improvements for partnered people with no children in the home. In countries with lower than OECD average school closures in 2020, none of the household groupings experienced significant changes in life satisfaction (Figure 6.13, Panel B). However, while parents saw their life satisfaction fall more than those without children (or with children over age 18), parents of school-age children still have higher levels of life satisfaction than single people with no children (6.8 vs. 6.51 in 2020, respectively). Those in partnerships – either married or in a consensual union – have higher life satisfaction than single people, regardless of whether they have children: 6.8 and 6.79 for those in partnerships with and without children, compared to 6.58 and 6.51 for single people with and without children, respectively (Figure 6.12).
Overall, across OECD countries, subjective well-being is higher among people in employment, relative to the unemployed, and this gap widened for life satisfaction in 2020. Average life satisfaction among the full-time employed fell from 6.88 to 6.85 in 2020, while for the unemployed it fell from 6.04 to 5.88 (Figure 6.12). For negative affect balance, the gap between the employed and the unemployed narrowed somewhat, but in 2020 the share of unemployed experiencing a negative affect balance was still very high at 21% (compared to 12% for the full-time employed). A much smaller gap exists between those in full-time and part-time employment, where full-time employees are slightly better off.28 However, while full-time employees experienced little change in their subjective well-being, on average, from 2019 to 2020, part-time workers recorded some of the largest deteriorations of any group, across both measures.
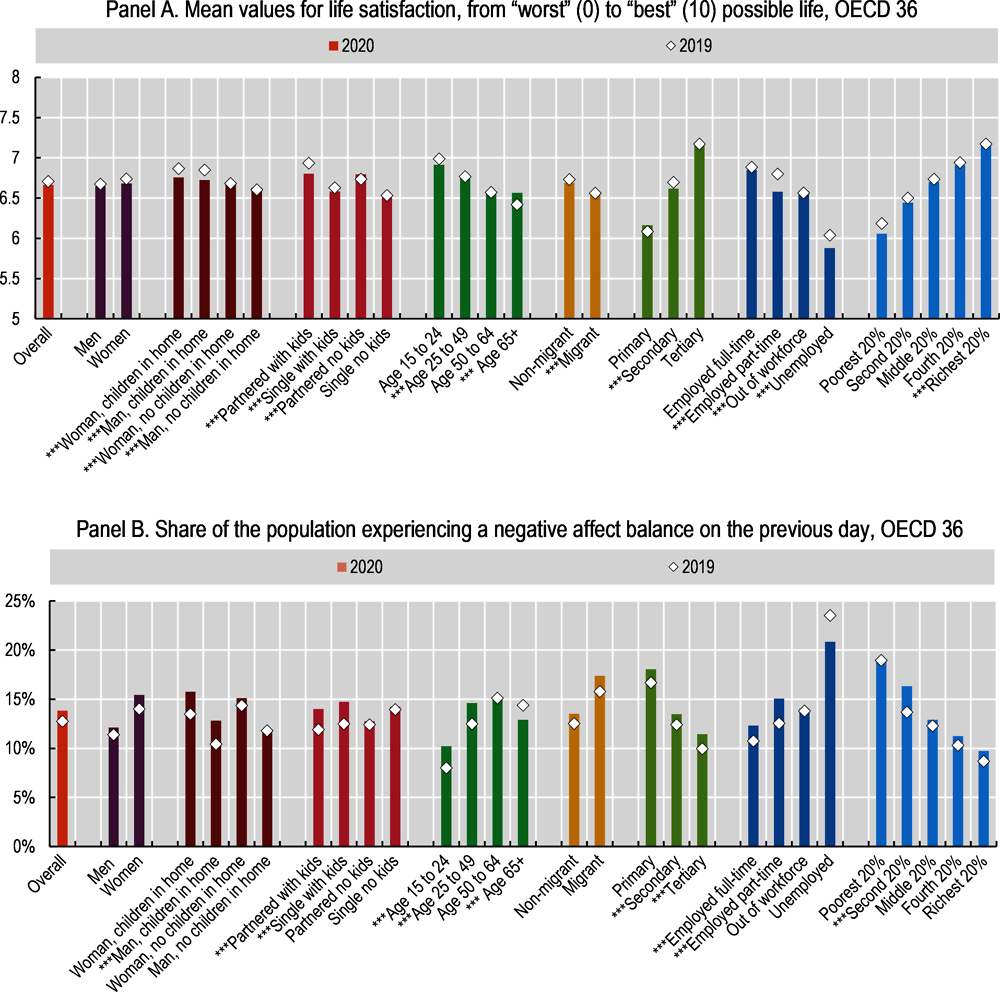
Note: In Panel A, life satisfaction is measured on a scale from 0 “not at all satisfied” to 10 “completely satisfied”. In Panel B, a negative affect balance is recorded when a respondent reports more negative (anger, sadness or worry) than positive (well-rested, enjoyment, laughing or smiling a lot) feelings or states in the previous day. In both panels, the OECD average excludes Luxembourg (no data in 2020) and the Czech Republic (no data in 2019). Groups preceded by *** experienced statistically significant (at the 5% level) changes in outcomes from 2019 to 2020. Refer to the Reader’s Guide for a complete list of Gallup World Poll data collection dates in 2020, and to Box 3.4 for additional information about the data collection methodology. “Women and men with children in the home” are respondents who report having at least one child under the age of 18 living in the household. “Women and men with no children” are defined as those who do not have any children under the age of 18 living in the household. Therefore, these indicators do not account for parents of adult children, or children who live outside of the household. “Partnered” is defined as being either married or in a consensual union. “Single” encompasses those who are not married, are not in a consensual union, are divorced, and/or are widowed. “Poorest 20%” refers to those in the bottom quintile of household income (income quintiles are defined by Gallup). See the Reader’s Guide for a definition of educational categories.
Source: OECD calculations based on the Gallup World Poll (n.d.[100]) (database), https://www.gallup.com/178667/gallup-world-poll-work.aspx.
Declines in life satisfaction for low-income earners and those with low levels of education are not statistically significant (Figure 6.12). This suggests that measures of subjective well-being are perhaps reflecting both the negative impacts of the pandemic (health risks, job and income loss, social isolation, school closures, etc.) as well as the buffering role that government policies played in protecting people’s material conditions (job retention schemes, more generous unemployment packages, etc.) and some positives for those who kept their jobs but saw changes in their working or living arrangements (e.g. more time to spend with family among those furloughed, on short-time working hours, or no longer commuting to work – see Chapters 5 and 7). In the case of life satisfaction, this has netted out as few large changes in life satisfaction at the national average level among OECD countries (see Figure 3.11), but significant falls (and some gains) for specific population groups.

Note: Panel A displays life satisfaction averages by household type for countries where days of school closures exceeded the OECD 36 average during the Gallup fieldwork period (the OECD 19 average includes Canada, Chile, Colombia, Costa Rica, Finland, Ireland, Israel, Italy, Lithuania, Latvia, Mexico, the Netherlands, Norway, Portugal, Slovenia, Spain, Sweden, Turkey and the United States). Panel B shows outcomes for countries with below OECD average school closures (the OECD 17 average includes Australia, Austria, Belgium, Denmark, Estonia, France, Germany, Greece, Hungary, Iceland, Japan, Korea, New Zealand, Poland, the Slovak Republic, Switzerland and the United Kingdom). Luxembourg (no data in 2020) and the Czech Republic (no data in 2019) are not included in either group. School closure data (not pictured in the graphs, but used to categorise country groupings) come from the Oxford COVID-19 Government Response Tracker. Groups followed by *** experienced statistically significant (at the 5% level) changes in outcomes from 2019 to 2020. “Partnered” is defined as being either married or in a consensual union. “Single” encompasses those who are not married, are not in a consensual union, are divorced, and/or are widowed. A household is defined as having kids if the respondents indicate that at least one child under the age of 18 lives in the household. Therefore partnered or single people with children who do not live at home, or whose children are over the age of 18, are categorised as “no kids” for the purposes of this figure. Refer to the Reader’s Guide for a complete list of Gallup World Poll data collection dates in 2020, and to Box 3.4 for additional information about the data collection methodology.
Source: OECD calculations based on the Gallup World Poll (n.d.[100]) (database), https://www.gallup.com/178667/gallup-world-poll-work.aspx; OECD calculations based on Hale et.al (2021[101]), “A global panel database of pandemic policies (Oxford COVID-19 Government Response Tracker)”, Nature Human Behaviour, Vol. 5/4, pp. 529-538, https://doi.org/10.1038/s41562-021-01079-8.
The life satisfaction of young people fell more than any other age group in 2020, while there is some evidence that life satisfaction among those aged 65 or above improved (Figure 6.14). Data from both national statistics offices and international surveys in 2020 suggest that as young people have been especially hard hit by the pandemic – their schooling interrupted, their career prospects dimmed and their social lives dramatically diminished – their life satisfaction has fallen more than other age cohorts (Helliwell, Schellenberg and Fonberg, 2020[102]). Data from the United Kingdom Office for National Statistics show that the youngest age cohort had the lowest levels of life satisfaction from April-May 2020 (ONS, 2020[103]), while evidence from France shows that the steep drop in young people’s life satisfaction occurred in early 2021, rather than 2020 (CEPREMAP/INSEE, n.d.[104]). Data from 26 countries from April to June, collected by Imperial College London YouGov (2020[52]), show that, across most countries, younger people were least satisfied with their life, while middle-aged and older cohorts reported better outcomes (SDSN Secretariat, 2020[105]).
The finding that life satisfaction improved for older people in 2020 is still not well understood. One theory posits that older people feel relatively healthier in the context of a global pandemic: those who were lucky enough to avoid contracting COVID-19 feel more grateful for their baseline health levels (The Economist, 2021[106]). 36% of men aged 60 and over, and 42% of women of the same age, reported a health problem in 2020, compared to 46% of men and 51% of women in the period 2017-19 (Helliwell et al., 2021[93]). Additional evidence from the United States showed that older people may be better able to cope with prolonged stressful situations than are younger age cohorts, leading to their more resilient life satisfaction outcomes over the course of 2020 (Carstensen, Shavit and Barnes, 2020[107]; Carey, 2021[108]).

Note: In Panels A and B, the OECD average excludes Luxembourg (no data in 2020) and the Czech Republic (no data in 2019). The figure shows subjective well-being outcomes throughout the life course, in 5-year periods. Life course outcomes for 2020 are contrasted to those from 2019. Refer to the Reader’s Guide for a complete list of Gallup World Poll data collection dates in 2020, and to Box 3.4 for additional information about the data collection methodology.
Source: OECD calculations based on the Gallup World Poll (n.d.[100]) (database), https://www.gallup.com/178667/gallup-world-poll-work.aspx.
French data show that women had lower levels of life satisfaction than men throughout 2019-21. When life satisfaction reached its 2020 peak (coinciding with the June/July deconfinement in the country) women’s levels more or less equalled men’s. However, the steep decline in life satisfaction in October/November 2020 – the beginning of strict second-wave lockdowns – was worse for women than men (Figure 6.15, Panel A).

Note: All four panels show average life satisfaction on a scale from 0 “not at all satisfied” to 10 “completely satisfied”.
Source: CEPREMAP/INSEE (n.d.[104]), Le bien-être en France (database), http://www.cepremap.fr/Duree.html (Panel A); Helliwell, Schellenberg and Fonberg (2020[102]), “Life satisfaction in Canada before and during the COVID-19 pandemic”, Analytical Studies Branch Research Paper Series, No. 457, Statistics Canada, https://www150.statcan.gc.ca/n1/en/pub/11f0019m/11f0019m2020020-eng.pdf?st=s6m4rNgZ (Panel B); Kühne et al. (2020[81]), “The need for household panel surveys in times of crisis: The case of SOEP-CoV”, Survey Research Methods, Vol. 14/2, pp. 195-203, https://doi.org/10.18148/srm/2020.v14i2.7748 (Panel C); and ONS (n.d.[109]), Personal and economic well-being in Great Britain: September 2020 (database), Office for National Statistics, https://www.ons.gov.uk/peoplepopulationandcommunity/wellbeing/datasets/ incomegroupsplitestimatesonpersonalandeconomicwellbeingacrosstime (Panel D).
In Canada, between 2019 and 2020, life satisfaction declined more among migrants from Asia, the United States, Europe and Australasia than it did among individuals born in Canada (Figure 6.15, Panel B). Both economic and social factors may account for this outcome. Recent migrants were more likely than Canadian-born workers to lose their jobs in March and April mainly because of their shorter job tenure and over-representation in lower-wage jobs (Helliwell, Schellenberg and Fonberg, 2020[102]). In the United Kingdom and Germany, people with lower annual incomes reported lower life satisfaction than those earning more (Figure 6.15, Panels C and D).
The move to remote learning has disproportionately affected children with learning disabilities, from low-income households and racial and ethnic minority groups, widening inequalities in education
The school closures associated with the pandemic and ensuing lockdowns disrupted the education of millions of children (Chapter 3) (UNESCO, n.d.[110]), leading to growing inequalities in the acquisition of knowledge and skills (OECD, 2021[111]). A McKinsey & Company survey of 2 549 teachers in eight countries in October and November of 2020 found that teachers rated the effectiveness of remote learning, as compared to in-person teaching, as 4.8 on average, on a scale from 1 (least effective) to 10 (most effective, and equal to in-person instruction). Teachers in the United States (3.5) and Japan (3.3) rated remote learning lowest, while those in Australia (6.6) and Germany (6.1) reported higher ratings. Teachers estimated that their students were behind by around two months, on average, with only 12% of teachers thinking that their students were on track (Chen et al., 2021[112]). According to teachers, the effectiveness of remote learning was contingent on the socio-economic status of the student body: those who taught in schools in which a higher share of the student body fell below the poverty line saw less effectiveness and less student engagement (Figure 6.16).
In many OECD countries, schools designed and implemented their own distance learning strategies, leading to uneven quality and widening inequalities within countries. The OECD’s Results from the Special Survey on COVID-19 found that two-thirds of countries reported that primary and secondary schools were autonomous in developing distance learning plans, which allowed for greater flexibility by administrators and teachers on-the-ground but also increased gaps in learning quality across schools (OECD, 2021[113]). Preparedness for distance learning partly depends on the ability of teachers to use digital learning platforms effectively; prior to the pandemic, less than half of teachers (43%) in OECD countries reported feeling “well prepared” or “very well prepared” to use information and communications technology (ICT) in the classroom (OECD, 2021[113]).
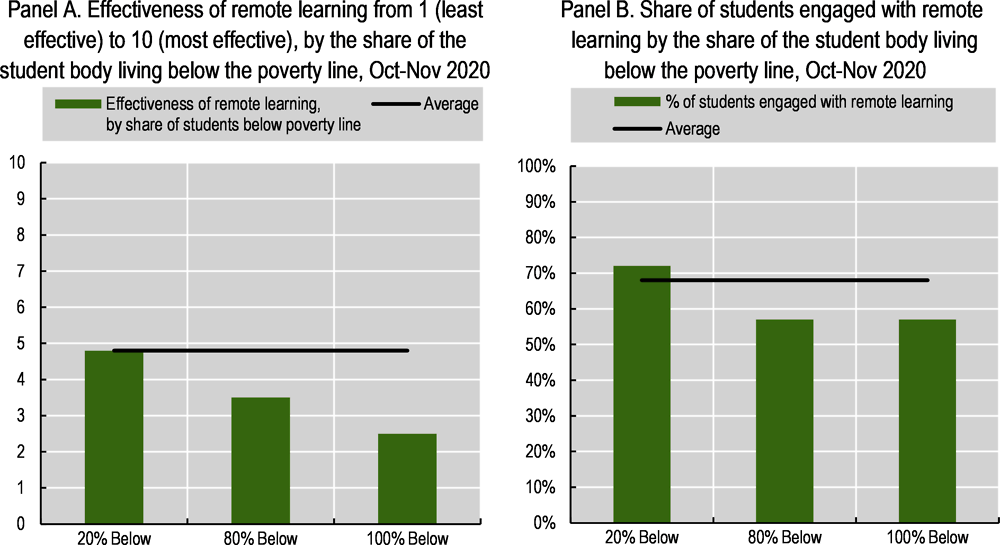
Note: Panel A shows the average effectiveness that teachers assigned to remote learning, where 1 is least effective and 10 is most effective (equal to in-person instruction), by the type of school: schools in which 20% of the student body live in households below the poverty line; 80% below, and 100% below. Panel B shows the share of students engaged with remote learning for each school type. The survey was administered to 2 549 teachers in eight countries: Australia (146 participants), Canada (350), China (350), France (278), Germany (274), Japan (350), the United Kingdom (351) and the United States (450). Data collection ran from 28 October to 17 November 2020.
Source: Chen, L. et al. (2021[112]), Teacher survey: Learning loss is global--and significant, McKinsey & Company, https://www.mckinsey.com/industries/public-and-social-sector/our-insights/teacher-survey-learning-loss-is-global-and-significant?cid=other-eml-alt-mip-mck&hdpid=1a57cf47-eae2-400f-b9f0-fd8edddbbfb6&hctky=2909643&hlkid=b53175decdec48bbb6888bd21b5a168b.
Findings from a number of national studies also show that children whose parents have lower income and/or educational levels experienced greater barriers to remote learning. Pre-pandemic evidence showed that children’s academic performance is influenced by their parent’s education level; this implies that school closures will likely widen existing learning gaps (OECD, 2021[114]). Students who do not have learning support from parents will be more at risk of falling behind their classmates whose parents are better equipped to help them (Di Pietro et al., 2020[115]). Preliminary findings from a study in the United Kingdom show that children from better-off families spent 30% more time on home learning than did students from disadvantaged backgrounds (Andrew et al., 2020[116]). A study in France found that working-class families allocated slightly more time to home learning, but that families from higher socio-economic backgrounds were able to provide higher quality supplemental instruction and that they experienced a lower decline in the parent-student relationship during the lockdown (Hélary, 2020[117]). In the Netherlands, a study of the 2020 eight-week school closure found that it led to 0.08 standard deviations of learning loss (equivalent to one-fifth of a school year), on average, but losses were 60% higher for low-income students (Engzell, Frey and Verhagen, 2021[118]). A United States study administered from May to July 2020 among children from low-income families in Tulsa – aged three to the end of fourth grade – and teachers found that only 29% of teachers reported that “nearly all” students participated in distance learning activities, one in five parents reported that their child never communicated with their teacher, and two in five children spent an hour per day or less on distance learning. Most parents (65%) noted challenges with distance learning, including: children needing more support than the parent(s) can provide (30%); lack of or inconsistent Internet access (16%); lessons and instructions too hard (14%); no dedicated space for schoolwork (13%); and lack of a device to connect to distance learning (10%) (Tulsa SEED Study Team, 2020[70]).29 A study from Statistics Canada found that lower income households had less access to Internet-enabled devices, and were more likely to use mobile devices to connect to the Internet; these devices have more limited functionality than desktop computers, making them less suitable for remote learning activities (Statistics Canada, 2020[119]).
Evidence from some OECD countries shows that children of migrants and racial and ethnic minority groups are at greater risk of falling behind. For instance, among 15-year-olds, students with migrant parents are less likely than students with non-migrant parents to have access to a computer and an Internet connection at home, while children with migrant parents tend to be over-represented among those with a low socio-economic status compared to those with non-migrant parents (OECD, 2020[19]). The lack of fluency in the language spoken in the host country also affects the capacity of children with migrant parents to succeed in home schooling and in securing parental support – language barriers are more challenging when instruction is online. On average, across OECD countries in 2018, close to half (48%) of 15-year-old students with migrant parents did not speak the language of the PISA assessment at home (OECD, 2020[19]). In addition, there is evidence that children of racial and ethnic minority families face additional barriers: as of February 2021, Black and Hispanic/Latino children in the United States were more likely to live in school districts with online-only reopening plans, and children in white households were more likely than all other demographic groups to have received some in-person instruction during the 2020-21 school year (Figure 6.17, Panel A) (Smith and Reeves, 2021[120]). Similarly, in April-May 2021, of those households where children were unable to attend day-care or other caring arrangements in the past month due to COVID-19, white adults were more likely to cut their work hours compared to members of different racial and ethnic groups, but were less likely to lose their job (Figure 6.17, Panel B). Further, nearly half of Black children in the United States are raised by solo mothers, compared to 17% of all other children, making parental support during home schooling more difficult relative to work obligations (Smith and Reeves, 2021[120]).
Conversely, the shift to online parent-teacher conferences has facilitated inclusion of parents whose work schedules typically conflict with such meetings (OECD, 2021[111]). Results from a survey of 34 OECD countries in January and February 2021 showed that governments have provided school systems with guidelines for keeping communication channels with parents open during COVID-19 learning disruptions. The most commonly used methods include e-school platforms, phone calls to students and/or parents, emails to students and/or parents, regular conversations with parents, video conference technology and text/WhatsApp messaging (OECD, 2021[111]). Pre-pandemic evidence from the OECD’s 2018 PISA study showed that parents with children in more socio-economically advantaged schools were more likely to discuss their child’s academic progress with teachers, compared to more disadvantaged schools where teachers were more likely to take the initiative. The most commonly cited reason for parents to not participate in school activities was the need to work (34%), followed by inconvenient meeting times (33%) (OECD, 2019[121]).

Source: United States Census Bureau (n.d.[87]), Measuring household experiences during the coronavirus pandemic (database), https://www.census.gov/householdpulsedata (refer to Box 3.1 for methodological details).
6.4.1. Air pollution and access to green space
Confinement regulations have affected air pollution, leaving some groups more vulnerable to its negative impacts
Research suggests that prolonged exposure to air pollution exacerbates COVID-19 symptoms (Chapter 3), and that socio-economically disadvantaged households are often more exposed to air pollution (Brunekreef, 2021[122]; Kerr, Goldberg and Anenberg, 2021[123]), which – coupled with a higher probability of having underlying health conditions, and a greater likelihood of inability to work from home – worsens their COVID-19 outcomes. Pre-COVID studies in England and the Netherlands showed that PM10 and NO2 concentrations are higher in more deprived areas, as well as in ethnic minority neighbourhoods. However, while it is often assumed that poorer areas have worse air pollution, within Western Europe this is not always the case: some of the most polluted regions are among the wealthiest (examples include Lombardy and Emilia Romagna in northern Italy, and Flemish Brabant and Wallonia Brabant in Belgium) (Brunekreef, 2021[122]). While some studies in Europe may bring mixed results, research in North America shows that areas with a high concentration of low-economic status communities tend to have higher concentrations of air pollutants (Hajat, Hsia and O’Neill, 2015[124]).
Because of the pandemic, people are spending more time than ever indoors, which increases the risks of indoor air pollution from extended cooking time, gas stove usage and occupant density (Chapter 3). Occupants of lower socio-economic households are more likely to live in over-crowded dwellings with poor ventilation, exacerbating these risks (Ferguson et al., 2020[125]). These households also tend to have more smokers; the risk of second-hand smoke, especially for children, will be higher during COVID-19 due to increased time spent indoors (Brunekreef, 2021[122]).
Reductions in traffic pollutants may be especially important for children living in urban areas. Confinement measures led to short-term drops in traffic-related pollutants: NO2 levels decreased 30-50% during European lockdowns, although PM2.5 levels decreased only slightly (5 to 20%) (Brunekreef, 2021[122]). A two-decade cohort study of 2 039 British children found that those who were exposed to higher levels of traffic-related air pollution as a child, especially NO2 and PM10, were more likely to have poor mental health at age 18 (Reuben et al., 2021[126]).30
Access to green space improves physical and mental well-being, but is less available to low-income and racial and ethnic minority households
The pandemic and the ensuing lockdowns have highlighted pre-existing inequalities in access to private green space, especially for those living in urban areas and in low-income households and racial/ethnic minorities. A 2019 study of ten cities in the United States found that lower-income neighbourhoods, and those with higher shares of racial and ethnic minority groups, were less likely to have access to green spaces, which include gardens, balconies, small parks and nearby trees (Nesbitt et al., 2019[127]). Another pre-pandemic survey from Australia found that green space availability is lower in urban areas with a higher percentage of low-income households (Astell-Burt et al., 2014[128]). Survey data collected during the first French lockdown (during which residents were not allowed to travel more than 1 kilometre from their home) showed, perhaps unsurprisingly, that those living in urban areas were less likely to access green areas (Recchi et al., 2020[129]). Data collected in England during the pandemic found that those living in poverty were almost three times less likely to have access to either shared or private outdoor space (Natural England, 2020[130]; ONS, 2020[131]), and that Black people were four times as likely as white to have no access to outdoor space at home (including private or shared gardens, a patio or balcony) (Figure 6.18, Panel A). However, this same study found more equality in access to public spaces: people living in the most deprived areas have greater access to public parks within a five minutes’ walk (at 34%) than do those living in the least deprived areas (18%) (ONS, 2020[131]).
The benefits of outdoor play for young children are well established (Burns and Gottschalk, 2020[132]; Brussoni, 2019[133]) and outdoor activity has been disrupted due to confinement regulations in many OECD countries. An online study of around 1 500 Canadian parents in April 2020 found that only 4.8% of children (5-11 years-old) and 0.6% of youth (12 to 17) were getting the recommended amount of physical activity time outdoors per day, compared to 12.7% of 5 to 17 year-olds before the pandemic. Children whose parents encouraged physical activity were more likely to play outdoors, as were children living in detached houses (rather than apartments) and those with pet dogs (Moore et al., 2020[134]). A study of 5-13 year-olds in the United States from 25 April to 16 May 2020 found that 36% of parents reported their child had engaged in much less physical activity over the past 7 days, as compared to February 2020 (before the start of the pandemic); only 11% stated their child had increased their amount of physical activity. However, for those engaging in exercise, the likelihood of exercising at home, in the garage or on sidewalks and roads in their neighbourhood increased from pre-COVID time periods (Dunton, Do and Wang, 2020[135]). Pre-pandemic research in the United States has shown that the majority of youth from low-income families engage in physical activity through after-school programmes: during lockdowns, children who do not have access to safe outdoor areas to exercise will be more adversely affected (Romero, 2005[136]). A study of 1 500 15-year-old children in England found that 60% reported having spent less time outdoors since the start of the pandemic (Figure 6.18, Panel B). Certain groups were more affected than others: 71% of children from ethnic minority backgrounds said they spent less time outdoors, compared to 57% of white children, as did 73% of children from low-income households, compared to 57% of children from higher-income households (Natural England, 2020[137]).
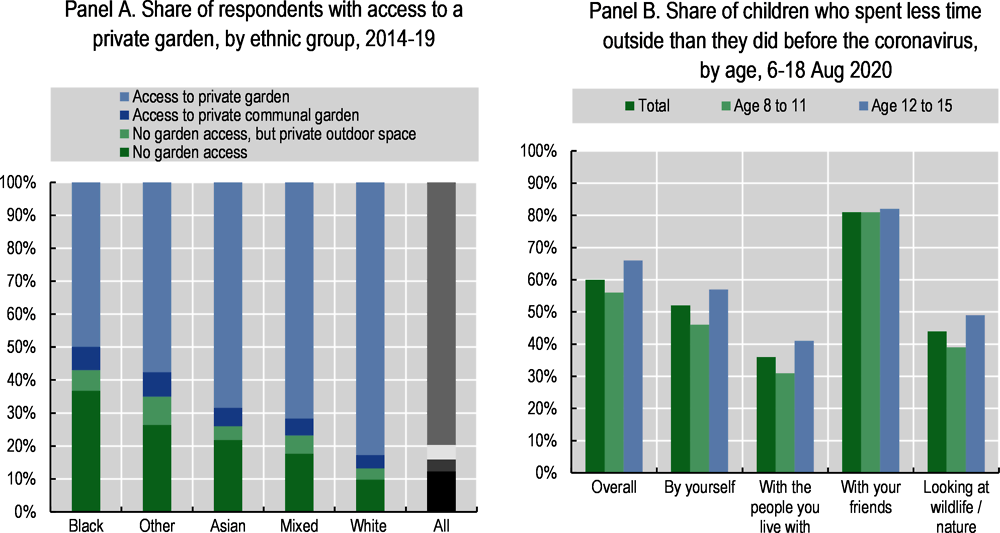
Note: Panel A shows the share of people with access to a private garden by ethnic group in England. Data come from the Natural England – Monitor of Engagement with Natural Environment Survey and refer to the years 2014-2019. Panel B depicts the share of children, by age, who report having spent less time outside since the start of COVID-19. Data come from the People and Nature Survey for England. The survey ran from 6-18 August 2020 and includes data from 1 501 respondents.
Source: ONS (2020[131]), One in eight British households has no garden (database), Office for National Statistics, https://www.ons.gov.uk/economy/environmentalaccounts/articles/oneineightbritishhouseholdshasnogarden/2020-05-14; and Natural England (2020[137]), The people and nature survey for England: Children’s survey (experimental statistics) (database), Office for National Statistics, https://www.gov.uk/government/statistics/the-people-and-nature-survey-for-england-child-data-wave-1-experimental-statistics/the-people-and-nature-survey-for-england-childrens-survey-experimental-statistics#childrens-time-outside-during-the-pandemic.
OECD (forthcoming), Health at a Glance 2021: OECD Indicators, OECD Publishing, Paris
OECD (2021), “Tackling the mental health impact of the COVID-19 crisis: An integrated, whole-of-society response,” OECD Policy Responses to Coronavirus (COVID-19), OECD Publishing, Paris, https://doi.org/10.1787/0ccafa0b-en
OECD (2021), “Supporting young people’s mental health through the COVID-19 crisis”, OECD Policy Responses to Coronavirus (COVID-19), OECD Publishing, Paris, https://doi.org/10.1787/84e143e5-en
WHO Regional Office for Europe/The European Commission/European Observatory on Health Systems and Policies (n.d.), COVID-19 Health System Response Monitor, https://www.covid19healthsystem.org/mainpage.aspx
OECD (2021), The State of Global Education: 18 Months into the COVID Pandemic, OECD Publishing, Paris, https://doi.org/10.1787/1a23bb23-en
OECD (2020]), Lessons for Education from COVID-19: A Policy Maker’s Handbook for More Resilient Systems, OECD Publishing, Paris, https://doi.org/10.1787/0a530888-en
OECD (2021), Data Insights: Green Recovery, OECD, Paris, http://www.oecd.org/coronavirus/en/data-insights
References
[142] Abdallah, S. and S. Shah (2012), Well-being Patterns Uncovered: An analysis of UK data, New Economics Foundation, https://neweconomics.org/2012/11/well-patterns-uncovered.
[144] ABS (2016), Australian Demographic Statistics, Jun 2016, Australian Demographic Statistics, https://www.abs.gov.au/AUSSTATS/[email protected]/7d12b0f6763c78caca257061001cc588/2d2860dfa430d432ca2580eb001335bb!OpenDocument (accessed on 21 June 2021).
[95] Adams-Prassl, A. et al. (2020), “Inequality in the impact of the coronavirus shock: Evidence from real time surveys”, IZA Discussion Paper 13183, https://www.iza.org/publications/dp/13183/inequality-in-the-impact-of-the-coronavirus-shock-evidence-from-real-time-surveys.
[38] AIHW (2021), The first year of COVID-19 in Australia: direct and indirect health effects, Summary - Australian Institute of Health and Welfare, Australian Institute of Health and Welfare, https://www.aihw.gov.au/reports/burden-of-disease/the-first-year-of-covid-19-in-australia/summary.
[41] Alhmidi, M. (2020), “Feds need better data on COVID-19 in Indigenous communities, Marc Miller says”, CBC News, https://www.cbc.ca/news/canada/saskatchewan/federal-government-covid-19-data-indigenous-communities-1.5811043.
[57] Ali, M. et al. (2019), “Utilization of mental health services in educational setting by adolescents in the United States”, Journal of School Health, Vol. 89/5, pp. 393-401, https://doi.org/10.1111/josh.12753.
[96] Alon, T. et al. (2020), “The impact of COVID-19 on gender equality”, NBER Working Paper Series, No. 26947, National Bureau of Economics, https://www.nber.org/system/files/working_papers/w26947/w26947.pdf.
[116] Andrew, A. et al. (2020), Learning during the lockdown: Real-time data on children’s experiences during home learning, Institute for Fiscal Studies, https://doi.org/10.1920/BN.IFS.2020.BN0288.
[23] Arias, E., B. Tejada-Vera and F. Ahmad (2021), “Provisional life expectancy estimates for January through June, 2020”, Vital Statistics Rapid Release, Vol. 10, https://www.cdc.gov/nchs/data/vsrr/VSRR10-508.pdf (accessed on 3 March 2021).
[98] Armbruster, S. and V. Klotzbücher (2020), “COVID-19, social distancing, and mental health in Germany”, Albert-Ludwigs-Universität Freiburg, Wilfried-Guth-Stiftungsprofessur für Ordnungs- und Wettbewerbspolitik, Freiburg i. Br. Diskussionsbeiträge, 2020-04, http://hdl.handle.net/10419/218885.
[128] Astell-Burt, T. et al. (2014), “Do low-income neighbourhoods have the least green space? A cross-sectional study of Australia’s most populous cities”, BMC Public Health, Vol. 14/1, pp. 1-11, https://doi.org/10.1186/1471-2458-14-292.
[36] Australian Government Department of Health (2021), “Communicable Diseases Intelligence 2021 - Aboriginal and Torres Strait Islander Epidemiology Report on COVID-19, 28 February 2021”, Communicable Diseases Intelligence, No. 45, https://doi.org/10.33321/cdi.2021.45.27.
[143] Australian Institute of Health and Welfare (2019), Profile of Indigenous Australians, Australia’s Welfare 2019, https://www.aihw.gov.au/reports/australias-welfare/profile-of-indigenous-australians.
[88] Bartlett, T. (2021), “The pandemic suicide crisis is unsupported by the data”, The Atlantic, https://www.theatlantic.com/health/archive/2021/04/pandemic-suicide-crisis-unsupported-data/618660/.
[74] Berlin, G. et al. (2021), The US nursing workforce in 2021, McKinsey & Company, https://www.mckinsey.com/industries/healthcare-systems-and-services/our-insights/nursing-in-2021-retaining-the-healthcare-workforce-when-we-need-it-most.
[122] Brunekreef, B. (2021), Air Pollution and COVID-19, Policy Department for Economic, Scientific and Quality of Life Policies, https://www.europarl.europa.eu/RegData/etudes/STUD/2021/658216/IPOL_STU(2021)658216_EN.pdf.
[133] Brussoni, M. (2019), “Why outdoor play?”, Encyclopedia on Early Childhood Development, https://www.child-encyclopedia.com/outdoor-play.
[132] Burns, T. and F. Gottschalk (eds.) (2020), Education in the Digital Age: Healthy and Happy Children, Educational Research and Innovation, OECD Publishing, Paris, https://dx.doi.org/10.1787/1209166a-en.
[108] Carey, B. (2021), “Why older people managed to stay happier through the pandemic”, The New York Times, https://www.nytimes.com/2021/03/12/health/covid-pandemic-happiness-age.html.
[107] Carstensen, L., Y. Shavit and J. Barnes (2020), “Age Advantages in Emotional Experience Persist Even Under Threat From the COVID-19 Pandemic”, Psychological Science, Vol. 31/11, pp. 1374-1385, https://doi.org/10.1177/0956797620967261.
[27] CDC (2021), COVID-19 hospitalization and death by race/ethnicity (database), https://www.cdc.gov/coronavirus/2019-ncov/covid-data/investigations-discovery/hospitalization-death-by-race-ethnicity.html#footnote01 (accessed on 11 February 2021).
[71] Center for Translational Neuroscience (2020), “Flattening the other curve: Trends for young children’s mental health are good for some but concerning for others”, Medium, https://medium.com/rapid-ec-project/flattening-the-other-curve-7be1e574b340.
[104] CEPREMAP/INSEE (n.d.), Le bien-être en France, http://www.cepremap.fr/Duree.html (accessed on 15 June 2021).
[112] Chen, L. et al. (2021), Teacher Survey: Learning loss is global — and significant, McKinsey & Company, https://www.mckinsey.com/industries/public-and-social-sector/our-insights/teacher-survey-learning-loss-is-global-and-significant?cid=other-eml-alt-mip-mck&hdpid=1a57cf47-eae2-400f-b9f0-fd8edddbbfb6&hctky=2909643&hlkid=b53175decdec48bbb6888bd21b5a168b (accessed on 10 June 2021).
[6] Chetty, R. et al. (2016), “The association between income and life expectancy in the United States, 2001-2014”, JAMA - Journal of the American Medical Association, Vol. 315/16, pp. 1750-1766, https://doi.org/10.1001/jama.2016.4226.
[2] Chinnappan, S. (2021), Long COVID: The impact on women and ongoing research, Society for Women’s Health Research, https://swhr.org/long-covid-the-impact-on-women-and-ongoing-research/.
[44] Cook, D. et al. (2020), “He kāhui waiora: Living standards framework and he ara waiora COVID-19: Impacts on wellbeing”, Discussion Papers, No. 20/02, The New Zealand Treasury, https://www.treasury.govt.nz/publications/dp/dp-20-02.
[67] COVID Impact Survey (2020), Social, economic, health impacts persist as Americans grapple with convergence of pandemic and civil unrest, https://www.covid-impact.org/blog/social-economic-health-impacts-persist-as-americans-grapple-with-convergence-of-pandemic-and-civil-unrest.
[79] Czeisler, M. et al. (2020), “Mental health, substance use, and suicidal ideation during the COVID-19 pandemic — United States, June 24–30, 2020”, Morbidity and Mortality Weekly Report, Vol. 69/32, pp. 1049-1057, https://doi.org/10.15585/mmwr.mm6932a1.
[145] Department of Finance Canada (2021), Budget 2021: A recovery plan for jobs, growth, and resilience, Annex 4: Gender, diversity, and quality of life statement, https://www.budget.gc.ca/2021/report-rapport/anx4-en.html.
[94] Devlin, K. and N. Kent (2021), As pandemic continues, more in US and Europe feel major impact on their lives, Pew Research Center, https://www.pewresearch.org/global/2021/02/03/as-pandemic-continues-more-in-u-s-and-europe-feel-major-impact-on-their-lives/.
[115] Di Pietro, G. et al. (2020), The Likely Impact of COVID-19 on Education: Reflections based on the existing literature and recent international datasets, Publications Office of the European Union, Luxembourg, https://doi.org/10.2760/126686.
[42] Dong, E., H. Du and L. Gardner (2020), “An interactive web-based dashboard to track COVID-19 in real time”, The Lancet Infectious Diseases, Vol. 20/5, pp. 533-534, https://doi.org/10.1016/S1473-3099(20)30120-1.
[8] Drefahl, S. et al. (2020), “A population-based cohort study of socio-demographic risk factors for COVID-19 deaths in Sweden”, Nature Communications, Vol. 11/1, pp. 1-7, https://doi.org/10.1038/s41467-020-18926-3.
[135] Dunton, G., B. Do and S. Wang (2020), “Early effects of the COVID-19 pandemic on physical activity and sedentary behavior in children living in the U.S”, BMC Public Health, Vol. 20/1351, https://doi.org/10.1186/s12889-020-09429-3.
[63] Durães e Lusa, M. (2020), “O confinamento em família foi “sufocante” para 35% dos jovens LGBT+”, Público, https://www.publico.pt/2020/05/18/p3/noticia/confinamento-familia-sufocante-35-jovens-lgbt-1917027.
[47] ECLAC (2021), The Impact of COVID-19 on Indigenous Peoples in Latin America (Abya Yala): Between invisibility and collective resistance, United Nations Economic Commission for Latin America and the Caribbean, https://www.cepal.org/en/publications/46698-impact-covid-19-indigenous-peoples-latin-america-abya-yala-between-invisibility.
[16] Eichenbaum, M., S. Rebelo and M. Trabandt (2020), “Inequality in Life and Death”, https://www.kellogg.northwestern.edu/faculty/rebelo/htm/inequality.pdf.
[64] El Heraldo (2021), “Línea de atención en salud mental recibió más de 18 mil llamadas en pandemia”, El Heraldo, https://www.elheraldo.co/colombia/linea-de-atencion-en-salud-mental-recibio-mas-de-18-mil-llamadas-en-un-ano-de-pandemia.
[118] Engzell, P., A. Frey and M. Verhagen (2021), “Learning loss due to school closures during the COVID-19 pandemic”, Proceedings of the National Academy of Sciences of the United States of America, Vol. 118/17, p. e2022376118, https://doi.org/10.1073/PNAS.2022376118.
[53] Eurostat (n.d.), European health interview survey (EHIS) (database), https://ec.europa.eu/eurostat/statistics-explained/index.php?title=Glossary:European_health_interview_survey_(EHIS) (accessed on 16 June 2021).
[90] FAIR Health (2021), “The impact of COVID-19 on pediatric mental health: A study of private healthcare claims”, FAIR Health White Paper, https://s3.amazonaws.com/media2.fairhealth.org/whitepaper/asset/The%20Impact%20of%20COVID-19%20on%20Pediatric%20Mental%20Health%20-%20A%20Study%20of%20Private%20Healthcare%20Claims%20-%20A%20FAIR%20Health%20White%20Paper.pdf.
[125] Ferguson, L. et al. (2020), “Exposure to indoor air pollution across socio-economic groups in high-income countries: A scoping review of the literature and a modelling methodology”, Environment International, Vol. 143, https://doi.org/10.1016/j.envint.2020.105748.
[15] Finch, W. and M. Hernández Finch (2020), “Poverty and COVID-19: Rates of incidence and deaths in the United States during the first 10 weeks of the pandemic”, Frontiers in Sociology, Vol. 5/47, https://doi.org/10.3389/FSOC.2020.00047.
[100] Gallup (n.d.), Gallup World Poll, https://www.gallup.com/analytics/318875/global-research.aspx (accessed on 18 June 2021).
[139] Goldberg, D. and P. Williams (1988), A User’s Guide to the General Health Questionnaire, NFER-Nelson, Windsor.
[40] Government of Canada (2020), Government of Canada COVID-19 update for Indigenous Peoples and communities, https://www.canada.ca/en/indigenous-services-canada/news/2020/11/government-of-canada-covid-19-update-for-indigenous-peoples-and-communities1.html.
[30] Graham, C. et al. (2020), Well-being and mental health amid COVID-19: Differences in resilience across minorities and whites, The Brookings Institution, https://www.brookings.edu/research/well-being-and-mental-health-amid-covid-19-differences-in-resilience-across-minorities-and-whites/.
[124] Hajat, A., C. Hsia and M. O’Neill (2015), “Socioeconomic disparities and air pollution exposure: A global review”, Current environmental health reports, Vol. 2/4, pp. 440-450, https://doi.org/10.1007/s40572-015-0069-5.
[101] Hale, T. et al. (2021), “A global panel database of pandemic policies (Oxford COVID-19 Government Response Tracker)”, Nature Human Behaviour, Vol. 5/4, pp. 529-538, https://doi.org/10.1038/s41562-021-01079-8 (accessed on 11 June 2021).
[89] Hawton, K. et al. (2021), “Self-harm and the COVID-19 pandemic: A study of factors contributing to self-harm during lockdown restrictions”, Journal of Psychiatric Research, Vol. 137, pp. 437-443, https://doi.org/10.1016/j.jpsychires.2021.03.028.
[117] Hélary, L. (2020), “École à la maison: Des inégalités de pédagogie selon les familles”, Ouest France, https://www.ouest-france.fr/education/enseignement/ecole-la-maison-des-inegalites-de-pedagogie-selon-les-familles-6830947.
[93] Helliwell, J. et al. (2021), World Happiness Report 2021, Sustainable Development Solutions Network, https://worldhappiness.report/ed/2021/.
[102] Helliwell, J., G. Schellenberg and J. Fonberg (2020), “Life satisfaction in Canada before and during the COVID-19 pandemic”, Analytical Studies Branch Research Paper Series, No. 457, Statistics Canada, https://www150.statcan.gc.ca/n1/en/pub/11f0019m/11f0019m2020020-eng.pdf?st=s6m4rNgZ (accessed on 11 February 2021).
[35] Hlavinka, E. (2020), “Navajo Country: COVID-19 cases trend down, but need still high”, MedPageToday, https://www.medpagetoday.com/infectiousdisease/covid19/88041.
[99] Huebener, M. et al. (2020), “Parental well-being in times of COVID-19 in Germany”, IZA Discussion Paper, No. 13556, https://www.iza.org/de/publications/dp/13556/parental-well-being-in-times-of-covid-19-in-germany.
[52] Imperial College London YouGov (2020), Covid-19 behaviour tracker data hub, https://github.com/YouGov-Data/covid-19-tracker (accessed on 21 July 2021).
[85] Iob, E., A. Steptoe and D. Fancourt (2020), “Abuse, self-harm and suicidal ideation in the UK during the COVID-19 pandemic”, The British Journal of Psychiatry, Vol. 217/4, pp. 543-546, https://doi.org/10.1192/BJP.2020.130.
[92] Japanese National Police Agency (2021), 令和2年中における自殺の状況, https://www.npa.go.jp/safetylife/seianki/jisatsu/R03/R02_jisatuno_joukyou.pdf (accessed on 10 June 2021).
[76] Kaliszewski, M. (2021), Substance Abuse in Doctors - Statistics and treatment options, American Addiction Centers, https://americanaddictioncenters.org/medical-professionals/substance-abuse-among-doctors-key-statistics.
[37] Keck, M. (2020), “COVID-19 rates among Indigenous Australians are low thanks to an “extraordinary” Aboriginal-led response”, Global Citizen, https://www.globalcitizen.org/en/content/covid-19-rates-indigenous-australians/.
[68] Keeter, S. (2020), “People financially affected by COVID-19 outbreak are experiencing more psychological distress than others”, Pewresearch.org, https://www.pewresearch.org/fact-tank/2020/03/30/people-financially-affected-by-covid-19-outbreak-are-experiencing-more-psychological-distress-than-others/.
[1] Kelland, K. (2021), “Women in 40s, 50s who survive COVID more likely to suffer persistent problems: UK studies”, Reuters, https://www.reuters.com/article/us-health-coronavirus-longcovid-women-idUSKBN2BG1SO.
[123] Kerr, G., D. Goldberg and S. Anenberg (2021), “COVID-19 pandemic reveals persistent disparities in nitrogen dioxide pollution”, Proceedings of the National Academy of Sciences, Vol. 118/30, p. e2022409118, https://doi.org/10.1073/PNAS.2022409118.
[62] Kneale, D. and L. Bécares (2020), “The mental health and experiences of discrimination of LGBTQ+ people during the COVID-19 pandemic: Initial findings from the Queerantine Study”, medRxiv, https://doi.org/10.1101/2020.08.03.20167403.
[140] Kroenke, K. et al. (2009), “An ultra-brief screening scale for anxiety and depression: the PHQ-4”, Psychosomatics, Vol. 50/6, pp. 613-621, https://doi.org/10.1176/APPI.PSY.50.6.613.
[81] Kühne, S. et al. (2020), “The need for household panel surveys in times of crisis: The case of SOEP-CoV”, Survey Research Methods, Vol. 14/2, pp. 195-203, https://doi.org/10.18148/srm/2020.v14i2.7748 (accessed on 19 May 2021).
[34] Lakhani, N. (2021), “Exclusive: Indigenous Americans dying from COVID at twice the rate of white Americans”, The Guardian, https://www.theguardian.com/us-news/2021/feb/04/native-americans-coronavirus-covid-death-rate.
[97] Leslie, E. and R. Wilson (2021), “Sheltering in place and domestic violence: Evidence from calls for service during COVID-19”, Journal of Public Economics, https://doi.org/10.2139/ssrn.3600646.
[3] Lu, D. (2021), “Which groups are still dying of Covid in the U.S.?”, The New York Times, https://www.nytimes.com/interactive/2021/06/10/us/covid-death-patterns.html?action=click&module=Top%20Stories&pgtype=Homepage.
[78] MacBride, K. (2020), “With COVID-19, healthcare workers are even more vulnerable to suicide”, Healthline, https://www.healthline.com/health/mental-health/healthcare-workers-suicide-covid-19#1.
[5] Marmot, M. et al. (2010), Fair society healthy lives (The Marmot Review), Institute of Health Equity, https://www.instituteofhealthequity.org/resources-reports/fair-society-healthy-lives-the-marmot-review.
[21] McFarling, U. (2020), “Fearing deportation, many immigrants at higher risk of Covid-19 are afraid to seek testing or care”, StatNews, https://www.statnews.com/2020/04/15/fearing-deportation-many-immigrants-at-higher-risk-of-covid-19-are-afraid-to-seek-testing-or-care/.
[45] Ministry of Health New Zealand (2021), COVID-19: Case demographics, https://www.health.govt.nz/our-work/diseases-and-conditions/covid-19-novel-coronavirus/covid-19-data-and-statistics/covid-19-case-demographics.
[134] Moore, S. et al. (2020), “Impact of the COVID-19 virus outbreak on movement and play behaviours of Canadian children and youth: A national survey”, International Journal of Behavioral Nutrition and Physical Activity, Vol. 17/1, pp. 1-11, https://doi.org/10.1186/s12966-020-00987-8.
[150] Morgan, D. et al. (2020), “Excess mortality: Measuring the direct and indirect impact of COVID-19”, OECD Health Working Papers, No. 122, OECD Publishing, Paris, https://dx.doi.org/10.1787/c5dc0c50-en.
[130] Natural England (2020), The people and nature survey for England: Adult data Y1Q1 (April - June 2020) (experimental statistics), Natural England, https://www.gov.uk/government/statistics/the-people-and-nature-survey-for-england-adult-data-y1q1-april-june-2020-experimental-statistics/the-people-and-nature-survey-for-england-adult-data-y1q1-april-june-2020-experimental-statistics (accessed on 24 February 2021).
[137] Natural England (2020), The people and nature survey for England: Children’s survey (experimental statistics), https://www.gov.uk/government/statistics/the-people-and-nature-survey-for-england-child-data-wave-1-experimental-statistics/the-people-and-nature-survey-for-england-childrens-survey-experimental-statistics#childrens-time-outside-during-the-pandemic (accessed on 10 June 2021).
[86] NCHS (2020), National Health Interview Survey Early Release Program, National Center for Health Statistics, https://www.cdc.gov/nchs/data/nhis/earlyrelease/ERmentalhealthbyrace-508.pdf (accessed on 11 February 2021).
[127] Nesbitt, L. et al. (2019), “Who has access to urban vegetation? A spatial analysis of distributional green equity in 10 US cities”, Landscape and Urban Planning, Vol. 181, pp. 51-79, https://doi.org/10.1016/J.LANDURBPLAN.2018.08.007.
[146] NPR (2020), “As pandemic deaths add up, racial disparities persist — And in some cases worsen”, National Public Radio, https://www.npr.org/sections/health-shots/2020/09/23/914427907/as-pandemic-deaths-add-up-racial-disparities-persist-and-in-some-cases-worsen?t=1608509692531&t=1612899321921.
[114] OECD (2021), “Securing the recovery, ambition, and resilience for the well-being of children in the post-COVID-19 decade”, OECD Policy Responses to Coronavirus (COVID-19), OECD Publishing, Paris, https://doi.org/10.1787/0f02237a-en.
[56] OECD (2021), “Supporting young people’s mental health through the COVID-19 crisis”, OECD Policy Responses to Coronavirus (COVID-19), OECD Publishing, Paris, https://doi.org/10.1787/84e143e5-en.
[49] OECD (2021), “Tackling the mental health impact of the COVID-19 crisis: An integrated, whole-of-society response”, OECD Policy Responses to Coronavirus (COVID-19), OECD Publishing, Paris, https://doi.org/10.1787/0ccafa0b-en.
[113] OECD (2021), The State of Global Education: 18 Months into the Pandemic, OECD Publishing, Paris, https://doi.org/10.1787/1a23bb23-en.
[111] OECD (2021), The State of School Education: One Year into the COVID Pandemic, OECD Publishing, Paris, https://doi.org/10.1787/201dde84-en.
[4] OECD (2020), How’s Life? 2020: Measuring Well-being, OECD Publishing, Paris, https://dx.doi.org/10.1787/9870c393-en.
[147] OECD (2020), International Migration Outlook 2020, OECD Publishing, Paris, https://dx.doi.org/10.1787/ec98f531-en.
[43] OECD (2020), Linking Indigenous Communities with Regional Development in Canada, OECD Rural Policy Reviews, OECD Publishing, Paris, https://dx.doi.org/10.1787/fa0f60c6-en.
[29] OECD (2020), “Policy implications of Coronavirus crisis for rural development”, OECD Policy Responses to Coronavirus (COVID-19), OECD Publishing, Paris, https://doi.org/10.1787/6b9d189a-en.
[19] OECD (2020), “What is the impact of the COVID-19 pandemic on immigrants and their children?”, OECD Policy Responses to Coronavirus (COVID-19), OECD Publishing, Paris, https://dx.doi.org/10.1787/e7cbb7de-en.
[121] OECD (2019), PISA 2018 Results (volume III): What School Life Means for Students’ Lives, PISA, OECD Publishing, Paris, https://dx.doi.org/10.1787/acd78851-en.
[7] OECD (2017), Health at a Glance 2017: OECD Indicators, OECD Publishing, Paris, https://dx.doi.org/10.1787/health_glance-2017-en.
[12] OECD (n.d.), COVID-19 Health Indicators (database), https://stats.oecd.org/index.aspx?queryid=104676# (accessed on 19 September 2021).
[65] ONS (2021), Coronavirus and depression in adults, Great Britain: January to March 2021, Office for National Statistics, https://www.ons.gov.uk/peoplepopulationandcommunity/wellbeing/articles/coronavirusanddepressioninadultsgreatbritain/januarytomarch2021.
[14] ONS (2021), Prevalence of ongoing symptoms following coronavirus (COVID-19) infection in the UK, Office for National Statistics, https://www.ons.gov.uk/peoplepopulationandcommunity/healthandsocialcare/conditionsanddiseases/bulletins/prevalenceofongoingsymptomsfollowingcoronaviruscovid19infectionintheuk/4june2021 (accessed on 21 June 2021).
[13] ONS (2021), Technical article: Updated estimates of the prevalence of post-acute symptoms among people with coronavirus (COVID-19) in the UK, Office for National Statistics, https://www.ons.gov.uk/peoplepopulationandcommunity/healthandsocialcare/conditionsanddiseases/articles/technicalarticleupdatedestimatesoftheprevalenceofpostacutesymptomsamongpeoplewithcoronaviruscovid19intheuk/26april2020to1august2021.
[84] ONS (2020), Coronavirus and the social impacts on different ethnic groups in the UK: 2020, Office for National Statistics, https://www.ons.gov.uk/peoplepopulationandcommunity/culturalidentity/ethnicity/articles/coronavirusandthesocialimpactsondifferentethnicgroupsintheuk/2020.
[103] ONS (2020), Coronavirus and the social impacts on young people in Great Britain, Office for National Statistics, https://www.ons.gov.uk/peoplepopulationandcommunity/birthsdeathsandmarriages/ageing/articles/coronavirusandthesocialimpactsonyoungpeopleingreatbritain/3aprilto10may2020#impacts-on-well-being (accessed on 21 June 2021).
[131] ONS (2020), One in eight British households has no garden, Office for National Statistics, https://www.ons.gov.uk/economy/environmentalaccounts/articles/oneineightbritishhouseholdshasnogarden/2020-05-14 (accessed on 24 February 2021).
[25] ONS (2020), Updating ethnic contrasts in deaths involving the coronavirus (COVID-19), England and Wales: deaths occurring 2 March to 28 July 2020, Office for National Statistics, https://www.ons.gov.uk/peoplepopulationandcommunity/birthsdeathsandmarriages/deaths/articles/updatingethniccontrastsindeathsinvolvingthecoronaviruscovid19englandandwales/deathsoccurring2marchto28july2020#main-points (accessed on 11 February 2021).
[28] ONS (2020), Why have Black and South Asian people been hit hardest by COVID-19?, Office for National Statistics, https://www.ons.gov.uk/peoplepopulationandcommunity/healthandsocialcare/conditionsanddiseases/articles/whyhaveblackandsouthasianpeoplebeenhithardestbycovid19/2020-12-14 (accessed on 11 February 2021).
[109] ONS (n.d.), Personal and economic well-being in Great Britain: September 2020 (database), Office for National Statistics, https://www.ons.gov.uk/peoplepopulationandcommunity/wellbeing/datasets/incomegroupsplitestimatesonpersonalandeconomicwellbeingacrosstime (accessed on 15 December 2020).
[48] Our World in Data (n.d.), Colombia: Coronavirus Pandemic Country Profile (database), https://ourworldindata.org/coronavirus/country/colombia (accessed on 22 September 2021).
[73] Potloc (2020), Insights from the Canadian front lines of the COVID-19 pandemic, Potloc, https://www.potloc.com/blog/en/potloc-study-canadian-health-workers-insights-front-lines-covid-19-pandemic.
[51] Racine, N. et al. (2021), “When the bough breaks: A systematic review and meta-analysis of mental health symptoms in mothers of young children during the COVID-19 pandemic”, https://doi.org/10.31234/OSF.IO/U8PNH.
[50] Racine, N. et al. (2021), “Maternal depressive and anxiety symptoms before and during the COVID-19 pandemic in Canada: a longitudinal analysis”, The Lancet Psychiatry, Vol. 8/5, pp. 405-415, https://doi.org/10.1016/S2215-0366(21)00074-2.
[77] Rahman, A. and V. Plummer (2020), “COVID-19 related suicide among hospital nurses: Case study evidence from worldwide media reports”, Psychiatry Research, Vol. 291, p. 113272, https://doi.org/10.1016/J.PSYCHRES.2020.113272.
[18] Rao, A. et al. (2021), “A disproportionate epidemic: COVID-19 cases and deaths among essential workers in Toronto, Canada”, medRxiv, https://doi.org/10.1101/2021.02.15.21251572.
[61] Raybaud, A. (2021), “Anorexie, boulimie… La crise sanitaire provoque une hausse inquiétante des troubles alimentaires chez les jeunes adultes”, Le Monde, https://www.lemonde.fr/campus/article/2021/04/27/anorexie-boulimie-la-hausse-inquietante-des-troubles-alimentaires-chez-les-jeunes-adultes_6078198_4401467.html#xtor=AL-32280270.
[32] Ray, R. (2020), Why are Blacks dying at higher rates from COVID-19?, The Brookings Institution, https://www.brookings.edu/blog/fixgov/2020/04/09/why-are-blacks-dying-at-higher-rates-from-covid-19/.
[129] Recchi, E. et al. (2020), “Lockdown for all, hardship for some: Insights from the first wave of the CoCo project”, HAL, https://halshs.archives-ouvertes.fr/halshs-03070206/document.
[138] Rentsch, C. et al. (2020), “Patterns of COVID-19 testing and mortality by race and ethnicity among United States veterans: A nationwide cohort study”, PLOS Medicine, Vol. 17/9, https://doi.org/10.1371/journal.pmed.1003379.
[126] Reuben, A. et al. (2021), “Association of air pollution exposure in childhood and adolescence with psychopathology at the transition to adulthood”, JAMA Network Open, Vol. 4/4, https://doi.org/10.1001/JAMANETWORKOPEN.2021.7508.
[17] Rho, H., H. Brown and S. Fremstad (2020), A basic demographic profile of workers in frontline industries, Center for Economic and Policy Research, Washington, D.C., https://cepr.net/wp-content/uploads/2020/04/2020-04-Frontline-Workers.pdf?__cf_chl_jschl_tk__=pmd_.7KR_H_gmypiRrI3OgamZtEQpg9w0Ec20tjZf0aMaoc-1631627106-0-gqNtZGzNAlCjcnBszQcl.
[11] Richard, L. et al. (2021), “Testing, infection and complication rates of COVID-19 among people with a recent history of homelessness in Ontario, Canada: A retrospective cohort study”, Canadian Medical Association Open Access Journal, Vol. 9/1, pp. E1-E9, https://doi.org/10.9778/CMAJO.20200287.
[39] Richardson, L. and A. Crawford (2020), “How Indigenous communities in Canada organized an exemplary public health response to COVID”, Scientific American, https://www.scientificamerican.com/article/how-indigenous-communities-in-canada-organized-an-exemplary-public-health-response-to-covid/.
[91] Rich, M. and H. Hida (2021), “As pandemic took hold, suicide rose among Japanese women”, The New York Times, https://www.nytimes.com/2021/02/22/world/asia/japan-women-suicide-coronavirus.html.
[9] Robert Koch Institut (2021), Soziale Unterschiede in der COVID-19-Sterblichkeit während der zweiten Infektionswelle in Deutschland, https://www.rki.de/DE/Content/GesundAZ/S/Sozialer_Status_Ungleichheit/Faktenblatt_COVID-19-Sterblichkeit.html.
[136] Romero, A. (2005), “Low-income neighborhood barriers and resources for adolescents’ physical activity”, Journal of Adolescent Health, Vol. 36/3, pp. 253-259, https://doi.org/10.1016/j.jadohealth.2004.02.027.
[75] Schernhammer, E. and G. Colditz (2004), “Suicide rates among physicians: A quantitative and gender assessment (meta-analysis)”, The American Journal of Psychiatry, Vol. 161/12, pp. 2295-2302, https://doi.org/10.1176/APPI.AJP.161.12.2295.
[105] SDSN Secretariat (2020), New report highlights the impact of COVID-19 on life satisfaction worldwide, Sustainable Development Solutions Network, https://www.unsdsn.org/new-report-highlights-the-impact-of-covid-19-on-life-satisfaction-worldwide.
[120] Smith, E. and R. Reeves (2021), Black moms facing the toughest childcare crunch: How policy can help, The Brookings Institution, https://www.brookings.edu/blog/how-we-rise/2021/02/24/black-moms-facing-the-toughest-childcare-crunch-how-policy-can-help/?utm_campaign=Economic%20Studies&utm_medium=email&utm_content=113794600&utm_source=hs_email.
[60] Solmi, F., J. Downs and D. Nicholls (2021), “COVID-19 and eating disorders in young people”, The Lancet Child and Adolescent Health, Vol. 5, pp. 316-318, https://doi.org/10.1016/S2352-4642(21)00094-8.
[58] Spettigue, W. et al. (2021), “The impact of COVID-19 on adolescents with eating disorders: a cohort study”, Journal of Eating Disorders, Vol. 9/1, p. 65, https://doi.org/10.1186/s40337-021-00419-3.
[141] Spitzer, R. et al. (2006), “A brief measure for assessing generalized anxiety disorder: The GAD-7”, Archives of internal medicine, Vol. 166/10, pp. 1092-1097, https://doi.org/10.1001/ARCHINTE.166.10.1092.
[10] Stantcheva, S. (2021), Inequalities in the times of a pandemic, https://www.economic-policy.org/wp-content/uploads/2021/04/9103_Inequalities-in-the-Times-of-a-Pandemic.pdf.
[20] Statistics Canada (2021), COVID-19 deaths among immigrants: Evidence from the early months of the pandemic, https://www150.statcan.gc.ca/n1/pub/45-28-0001/2021001/article/00017-eng.htm (accessed on 22 September 2021).
[148] Statistics Canada (2021), Provisional death counts and excess mortality, January to December 2020, Statistics Canada, https://www150.statcan.gc.ca/n1/daily-quotidien/210310/dq210310c-eng.htm.
[26] Statistics Canada (2020), COVID-19 mortality rates in Canada’s ethno-cultural neighbourhoods, https://www150.statcan.gc.ca/n1/pub/45-28-0001/2020001/article/00079-eng.htm (accessed on 11 February 2021).
[55] Statistics Canada (2020), Gender differences in mental health during the COVID-19 pandemic, StatCan COVID-19, https://www150.statcan.gc.ca/n1/pub/45-28-0001/2020001/article/00047-eng.htm (accessed on 3 March 2021).
[54] Statistics Canada (2020), Impacts of COVID-19 on Canadians: Data collection series, https://www23.statcan.gc.ca/imdb/p2SV.pl?Function=getSurvey&SDDS=5323.
[33] Statistics Canada (2020), Impacts of COVID-19 on immigrants and people designated as visible minorities, Statistics Canada, https://www150.statcan.gc.ca/n1/pub/11-631-x/2020004/s6-eng.htm.
[83] Statistics Canada (2020), Indigenous people and mental health during the COVID-19 pandemic, https://www150.statcan.gc.ca/n1/pub/45-28-0001/2020001/article/00035-eng.htm.
[119] Statistics Canada (2020), School closures and the online preparedness of children during the COVID-19 pandemic, https://www150.statcan.gc.ca/n1/pub/11-626-x/11-626-x2020001-eng.htm.
[82] Statistics Canada (2020), The mental health of population groups designated as visible minorities in Canada during the COVID-19 pandemic, https://www150.statcan.gc.ca/n1/pub/45-28-0001/2020001/article/00077-eng.htm (accessed on 10 February 2021).
[46] Steyn, N. et al. (2021), “Māori and Pacific People in New Zealand have higher risk of hospitalisation for COVID-19”, medRxiv, https://doi.org/10.1101/2020.12.25.20248427.
[22] Sze, S. et al. (2020), “Ethnicity and clinical outcomes in COVID-19: A systematic review and meta-analysis”, EClinicalMedicine, Vol. 29-30, https://doi.org/10.1016/j.eclinm.2020.100630.
[24] Tavernise, S. and A. Goodnough (2021), “Covid causes sharp drop in U.S. life expectancy”, The New York Times, https://www.nytimes.com/2021/02/18/us/covid-life-expectancy.html.
[149] The COVID Tracking Project (2020), The COVID Racial Data Tracker, https://covidtracking.com/race (accessed on 9 February 2021).
[106] The Economist (2021), “The pandemic has changed the shape of global happiness”, The Economist, https://www.economist.com/international/2021/03/20/the-pandemic-has-changed-the-shape-of-global-happiness.
[80] The Scandlon Foundation (2021), Mapping social cohesion: The Scanlon Foundation surveys, https://scanloninstitute.org.au/sites/default/files/2021-02/SC2020%20Report%20Final.pdf (accessed on 15 September 2021).
[59] Touyz, S., H. Lacey and P. Hay (2020), “Eating disorders in the time of COVID-19”, Journal of Eating Disorders, Vol. 8/1, pp. 1-3, https://doi.org/10.1186/s40337-020-00295-3.
[70] Tulsa SEED Study Team (2020), “Parents, teachers, and distance learning during the COVID-19 pandemic: A snapshot from Tulsa”, https://medium.com/@TulsaSEED/parents-teachers-and-distance-learning-during-the-covid-19-pandemic-a-snapshot-from-tulsa-ok-5b5fdb54ea18.
[69] Ueda, M. et al. (2020), “Mental health status of the general population in Japan during the COVID-19 pandemic”, Psychiatry and Clinical Neurosciences, Vol. 74/9, pp. 505-506, https://doi.org/10.1111/PCN.13105.
[110] UNESCO (n.d.), Global Monitoring of School Closures, COVID-19 (database), United Nations Educational, Scientific and Cultural Organization, https://en.unesco.org/covid19/educationresponse (accessed on 5 October 2021).
[72] United Nations (2020), COVID-19 and the need for action on mental health, United Nations Policy Brief, https://www.un.org/sites/un2.un.org/files/un_policy_brief-covid_and_mental_health_final.pdf.
[87] US Census Bureau (n.d.), Measuring household experiences during the coronavirus pandemic, https://www.census.gov/householdpulsedata (accessed on 16 June 2021).
[31] US Census Bureau (n.d.), US Census Bureau QuickFacts: United States (database), https://www.census.gov/quickfacts/fact/table/US/PST045219 (accessed on 22 September 2021).
[66] Wozniak, A. et al. (2020), COVID Impact Survey, National Opinion Research Center, https://www.covid-impact.org/ (accessed on 9 August 2021).
Notes
← 1. Excess death statistics are better able to capture the full effect of the pandemic on fatality rates. The quality of official statistics on COVID-19 deaths may vary across countries due to differences in how deaths are recorded and the quality of measurement. Furthermore, COVID-19 fatality data do not capture the indirect health impacts of the pandemic – such as delays in non-COVID related medical care due to the fact that hospitals are overrun with COVID patients. See Chapter 3 and Morgan et al. (2020[150]) for further discussion of excess mortality statistics.
← 2. The two countries that follow a different pattern, in which the 0-44 age cohort has the highest excess death rate, are Iceland and Canada. In Iceland, this pattern is driven by its small population: there were 22, 17 and -21 excess deaths for the 0-44, 45-64, and 65+ age cohorts during this time period, respectively. The data for Canada are more puzzling, in that the trends are not driven by small population groups. Statistics Canada suggested that this might reflect the indirect consequences of the pandemic, including increases in opioid overdoses in some provinces. However, until more specific cause-of-death data are available it is too soon to say what precisely is driving this trend (Statistics Canada, 2021[148]). Furthermore, the higher excess death rates for younger age groups occurred during the summer and autumn, when COVID deaths were very low nationwide; therefore, it may be indirect or unrelated factors that are playing a role.
← 3. Trend lines for those aged 0-44 are not depicted in Figure 6.2, but on whole point to lower excess mortality rates than the two older age cohorts. Overall death rates (i.e. deaths from all causes) for the youngest age cohort are much lower, meaning that small changes in a given week can lead to large spikes in the data. The erratic nature of the 0-44 trend line is an indication that the excess mortality statistic is picking up a number of things that are unrelated to COVID-19, as very few members of this age group died from the virus.
← 4. Assessing to what extent COVID-19 has affected ethnic and racial minority populations is challenging for a number of reasons. Basic statistics on the number and characteristics of COVID-19 cases are registered by national health systems, based on administrative sources such as testing and hospitalisations. Not all OECD countries consistently record diversity information (or other key socio-economic variables) in case numbers, hospital records or death certificates, nor do they always transmit these data for the compilation of national health and mortality statistics. For example, information on race, ethnicity or migrant status on death certificates is not transferred to the federal level in Germany; is incompletely recorded in Scotland; and is not recorded at all in England, Wales and Northern Ireland. This implies that data from census records, death registrations and hospital statistics in the latter countries have to be linked to provide information about the impact of COVID-19 by race and/or ethnicity (ONS, 2020[25]; OECD, 2020[19]). Many states in the United States have been slow to implement this practice: in May 2020, 51% of cases and 88% of deaths could be attributed to people with an identified race (though states have been working to identify the race of deaths previously recorded without one); by September 2020, only 65% of new cases included an identified race/ethnicity code (The COVID Tracking Project, 2020[149]; NPR, 2020[146]). A year on, 39% of all cumulative cases recorded by April 2021 lacked this information (CDC, 2021[27]). Native Americans in the United States and First Nations, Inuit and Métis communities in Canada, many of whom operate their own health systems, are also not officially required to report COVID-19 data. What is more, numbers of confirmed cases by ethnicity or origin are impacted by the ability of each country to reach the most vulnerable groups; rates of testing among military veterans in the United States up to July 2020 have been found to be lower for Hispanic/Latino and Black communities compared to whites, for instance (Rentsch et al., 2020[138]). Hence, relative COVID-19 related risks among groups, especially those of younger ages less likely to show symptoms, are likely to be underestimated. Moreover, many population surveys, especially the non-official and experimental ones launched throughout 2020 to capture the pandemic’s psychosocial impact in real-time, often either do not contain questions on identity, or have such small sample sizes that any statements would be misleading. For this reason, this chapter uses only surveys with more than 500 observations for each aspect of diversity.
← 5. Consistent with OECD practice (e.g. in the International Migration Outlook (2020[147])), this report uses the words “migrants”, “immigrants” and “foreign-born” synonymously. Unless mentioned otherwise, this includes all persons born abroad, regardless of their migration category, legal status or nationality. Likewise, unless mentioned otherwise, native-born or “non-migrant” include all persons born in the country, regardless of the country of birth of their parents.
← 6. The study included data from 18 728 893 patients from 50 studies in the United Kingdom and the United States.
← 7. The term "visible minority" is used here because it is the official demographic category defined by the Canadian Employment Equity Act, and it is used by Statistics Canada in their surveys. The Employment Equity Act defines visible minorities as "persons, other than Aboriginal peoples, who are non-Caucasian in race or non-white in colour". The visible minority population consists mainly of South Asian, Chinese, Black, Filipino, Latin American, Arab, Southeast Asian, West Asian, Korean and Japanese people. The question of appropriate terminology is currently being reviewed in Canada, in the context of a task force on modernizing the Employment Equity Act (Department of Finance Canada, 2021[145]).
← 8. The term "visible minority" is used here because it is the official demographic category defined by the Canadian Employment Equity Act, and it is used by Statistics Canada in their surveys. The Employment Equity Act defines visible minorities as "persons, other than Aboriginal peoples, who are non-Caucasian in race or non-white in colour". The visible minority population consists mainly of South Asian, Chinese, Black, Filipino, Latin American, Arab, Southeast Asian, West Asian, Korean and Japanese people. The question of appropriate terminology is currently being reviewed in Canada, in the context of a task force on modernizing the Employment Equity Act (Department of Finance Canada, 2021[145]).
← 9. For instance, in 2018 one in four positions at the Indian Health Service facilities were vacant, one in three households on the Navajo reservation lacked running water, while American Indians, especially in rural areas, have higher risks of many chronic health conditions, including diabetes (three times higher than for white Americans in the United States) and obesity (50% higher).
← 10. As of 2016, Indigenous Australians represented around 3.3% of the Australian population (around 798 365, out of a total population of 24.1 million) (Australian Institute of Health and Welfare, 2019[143]) (ABS, 2016[144]); as of February 2021, they represent only 0.5% of total COVID-19 cases in Australia (Australian Government Department of Health, 2021[36]).
← 11. Since First Nations communities are not officially required to consistently report COVID-19 data, these only present cases of Indigenous peoples residing on reserves, and are likely to be even higher among Indigenous people living off-reserve.
← 12. The full Patient Health Questionnaire (PHQ) contains 59 questions, with modules focusing on mood, anxiety, alcohol, eating and somatoform disorders. The PHQ-4 screening tool is a short, four-question survey administered to respondents to gauge their mental condition, and to identify the presence and severity of depression and anxiety. PHQ-4 pulls two depression-related questions from the PHQ-9/8 (itself called the PHQ-2), and two anxiety-related questions from the Generalised Anxiety Disorder (GAD-7) questionnaire (itself called the GAD-2). Thus, the PHQ-4 is a combination of PHQ-2 and GAD-2. All question items are added together to provide a total score of mental distress: 0-2 normal, 3-5 moderate, 9-12 severe. A total score greater than or equal to 2 for the first two questions, pulled from the GAD-7, indicates that the respondent is at risk for anxiety. A total score greater than or equal to 2 for the final two questions, pulled from the PHQ-8, indicates that the respondent is at risk for depression (Kroenke et al., 2009[140]). The self-reported values from the PHQ surveys have been validated in separate studies comparing survey outcomes with actual diagnostic interviews with mental health professionals.
← 13. The source of the baseline data is different from the source of the pandemic-era data, therefore caution should be exercised in interpreting any individual country trajectory; however, both data sources use the same instrument (PHQ-2) to assess the risk of depression, therefore the overall trend of increasing gender gaps is likely to be true.
← 14. Pew Research Center conducted this study in the United States to understand people’s assessments of their personal financial situation during the current period of economic slowdown and high unemployment rates caused by the coronavirus outbreak. For this analysis, Pew surveyed 13 200 United States adults in August 2020. Everyone who took part was a member of Pew Research Center’s American Trends Panel (ATP), an online survey panel that is recruited through national, random sampling of residential addresses; this way nearly all United States adults have a chance of selection. The survey is weighted to be representative of the United States adult population by gender, race, ethnicity, partisan affiliation, education and other categories.
← 15. The PHQ-8 and PHQ-9 questionnaires are a common shortened version of the full PHQ survey (see endnote 4 above for more information). PHQ-9 is a nine-question survey designed to detect the presence and severity of depression disorders. The PHQ-8 questionnaire is the same but removes the final question regarding suicidal ideation.
← 16. The Generalised Anxiety Disorder Questionnaire (GAD) identifies the risk of anxiety. Similar to the PHQ, data are self-reported and validated against clinical diagnostic interviews (Spitzer et al., 2006[141]).
← 17. The Rapid Assessment of Pandemic Impact on Development Early Childhood Household Survey Project is a weekly survey of United States households with children aged five and under launched on 6 April 2020. Since then, the study has been gathering weekly data about child and adult emotional well-being, financial and work circumstances, availability of health care, and access to childcare/early childhood education. These analyses are based on responses collected from 4 586 caregivers between 6 April 2020 and 11 June 2020. These caregivers represent a range of voices: 12.6% are Black, 17.5% are Hispanic/Latino and 9.4% live at or below 1.5 times the federal poverty line. Proportions are calculated based on the item-level response rates, not out of the total sample size. The data for these analyses are not weighted.
← 18. Schernhammer and Colditz (2004[75]) conducted a meta-analysis of studies investigating physician suicide covering Australia, Denmark, Estonia, Finland, Germany, Great Britain, Iceland, South Africa (white population only), Sweden and the United States.
← 19. See endnote 7 (above). Outcomes for visible minorities are compared to those of the white, non-Indigenous, population.
← 20. For context, in the 2017 Canadian Aboriginal Peoples Survey, 16% of the Indigenous adult population (First Nations people living off reserve, Métis and Inuit) reported fair or poor mental health.
← 21. The twelve items of the General Health Questionnaire (GHQ-12) are added together to provide a total score from 0 to 36, where higher values indicate worse mental health (Goldberg and Williams, 1988[139]). The questionnaire contains four subscales, focussing on somatic symptoms, anxiety and insomnia, social dysfunction and severe depression. 6 of the questions are positively phrased, while 6 are negatively phrased.
← 22. These patterns seem to have been driven by increased or persistent loss of sleep over worry, which was the only question within the GHQ-12 that showed any significant variation across ethnic groups, after adjusting for age. Indeed, Indians reported greater difficulty with sleep over worry during this time (36% versus 23% for white British and 18% of Other white respondents). While 35% of those from the Black, African, Caribbean or Black British ethnic group also said they lost sleep, the change in mental health for these groups were not as marked, though definite statements are difficult to make due to large confidence intervals.
← 23. The study by Graham et al. (2020[30]) compares outcomes for low-income and high-income groups by ethnicity but does not include other socio-economic controls.
← 24. A nationally representative survey fielded by the Social Policy Institute at Washington University in St. Louis from 27 April to 12 May found that, after controlling for socio-economic and demographic variables such as age, gender, income, education and place of residence, Black and Hispanic/Latino respondents scored higher on life satisfaction, optimism for the future and a self-reported mental health question compared to whites, with the largest racial differences between those of low income.
← 25. Negative affect balance is measured as the share of the population reporting more negative feelings (anger, sadness, worry) than positive feelings (enjoyment, laughing or smiling a lot, feeling well-rested) the day prior.
← 26. While the composition of all the different labour market categories changed markedly in 2020, it is only unemployment that shows such large counterintuitive movements in negative affect balance from 2019 to 2020. This may also reflect the small sample size of the unemployed, compared to other labour market groups. According to the Gallup World Poll data, 5.8% of respondents in 33 OECD countries were unemployed in 2020, compared to 13.1% who were working part-time, 35.5% who were out of work and 45.7% who were employed full-time. The smaller sample size my lead to more noise in the data, meaning that though there appears to be more movement the changes are insignificant.
← 27. This study analyses public opinion in the United States and three European countries: France, Germany and the United Kingdom. Data are from nationally representative telephone surveys of 4 069 adults from 10 November to 23 December 2020 in the three countries.
← 28. Analysis of United Kingdom data has shown the importance of whether part-time work is voluntary (i.e. individuals who work part-time out of choice) or involuntary (i.e. individuals who want to work more hours, but were unable to find a full-time job). Specifically, those working part-time voluntarily have higher subjective well-being than full-time workers, while those working part-time involuntarily experience lower levels of subjective well-being than full-time workers (Abdallah and Shah, 2012[142]).
← 29. The Tulsa School Experiences and Early Development (SEED) Study, initiated in 2016, is following a diverse sample of children from low-income families from age 3 through 4th grade to understand the effects of attending pre-K programmes on children’s learning and development. The Tulsa SEED Study surveyed both parents (N=586) and teachers (N=118) in a 6-week period between May and July 2020. Participants in this pair of COVID-19 surveys were the parents (90% mothers) and the first-grade teachers of the SEED study children. These children have been followed since ages 3–4, when they experienced a range of public preschool arrangements in the Tulsa Public School (TPS) district. Of the families still enrolled in the study by 1st grade, 43% responded to this special COVID-19 survey (85% of whom are still enrolled in the TPS district). COVID-19 survey respondents resembled the TPS population with respect to family income, child race/ethnicity and child special needs status, but were slightly more likely to be dual language learners.
← 30. Poor mental health is measured via a “psychopathology factor”, a composite measure that synthesises symptoms associated with ten psychiatric disorders, including alcohol dependence, ADHD and generalised anxiety disorder.