Chapter 9. Innovation in assessment practices
This chapter presents the change in assessment practices in teaching and learning practices in reading, maths and science, including the emphasis given to different types of assessments (classroom, regional or national assessments). The change within countries is presented as an increase or decrease in the share of students exposed to the practice. The percentage point change is also expressed as a standardised effect size in the final table.
The statistical data for Israel are supplied by and under the responsibility of the relevant Israeli authorities. The use of such data by the OECD is without prejudice to the status of the Golan Heights, East Jerusalem and Israeli settlements in the West Bank under the terms of international law.
51. Frequency of correction of assignment and feedback
Why it matters
Formative assessment is a key pedagogical practice, structured around feedback, continuous monitoring of students’ work, and appropriate new assignments to make them overcome their difficulties or move to the next level. Always correcting assignments and giving feedback to students is a professional and moral imperative for teachers, and one would expect the practice to be close to universal within all systems.
Mathematics
Change at the OECD level: moderate
OECD countries experienced changes in both directions, although the average net change was slightly positive (2 percentage points). The overall absolute change, counting both positives and negatives variations, was 15 percentage points on average, corresponding to a moderate effect size of 0.33. Surprisingly, this practice varies a lot within OECD countries. In 2015, 79 % of 8th grade students had their assignments systematically corrected in Chile, compared to only 2% in Slovenia – the OECD average being 44%.
Countries where there has been the most change
Innovation took the form of both increases and reductions in this good practice. Large increases in the share of secondary students concerned were recorded in Korea (40 percentage points), Italy (21 percentage points) and Turkey (19 percentage points) whereas the practice lost considerable ground in Sweden and Australia (22 percentage point reduction in each case).
Science
Change at the OECD level: moderate-low
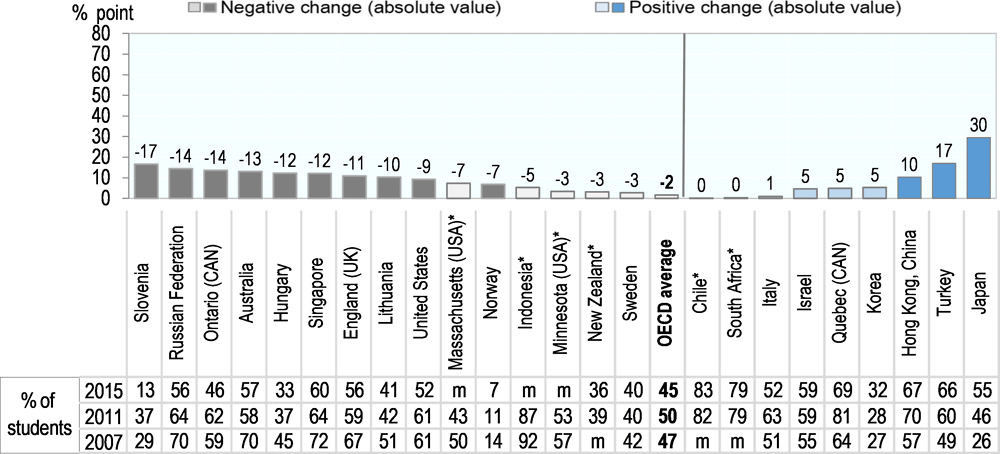
In science, the share of 8th grade students receiving a systematic correction of assignments decreased by 2 percentage points on average. Combining variations in both directions, the absolute change reached 11 percentage points, corresponding to a modest effect size of 0.23. Systematic correction and feedback is as common in science as in maths and concerns 45% of secondary students on average in OECD countries, with a span ranging from 83% in Chile to roughly 7% in Norway in 2015.
Countries where there has been the most change
The spread of this practice was a significant innovation in Japan, where the share of students concerned has expanded by 30 percentage points, but also in Turkey (17 percentage points). Innovation has taken the form of a reduction of the practice in a few countries: it has decreased by 17 percentage points in Slovenia, and around 13 percentage points in the Russian Federation, Ontario (Canada), Australia, Hungary and Singapore.

Note: Darker tones correspond to statistically significant values.
* refers to calculations based on other years, based on data availability.
The OECD average is based on OECD countries with available data in 2007, 2011 and 2015.
Source: Authors' calculations based on TIMSS Databases.
Note: Darker tones correspond to statistically significant values.
* refers to calculations based on other years, based on data availability.
The OECD average is based on OECD countries with available data in 2007, 2011 and 2015.
Source: Authors' calculations based on TIMSS Databases.
52. Emphasis on classroom tests
Why it matters
Classroom tests are a widespread practice to assess how students are doing, whether they have understood the content and procedural knowledge that they were supposed to acquire. They are most useful when used formatively to monitor students’ progress, and help them acquire the knowledge they have missed. They can be counterproductive when used for mere summative and selective purposes to put students in different study tracks rather than support them. This is thus an ambivalent pedagogical practice.
Mathematics
Change at the OECD level: moderate
In 8th grade mathematics lessons, the use of classroom tests has increased in most countries. In OECD countries, the share of students widely subjected to classroom tests has registered an average net increase of 7 percentage points. The absolute change, combining positives and negatives, was 12 percentage points, corresponding to a moderate effect size of 0.29. In 2015, maths teachers putting an emphasis on classroom tests taught 77% of 8th grade students in the OECD area.
Countries where there has been the most change
Between 2007 and 2015, England registered a noticeable expansion by 28 percentage points of the share of 8th grade students extensively assessed through classroom tests, followed closely by Japan (27 percentage points). Very few countries recorded contractions in this practice. The practice decreased by 18 and 10 percentage points in Hungary and Italy, but to remain at high levels of use.
Science
Change at the OECD level: moderate-high
A large majority of countries saw the use of classroom tests in 8th grade science gain ground. At the OECD level, on average 72% of 8th grade students were extensively assessed through classroom tests in science lessons in 2015, compared to 60% in 2007. The absolute change in this practice was 16 percentage points on average, corresponding to a moderate-high effect size of 0.36. This practice is common in most OECD systems, touching three in four students on average (73%), with a span ranging from 94% in Japan to 57% in Ontario (Canada).
Countries where there has been the most change
Innovation took the form of a significant diffusion of this practice. Japan is by far the country which experienced the most innovation in this area, with an expansion by 44 percentage points between 2007 and 2015, followed by Quebec (Canada) (28 percentage points). Indonesia and Minnesota (United States) saw also the practice gain significant ground between 2007 and 2011. On the other hand, Hungary experienced a significant contraction, with a decrease by 16 percentage points in the share of students concerned.

Note: Darker tones correspond to statistically significant values.
* refers to calculations based on other years, based on data availability.
The OECD average is based on OECD countries with available data in 2007, 2011 and 2015.
Source: Authors' calculations based on TIMSS Databases.

Note: Darker tones correspond to statistically significant values.
* refers to calculations based on other years, based on data availability.
The OECD average is based on OECD countries with available data in 2007, 2011 and 2015.
Source: Authors' calculations based on TIMSS Databases.
53. Emphasis on national or regional achievement tests
Why it matters
National or regional achievement tests give teachers and schools a benchmark on how their students are doing compared to their peers, help policy makers, administrators, but also potentially school principals and teachers to make better informed decisions. Too much emphasis on those tests in the classroom may have counterproductive effects if they become so important that teachers “teach to the test”. By their very nature, from an educational standpoint no test can be worth teaching to. Putting an emphasis on preparing for testing may have good or bad effects, depending on how it is done.
Mathematics
Change at the OECD level: moderate
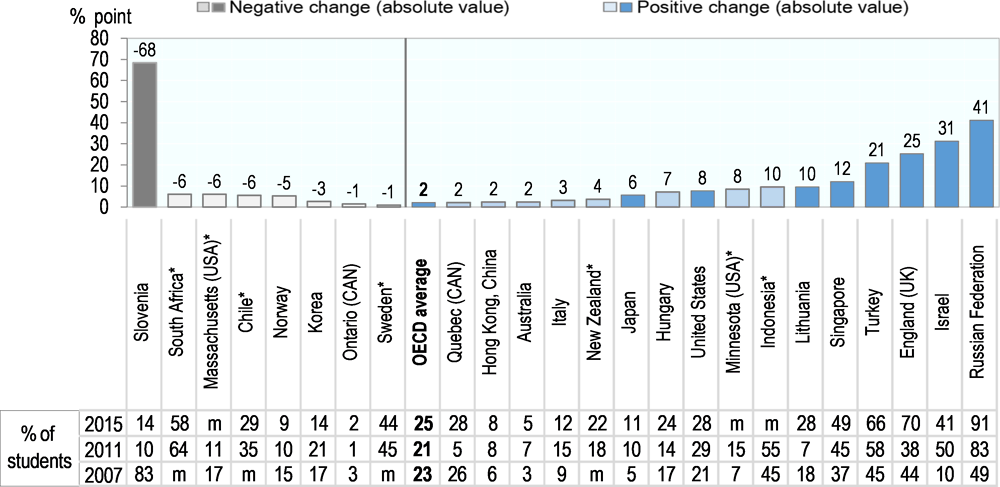
The average net change in this domain was a slight expansion of the practice by 2 percentage points between 2007 and 2015 in OECD systems. Combining positive and negative changes, the absolute change in the use of this practice was 15 percentage points on average, corresponding to a moderate effect size of 0.34. While the importance of regional or national tests was relatively low across OECD education systems, with an average of 25% students concerned in 2015, there was a big variation going from only 2% of students experiencing an emphasis on national or regional tests in Ontario (Canada) compared to 70% in England.
Countries where there has been the most change
In the Russian Federation, the share of 8th grade students widely exposed to this form of assessment increased by 41 percentage points between 2007 and 2015. Similarly, Israel and England (U.K.) recorded increases of 31 and 25 percentage points respectively. Decreases in this practice were quite insignificant, with the stark exception of Slovenia where the share of students exposed to this practice fell very significantly, by 68 percentage points.
Science
Change at the OECD level: moderate
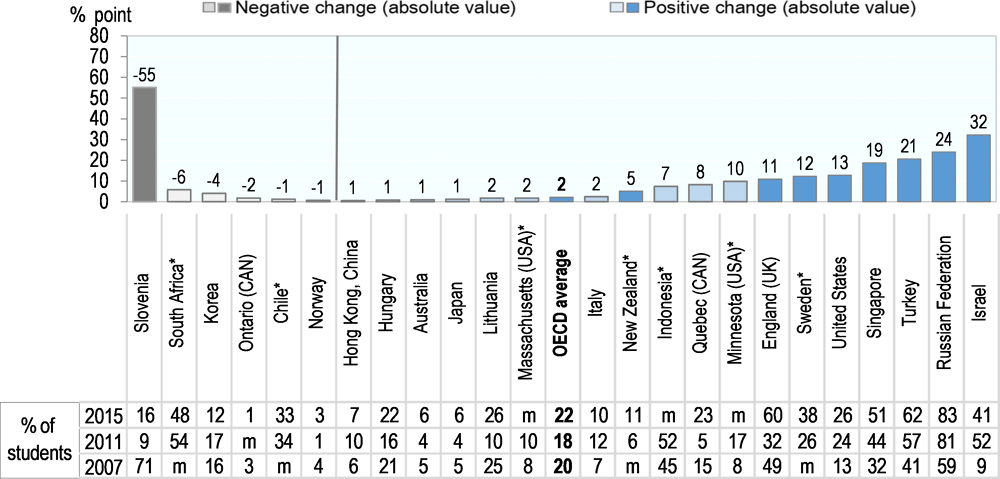
In OECD systems, the practice diffused slightly more than it receded, resulting in an average net increase of 2 percentage points. The average absolute change amounted to 12 percentage points, corresponding to modest effect size of 0.28. The use of this assessment method remains low on average (22% of students concerned) but differs quite a lot among OECD systems, with 8th grade science teachers in Turkey strongly relying on national or regional tests to assess students’ progress while teachers in Ontario (Canada) barely doing so.
Countries where there has been the most change
Innovation mainly took the shape of increases in the use of this practice. Between 2007 and 2015, Israel (32 parentage points), the Russian Federation (24 percentage points) and Turkey (21 percentage points) recorded substantial increases in the share of 8th grade students with a teacher emphasising national or regional achievement tests. During the same time period, the only substantial contraction of this practice was seen in Slovenia where the share of touched students decreased by 55 percentage points.
Note: Darker tones correspond to statistically significant values.
* refers to calculations based on other years, based on data availability.
The OECD average is based on OECD countries with available data in 2007, 2011 and 2015.
Source: Authors' calculations based on TIMSS Databases.
Note: Darker tones correspond to statistically significant values.
* refers to calculations based on other years, based on data availability.
The OECD average is based on OECD countries with available data in 2007, 2011 and 2015.
Source: Authors' calculations based on TIMSS Databases.
54. Written test in reading
Why it matters
Frequent written tests in reading allow teachers to assess how their students are doing, whether they are acquiring the expected reading, writing and understanding skills. Tests are most useful when used formatively to monitor students’ progress and help teachers provide the support to their students to make progress. Frequent testing can be counterproductive when used for mere summative or selective purposes.
Change at the OECD level: large
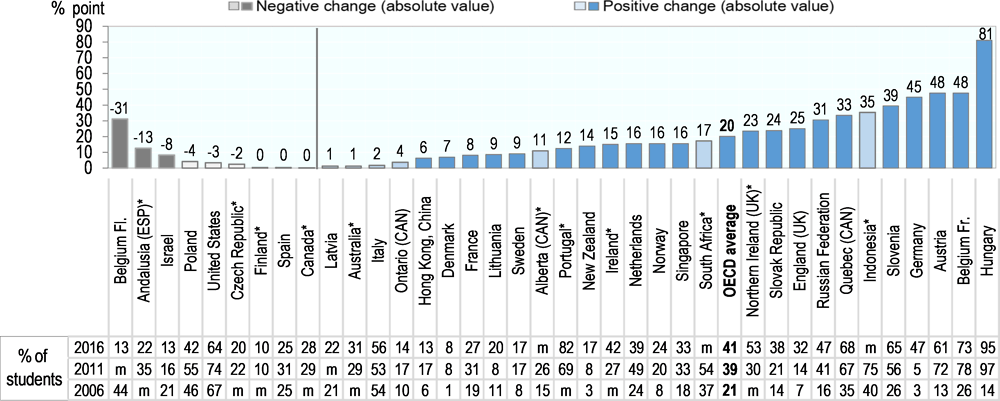
At the OECD level, the share of 4th grade students who were given a written test in reading at least once a week went from an average of 21% in 2006 to 41% in 2016. The average absolute change, reflecting the positive and negative variation, amounted to 21 percentage points, corresponding to a large effect size of 0.53. While this practice affects on average less than half of primary students in OECD countries, its prevalence varies strongly across OECD systems, with 95% of students touched in Hungary as opposed to only 8% in Denmark in 2016.
Countries where there has been the most change
Hungary registered an outstanding increase in the share of 4th grade students regularly exposed to written tests in reading (81 percentage points). Increases above 40 percentage points occurred in Belgium (Fr.), Austria and Germany. Among the few systems experiencing a contraction of the practice, Belgium (Fl.) stood out with a 31-percentage points decrease of students given regular written tests.
Note: Darker tones correspond to statistically significant values.
* refers to calculations based on other years, based on data availability.
The OECD average is based on OECD countries with available data in 2006, 2011 and 2016.
Source: Authors' calculations based on PIRLS Databases.
55. Emphasis on classroom tests in reading
Why it matters
Classroom tests are a widespread practice to assess how students are doing, whether they are gaining the vocabulary, phonological awareness and text comprehension expected from them. Tests are most useful when used formatively to monitor students’ progress, to help identify and remedy their knowledge gaps. They can be counterproductive when used for mere summative and selective purposes to put students in tracks or ability groups rather than support them. This is thus an ambivalent pedagogical practice.
Change at the OECD level: moderate
While expansions and contractions have cancelled each other across OECD countries, the overall absolute change in the share of 4th grade students significantly assessed through classroom tests in reading amounted to 13 percentage points on average. This corresponds to a moderate absolute effect size of 0.28. In 2016, the use of this practice concerned about one student in two in the OECD systems covered, with a span ranging from 89% of in Portugal to 12% in New Zealand.
Countries where there has been the most change
Innovation took the form of both increases and reductions in the use of classroom tests. Quebec (Canada) recorded a substantial increase of 31 percentage points in the share of students using classroom tests in reading, whereas Spain experienced a decrease of 35 percentage points.

Note: Darker tones correspond to statistically significant values.
* refers to calculations based on other years, based on data availability.
The OECD average is based on OECD countries with available data in 2006, 2011 and 2016.
Source: Authors' calculations based on PIRLS Databases.
56. Emphasis on national or regional tests in reading
Why it matters
National or regional achievement tests give teachers and schools a benchmark on how their students are doing compared to their peers, help policy makers, administrators, but also potentially school principals and teachers to make informed decisions. Too much emphasis on national or regional tests in the classroom may have counterproductive effects if they become so important that teachers “teach to the test”. By their very nature, from an educational standpoint no test can be worth teaching to. Putting an emphasis on preparing testing may thus have good or bad effects, depending on how it is done.
Change at the OECD level: small
Between 2006 and 2016, OECD systems presented both positive and negative changes in the use of this practice, leading to a slightly negative average net change (-2 percentage points). The mean absolute change, accounting for changes in both directions, was 9 percentage points, corresponding to a modest effect size of 0.22. Across OECD countries, on average 23% of the 4th grade students had teachers emphasising regional or national tests in reading in 2016, with a span ranging from 62% in Israel to 4% in Germany.
Countries where there has been the most change
Indonesia stood out with a spread of this practice by 45 percentage points between 2006 and 2011. Between 2006 and 2016, Israel, the Russian Federation and Portugal experienced substantial increases above 20 percentage points. Conversely, this practice receded in Belgium (Fl.) and France (21 and 19 percentage points respectively). In all these countries this has been a domain of significant innovation.

Note: Darker tones correspond to statistically significant values.
* refers to calculations based on other years, based on data availability.
The OECD average is based on OECD countries with available data in 2006, 2011 and 2016.
Source: Authors' calculations based on PIRLS Databases.
|
Table 9.1. Effect sizes for changes in assessment practices
|
|||||||||
|---|---|---|---|---|---|---|---|---|---|
|
|
Frequency of correction of assignment and feedback |
Emphasis on classroom tests |
Emphasis on national or regional achievement tests |
Written tests on reading |
Emphasis on classroom test in reading |
Emphasis on national or regional tests in reading |
|||
|
|
8th grade Maths |
8th grade Science |
8th grade Maths |
8th grade Science |
8th grade Maths |
8th grade Science |
4th grade |
4th grade |
4th grade |
|
Australia |
-0.43 |
-0.27 |
-0.11 |
-0.02 |
0.12 |
0.04 |
0.03 |
0.05 |
0.09 |
|
Austria |
m |
m |
m |
m |
m |
m |
1.04 |
0.08 |
0.06 |
|
Belgium (Fl.) |
m |
m |
m |
m |
m |
m |
-0.72 |
0.18 |
-0.45 |
|
Belgium (Fr.) |
m |
m |
m |
m |
m |
m |
0.99 |
0.28 |
0.08 |
|
Canada |
m |
m |
m |
m |
m |
m |
0.00 |
-0.05 |
0.06 |
|
Canada (Alberta) |
m |
m |
m |
m |
m |
m |
0.27 |
-0.05 |
-0.22 |
|
Canada (Ontario) |
-0.04 |
-0.27 |
0.07 |
0.08 |
-0.09 |
-0.14 |
0.12 |
-0.11 |
0.07 |
|
Canada (Quebec) |
0.18 |
0.10 |
0.32 |
0.62 |
0.05 |
0.21 |
0.68 |
0.65 |
0.21 |
|
Chile |
-0.16 |
0.00 |
-0.10 |
0.03 |
-0.12 |
-0.03 |
m |
m |
m |
|
Czech Republic |
m |
m |
m |
m |
m |
m |
-0.06 |
0.03 |
0.02 |
|
Denmark |
m |
m |
m |
m |
m |
m |
0.37 |
0.11 |
0.01 |
|
Finland |
m |
m |
m |
m |
m |
m |
-0.01 |
-0.05 |
-0.09 |
|
France |
m |
m |
m |
m |
m |
m |
0.19 |
-0.39 |
-0.43 |
|
Germany |
m |
m |
m |
m |
m |
m |
1.20 |
0.08 |
-0.28 |
|
Hungary |
-0.31 |
-0.25 |
-0.46 |
-0.38 |
0.18 |
0.02 |
1.93 |
-0.24 |
-0.31 |
|
Ireland |
m |
m |
m |
m |
m |
m |
0.32 |
0.05 |
0.04 |
|
Israel |
0.23 |
0.09 |
0.28 |
0.33 |
0.75 |
0.79 |
-0.22 |
0.26 |
0.72 |
|
Italy |
0.44 |
0.02 |
-0.23 |
-0.14 |
0.11 |
0.09 |
0.03 |
-0.44 |
-0.09 |
|
Japan |
0.31 |
0.61 |
0.92 |
1.08 |
0.21 |
0.06 |
m |
m |
m |
|
Korea |
0.90 |
0.12 |
0.15 |
0.19 |
-0.07 |
-0.12 |
m |
m |
m |
|
Latvia |
m |
m |
m |
m |
m |
m |
0.03 |
0.16 |
0.12 |
|
Lithuania |
-0.22 |
-0.21 |
0.14 |
0.39 |
0.23 |
0.04 |
0.24 |
0.14 |
0.29 |
|
Netherlands |
m |
m |
m |
m |
m |
m |
0.34 |
-0.29 |
-0.33 |
|
New Zealand |
0.00 |
-0.07 |
0.02 |
0.10 |
0.10 |
0.18 |
0.52 |
-0.57 |
m |
|
Norway |
0.17 |
-0.23 |
0.01 |
0.32 |
-0.16 |
-0.04 |
0.44 |
0.11 |
-0.12 |
|
Poland |
m |
m |
m |
m |
m |
m |
-0.09 |
0.18 |
-0.31 |
|
Portugal |
m |
m |
m |
m |
m |
m |
0.29 |
0.45 |
0.48 |
|
Slovak Republic |
m |
m |
m |
m |
m |
m |
0.56 |
0.21 |
-0.03 |
|
Slovenia |
-0.45 |
-0.42 |
0.45 |
0.42 |
-1.51 |
-1.19 |
0.81 |
0.22 |
0.00 |
|
Spain |
m |
m |
m |
m |
m |
m |
-0.01 |
-0.79 |
-0.40 |
|
Spain (Andalusia) |
m |
m |
m |
m |
m |
m |
-0.28 |
-0.28 |
0.17 |
|
Sweden |
-0.45 |
-0.05 |
0.14 |
0.28 |
-0.02 |
0.27 |
0.28 |
0.16 |
-0.21 |
|
Switzerland |
m |
m |
m |
m |
m |
m |
m |
m |
m |
|
Turkey |
0.37 |
0.35 |
0.27 |
0.44 |
0.43 |
0.42 |
m |
m |
m |
|
UK (England) |
-0.32 |
-0.23 |
0.56 |
0.36 |
0.52 |
0.22 |
0.67 |
0.28 |
-0.22 |
|
UK (Northern Ireland) |
m |
m |
m |
m |
m |
m |
0.48 |
0.04 |
0.16 |
|
United States |
0.00 |
-0.19 |
0.16 |
0.30 |
0.18 |
0.33 |
-0.07 |
0.19 |
0.36 |
|
US (Massachusetts) |
0.23 |
-0.15 |
0.26 |
0.31 |
-0.17 |
0.06 |
m |
m |
m |
|
US.(Minnesota) |
0.13 |
-0.07 |
0.49 |
0.52 |
0.27 |
0.30 |
m |
m |
m |
|
OECD (average) |
0.05 |
-0.03 |
0.16 |
0.26 |
0.05 |
0.05 |
0.44 |
0.00 |
-0.06 |
|
OECD (av. absolute) |
0.33 |
0.23 |
0.29 |
0.36 |
0.34 |
0.28 |
0.53 |
0.28 |
0.22 |
|
Hong Kong, China |
-0.29 |
0.21 |
0.03 |
0.33 |
0.09 |
0.02 |
0.22 |
0.02 |
-0.03 |
|
Indonesia |
-0.09 |
-0.17 |
0.36 |
0.55 |
0.19 |
0.15 |
0.73 |
0.65 |
0.93 |
|
Russian Federation |
-0.05 |
-0.30 |
0.10 |
0.06 |
0.96 |
0.54 |
0.68 |
0.23 |
0.59 |
|
Singapore |
-0.05 |
-0.26 |
0.28 |
0.18 |
0.25 |
0.38 |
0.36 |
0.35 |
-0.08 |
|
South Africa |
-0.05 |
0.01 |
-0.04 |
-0.20 |
-0.13 |
-0.12 |
0.35 |
0.35 |
0.47 |
|
|
|||||||||
|
|
|||||||||
|
|
|||||||||
|
Source: Authors' calculations based on TIMSS (2007, 2011 and 2015) and PIRLS (2006, 2011 and 2016). |
|||||||||
 Effect size from -0.5 to -0.2 and from 0.2 and 0.5
 Effect size from -0.8 to -0.5 and from 0.5 and 0.8
 Effect size equals or less than -0.8 and equals or greater than 0.8