copy the linklink copied!Pharmacists and pharmacies
Pharmacists are trained health care professionals who manage the distribution of medicines to consumers/patients and help ensure their safe and efficacious use. Between 2000 and 2017, the density of practising pharmacists increased by 33% on average in OECD countries, to 83 pharmacists per 100 000 inhabitants (Figure 10.4). The number of pharmacists per capita is highest in Japan (181 pharmacists per 100 000 people), and lowest in the Netherlands (21 pharmacists).
The number of pharmacists per capita increased in all OECD countries for which time series are available. Pharmacist density increased most rapidly in Japan, Portugal and Slovenia. In Japan, increased numbers of pharmacists are largely attributable to the government’s efforts to more clearly separate drug prescribing by doctors from drug dispensing by pharmacists (the Bungyo system).
Across the OECD, most pharmacists work in community retail pharmacies, but some also work in hospital, industry, research and academic settings. In Canada, for example, in 2016 more than three-quarters of practising pharmacists worked in community pharmacies, while about 20% worked in hospitals and other health care facilities (CIHI, 2017[1]). In Japan, around 57% of pharmacists worked in community pharmacies in 2016, while around 19% worked in hospitals or clinics and the remaining 24% in other settings (Ministry of Health, Labour and Welfare, 2017[2]).
The number of community pharmacies per 100 000 people ranges from 7 in Denmark to 88 in Greece; with an average of 29 across OECD countries (Figure 10.5). This variation can be explained in part by differences in common distribution channels. Some countries rely more on hospital pharmacies to dispense medicines to outpatients; others still have doctors dispensing medicines to their patients (e.g. in the Netherlands). Denmark has fewer community pharmacies, but these are often large, and include branch pharmacies and subsidiary pharmacy units attached to the main pharmacy. The range of products and services provided by pharmacies also varies between countries. In most European countries, for example, pharmacies also sell cosmetics, food supplements, medical devices and homeopathic products.
The role of the community pharmacist has changed over recent years. Although their main role is to dispense medications, pharmacists are increasingly providing direct care to patients (e.g. flu vaccinations in Australia, Ireland and New Zealand; medicine adherence support in Australia, Japan, New Zealand and the United Kingdom), both in community pharmacies and as part of integrated health care provider teams.
Practising pharmacists are defined as the number of pharmacists who are licensed to practice and provide direct services to clients/patients. They can be either salaried or self-employed, and work in community pharmacies, hospitals and other settings. Assistant pharmacists and other employees of pharmacies are normally excluded.
In Ireland, the figures include all pharmacists registered with the Pharmaceutical Society of Ireland, possibly including some pharmacists who are not actively working. Assistant pharmacists are included in Iceland.
Community pharmacies are premises which, in accordance with the local legal provisions and definitions, may operate as a facility for the provision of pharmacy services in community settings. The number of community pharmacies reported are the number of premises where medicines are dispensed under the supervision of a pharmacist.
References
[1] CIHI (2017), Pharmacists in 2016, Health Workforce, https://www.cihi.ca/en/pharmacists (accessed on 19 July 2019).
[2] Ministry of Health, Labour and Welfare (2017), Summary of Survey of Physicians, Dentists and Pharmacists, Health Statistics Office, Director-General for Statistics and Information Policy, Ministry of Health, Labour and Welfare, Tokyo.
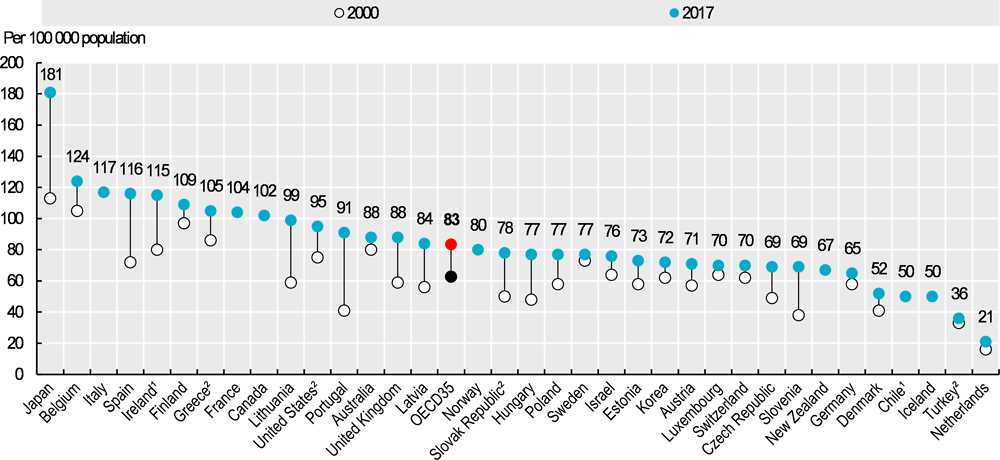
1. Data refer to all pharmacists licensed to practice. 2. Data include not only pharmacists providing direct services to patients, but also those working in the health sector as researchers, for pharmaceutical companies, etc.
Source: OECD Health Statistics 2019.
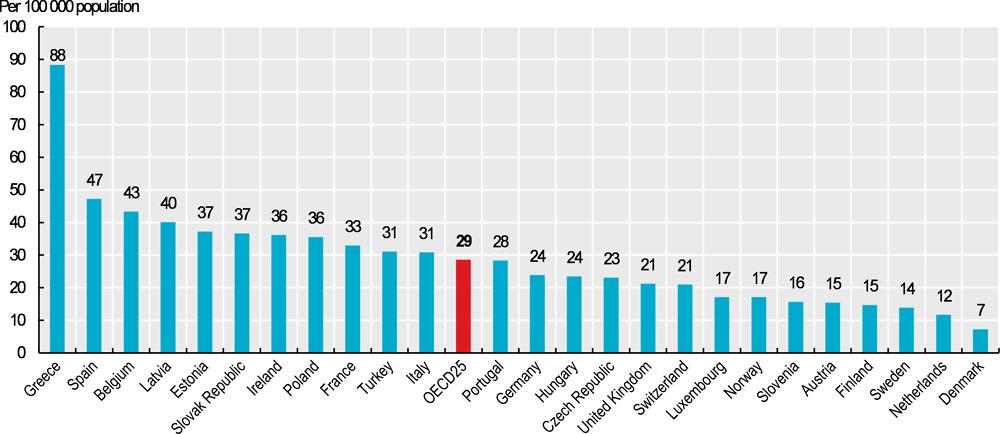
Source: Pharmaceutical Group of the European Union database 2017 or national sources.
Metadata, Legal and Rights
https://doi.org/10.1787/4dd50c09-en
© OECD 2019
The use of this work, whether digital or print, is governed by the Terms and Conditions to be found at http://www.oecd.org/termsandconditions.