Chapter 3. Pension costs in the accumulation phase: Policy options to improve outcomes in funded private pensions
This chapter examines policy measures implemented in different jurisdictions to help align the charges levied by pension providers on scheme members, sponsors and employers with the cost of the services provided, as well as ways to improve outcomes for members and sponsors. These policy measures have been introduced because market mechanisms alone have often been insufficient to achieve this goal. Aligning charges and costs is important as both visible charges – the fees paid to providers by different parties – and unreported charges – deductions from pension portfolios to pay suppliers such as asset managers – reduce the overall value of the pension pot. The most common policy response, improving transparency of charges and costs, works best when accompanied by additional measures such as pricing regulation or structural solutions. The chapter also considers how disclosure initiatives and pricing regulation can include benchmarking and performance-related fee structures to improve outcomes for members and sponsors.
Funded pensions pay members’ benefits out of assets generated during the accumulation phase. The higher the value of those assets, the more secure the benefit stream of a defined benefit (DB) pension and the higher the potential pay-out from a defined contribution (DC) pension.
The asset pool is made up of contributions from members, employers and sponsors, and the returns earned through investing those contributions. Pension providers carry out administration and investment activities in order to collect and grow pension assets. These activities are paid for out of contributions and investment gains. Therefore, all other things being equal, the higher the cost of providing the pension, the lower the amount of assets available to pay benefits and the worse the outcome for members and sponsors.
The cost of funded private pensions has come under increasing scrutiny with the growth in DC arrangements. In DB arrangements, the scheme sponsor is responsible for making up any shortfall in assets, so members do not directly bear the consequences of excessive costs. In DC funds, any fees that are levied on contributions to pay for administration services and any charges that are deducted from investment portfolios to cover investment expenses ultimately come out of members’ retirement pots. Therefore, excessive fees and charges have a direct impact on individuals’ future benefits. The impact on smaller pots – such as those of lower-income workers brought into the pension system through automatic enrolment – can be particularly high.
To maximise outcomes for members of DC schemes and to limit calls for extra funding on sponsors of DB schemes, it is therefore important that the administration and investment costs incurred by pension providers are as low as possible for a given level of service provided. In addition, providers should pass these costs on to members, employers and sponsors through appropriate charging structures.
In an efficient market, both the costs incurred by providers and the charges they apply to members, employers and sponsors, should be contained by competitive pressures. Pension providers would monitor and control their payments to external investment managers and other suppliers. Employers and employees would reward providers for keeping costs and charges low.
However, at times there appears to be a lack of such competitive pressures in both mature and more recently established pension markets across OECD and IOPS member jurisdictions (FCA, 2016[1]; Grattan Institute, 2014[2]; Ayres and Curtis, 2015[3]). The primary policy response has been to bolster market forces by creating greater transparency around costs and charges, but this has not been sufficient by itself to improve outcomes. Policy makers have therefore introduced additional measures to control costs and charges, including pricing regulation (e.g. charge caps in Costa Rica, Turkey and the United Kingdom) and structural solutions (e.g. auction mechanisms in Chile, India and New Zealand).
It is important that such measures do not encourage a “race to the bottom” among pension providers. Higher-cost services can represent good value for money: communication campaigns that encourage members of DC schemes to save more into their pension scheme will increase administration costs but can result in bigger individual pension pots; diversifying the investment strategy of DB schemes to include more expensive asset classes such as infrastructure can lead to better risk-adjusted returns.
Policy should therefore consider outcomes as well as costs and charges. Costs and charges are an important driver of outcomes, but administrative efficiency, and investment strategy and implementation, also influence how much both DB and DC pension portfolios grow. Administration cost and service levels, and investment cost and performance, can each be monitored against a relevant reference point, such as the pension provider’s own policy statements, peer groups or a default fund. Such benchmarking exercises can highlight where there is scope for providers to improve outcomes, either by cutting costs or by modifying their administration or investment activities.
This chapter first provides an overview of costs and charges. It then analyses the reasons why market mechanisms have often been insufficient to align costs and charges in funded private pensions and analyses the effectiveness of different policies to strengthen or supplement market forces.1 It finds that measures to improve transparency are essential but are not enough by themselves to align costs and charges. Rather, other solutions such as benchmarking, pricing initiatives, and structural solutions are also warranted. These policy options offer ways to better align costs and charges as well as ways to improve overall outcomes in DB and DC pensions.
3.1. Overview of costs and charges
Types of costs and charges
Pension providers carry out administration and investment activities in order to collect and invest contributions and provide other services (such as valuations and account statements) to members, employers and sponsors during the accumulation phase. Members and employers pay for the costs of these activities through visible charges – the fees levied by the provider – and unreported or not explicit charges – deductions from contributions or from the investment portfolio.
The potential impact of costs and charges on the value of retirement savings can be large. Table 3.1 shows the impact of total charges on the pension pot accumulated in a theoretical DC account under certain assumptions. Charges of 1.5% of assets would lead to a reduction of nearly 30% of the final pot at retirement, relative to a situation of no charges; halving charges to 0.75% of assets brings the reduction of the pot to less than 17%. The effect of compounding is likely to be significant in an asset-based charging structure: if an individual joins a DC scheme at age 25 and withdraws his entire pension pot at the age of 65, charges will be paid on the first contribution 40 times. Charges will also be paid each year on the prior years’ investment returns.
To understand the total charges paid by members and sponsors, three pieces of information are needed: what are the total costs incurred by the pension provider; which of these costs are included in the fees; and which result in additional deductions.2 However, costs may be difficult to observe and measure and fee structures differ across jurisdictions.
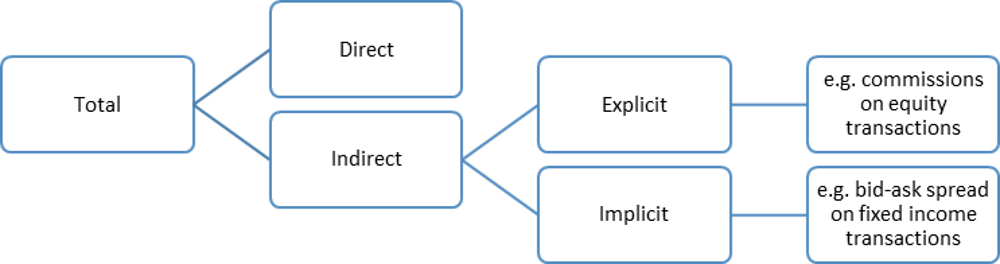
The costs incurred by pension providers can be direct or indirect. Most administration costs are direct – the provider will either incur operating expenses itself or receive an invoice from an external service provider. Some investment costs are direct, for example, compliance and regulatory costs, which are levied at the level of the pension fund. However, a number of the costs within the pension plan, especially investment costs, are typically indirect. An example of indirect costs is transaction costs, i.e. the costs of trading underlying securities in an investment portfolio such as commissions to brokers, clearing and settlement fees to custodians, and applicable taxes. These different costs are usually covered through a reduction in the returns to the portfolio as the transaction takes place, rather than through a separate billing procedure.
Getting a full picture of investment costs is further complicated by the fact that some indirect costs are "implicit", as illustrated in Figure 3.1. Transaction costs for equities are "explicit": brokers' commissions are contractually agreed, stamp duty rates are known and so on. Transaction costs for fixed income are "implicit": commissions and other costs are embedded in the bid-ask spread.
Different institutional arrangements will incur different types and levels of costs, depending on factors such as the number of intermediaries, the services offered and the investment strategy, so not all cost items are applicable or material to all providers. Table 3.2 gives an overview of the various different costs that private pension providers could incur. Whether these costs are recouped through fees or through unreported or not explicit charges, they constitute a reduction in the assets in the portfolio. Table 3.2 also illustrates how a focus on fees alone may obscure the full extent of fund charges.
There is a wide range of estimates of the magnitude of indirect costs, but evidence suggests that they can be substantial. Blake (2014[5]) finds that estimates of the implicit costs of investment funds range from 51% to 82% of explicit costs. Transaction costs and look-through costs are estimated to add 19 basis points (bp) to the investment costs of Australian Superannuation funds.3 According to the Superintendence of Pensions, in the Chilean mandatory occupational DC system, estimated explicit indirect costs are 40% on top of direct costs, although this figure may not include all implicit costs.
The extent to which direct and indirect costs are included in fees varies by country. For example, in Ireland, voluntary occupational DC plans are required to include only administration costs and the costs of investing in primary funds in the fees levied on members. Portugal, by contrast, stipulates that fees cover more categories of direct cost and some indirect costs: administration costs, investment in primary funds, custodian fees and investment transaction costs (Han and Stanko, 2018[6]).
In assessing costs and charges, it is important to acknowledge that high costs are not necessarily bad and can offer good value for money. There is an argument that to be fully effective in improving outcomes, policy should not look at pension fund costs and fees in isolation but should consider the “value for money” offered by the pension provider. The logic is that pension providers that offer good value for money will grow assets through high quality administration and investment services at a competitive cost to members and sponsors. In these cases, higher costs may result in better outcomes for individuals through more sustained growth in pension assets. APRA (2016[7]) stated that “for any given pattern of contributions, members’ retirement outcomes are primarily driven by investment performance”. Higher costs could therefore result in more engaging communications with members or superior investment performance. Some jurisdictions specifically account for value - regulators in Australia and the United Kingdom require pension fund trustees to deliver good value for money, rather than low costs.
It is also important to balance any policy responses to high costs/charges against the risk that policy intervention may lead to higher regulatory costs. Rice Warner (2014[8]) found that the introduction of MySuper products in Australia led to additional compliance, product design and systems costs that were passed on through higher monthly fees; these partly offset the reduction in asset-based fees that resulted from their simpler investment design. Australia is re-evaluating RG97, which has proven burdensome for providers, and MiFIID 2 is also under scrutiny. Some commentators have raised concerns that retail savers will view new information on costs as amounting to a fee increase, rather than simply making explicit costs that were formerly implicit, and so be less willing to contribute to pensions.
How costs and charges differ in DB and DC funds
There may be additional costs incurred in running DC funds that do not affect DB plans, as Table 3.2 highlights. These are related to the elements of choice and liquidity within some DC arrangements. If either employers or employees are able to choose their DC fund, the provider is likely to spend money on sales and marketing activity. Where DC investment strategies have to accommodate inflows and outflows, there may be layers of cost such as platform or entry and exit costs that are charged to members’ portfolios.
Sales and marketing activity that does not include education or information for members does little to improve outcomes, but the costs are borne by members4. These costs may be indirect, for example commissions paid to advisors that come out of contributions, or they may be direct as in Mexico and Poland, where they are counted as operating costs of the provider. Table 3.3 shows the cost of acquiring new business in Poland from 2008 to 2016 and the impact on operating costs of Pension Societies (PTE) when sales activity was banned from 2012. Notably, PTE did not return the savings from reduced sales activity to members; instead, they enjoyed an increase in operating margins.
Members may pay entry or exit fees to underlying vehicles when DC pension plans execute their investment strategy through investments in underlying vehicles such as mutual funds. This is because the plan has to adjust its holdings in the underlying vehicles when members make contributions or withdraw their assets. Entry and exit costs are implicit – they come out of the value of the member’s portfolio – and can be hard to measure. DB plans may also invest via underlying funds, but they are typically able to buy share classes that do not carry entry/exit fees and they do not have to manage such frequent portfolio adjustments.5 The UK Department for Work and Pensions found that among 14 providers handling 14.4 million pension pots, two were unable to say whether they applied entry costs, six applied entry costs but were unable to say what they amounted to, four did not apply entry costs, and two applied entry costs that amounted to a reduction of between 5 bp and 40 bp per contribution. Providers also said that they found it hard to get clear information on entry and exit costs from the managers of the underlying vehicles (DWP, 2017[9]).
When plan members can decide on the design of the investment strategy, then in addition to any entry or exit fees, the member may also pay fees to the provider for the ability to make changes to the selection of underlying funds and for using the provider’s “platform”. The platform provides a service (choice, customisation and easier implementation) but it may be hard to understand what members are paying for this service and what it is really worth.
As well as having additional layers of cost compared to DB funds, DC arrangements may have higher costs than DB funds for equivalent activities. Administration activity is likely to be more expensive within workplace DC plans than in DB plans. DC administrators handle large volumes of small inflows; they may also incur additional costs such as the need to provide middleware (connecting their IT systems to employers’ payrolls) or to offer transfer services to members when they change employers.
DC providers may also have to invest more in communications designed to build member engagement, to help members make choices about their pension arrangements or to encourage them to contribute more. An alternative to such expenditure that would be more effective and lower cost would be to make auto-escalation compulsory, so that individuals’ contributions increased automatically in line with their earnings.
3.2. How market mechanisms can fail
Market mechanisms should theoretically align the costs and charges of funded private pensions and keep them at competitive levels. However, studies in a number of jurisdictions point to a lack of competitive pressures in both DB and DC systems (FCA, 2016[1]; Grattan Institute, 2014[2]; Ayres and Curtis, 2015[3]). Johnson (2017[10]) estimated that the direct costs of the UK’s Local Government Pension Scheme doubled as a percentage of assets over the period 2006-2016 and that indirect costs were as much again as direct costs. Calderón-Colín, Domínguez and Schwartz (2010[11]) concluded that “noise” in the Mexican pension fund market prevented workers from accurately interpreting market signals – instead of responding to price incentives, they were prompted to switch providers by intensive sales efforts. Australia’s 2014 Financial System Inquiry found that “the superannuation system is not operationally efficient due to a lack of strong price-based competition”.6
There are a number of reasons why private pension markets might fail to work. They include (1) lack of engagement by plan participants; (2) complex and opaque charging structures; (3) weak governance; (4) barriers to entry/switching; (5) failure to exploit potential economies of scale; and (6) ineffective fee structures.
Lack of engagement by plan participants
Plan participants cannot be relied upon to encourage competitive conditions among providers (Better Finance, 2017[12]). The problems that individuals have in engaging with and understanding financial products are well documented.7 The problems are particularly acute with pension products, as neither the benefits themselves nor the reduction in benefits caused by excessive charges will be felt immediately. Consequently, members may not respond to high charges by switching plans or pressuring their provider to reduce fees and charges, or pressing their employer to do so on their behalf.
Employees, employers and sponsors may all be ill-equipped to select and monitor their pension fund. Figure 3.2 shows the quality of account transfers in Mexico over the period 2011-2015: over half of transfers were made into providers offering a lower net return than the current provider. OFT (2013[13]) described the buyer side of the UK DC workplace pensions market as "one of the weakest that the OFT has analysed in recent years." Their comment referred not only to plan members, but also to employers that were involved in selecting plan providers; they were concerned that smaller employers might lack the knowledge to select the most suitable provider for their employees and the resources to buy in expertise.
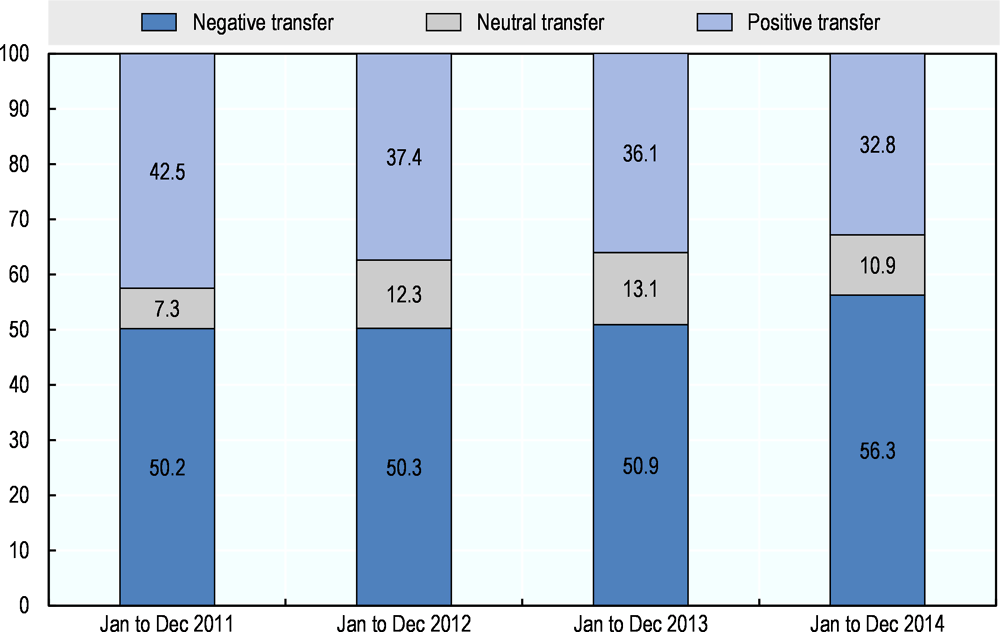
Note: A negative transfer is one to an AFORE offering a lower net return. A positive transfer is one to an AFORE offering a net return at least 5% higher than that offered by the previous AFORE. A neutral one is any other offer.
Source: OECD (2016[14])
Complex and opaque charges
The structure of charges is not standardised, making it difficult for employers and employees to compare what different providers charge in total for DC funds. Fees may cover different costs and be expressed in different ways. Deloitte (2014[15]) sampled 525 plans in the United States and found a variety of fee arrangements for similar services. For example, administration costs could be charged directly to the employer, to the participant, or at the level of the plan itself. These fees could be charged on a per-participant basis, per plan, or as a percentage of assets.
Complex charging structures may lead to wide variations in charges within a single jurisdiction. The Deloitte study found that the “all-in” fee (total charge) for the sample universe ranged from 0.28% to 1.38% of assets on a participant-weighted basis. Clearer communication of fees, such as expressing them in cash terms rather than as a percentage of assets, could help employers and members compare plans more easily, although this would not capture charges that are unreported, opaque or not explicit. Taking fees paid by employees directly out of their wages rather than deducting them from member contributions – as is done in Chile – could encourage awareness of fee levels as their impact on disposable income would be felt immediately.
In DB funds, there may be information asymmetries between sponsors and boards and their suppliers. RailPen, which manages pension assets of over GBP 20 billion, calculated that the total amount it was paying for external investment management were up to four times more than the GBP 70 million that they were paying annually in direct fees. In response, they started to bring more investment management in house.8 Investment managers might charge different fees for segregated accounts to different clients and impose non-disclosure agreements so that pension providers cannot compare the fees they are paying to those being paid by their peers. This has led to a wide range in the fees paid by institutional investors for similar services (Table 3.4).
An important part of these charging structures is investment expenses, which are likely to be a major cost item and potentially one that can be compressed in both DB and DC funds. Ramsey (2002[16])found that charges to recover the cost of investment management typically were the largest ongoing charges and had the most direct relationship to the performance of retirement funds in Australia. Net investment returns – that is, portfolio performance after deducting investment expenses or costs, are a significant driver of pension outcomes.
However, investment costs warrant special attention because they do not exist in isolation from the investment strategy. Low cost, low risk strategies generally generate lower returns than high risk strategies over time. It may be possible to reduce the transaction costs of an active emerging equity fund by negotiating with external managers and brokers; it is not possible to reduce them to the same level as the transaction costs of a passive bond fund. Most of the investment cost savings made by Dutch pension funds in the wake of their transparency initiative came from changing their investment strategies and implementation styles, although they also made savings by putting pressure on external managers and other intermediaries to offer them lower prices. In particular, pension funds reduced their allocations to high-cost alternative strategies and brought active management in-house.
Focusing only on cost may have unintended consequences. Morkoetter and Wetzer (2016[17])found that the introduction of TER reporting may have led Swiss pension funds to avoid higher-performing asset classes because they are focusing on absolute costs rather than costs in the context of returns. However, Ainsworth et al. (2016[18])found that while higher fees were associated with higher returns, they were also associated with higher risk, so that outcomes were not necessarily better.
Weak governance
Weak governance can result in a failure to identify and align costs and charges. Smaller schemes in particular may lack the resources for effective oversight of costs and be in a weak position to negotiate with their suppliers.
Conflicts of interest may weaken governance: external trustees of small plans might vote against scheme consolidation if it would put their jobs at risk, while the boards of providers that are part of a larger financial institution might be reluctant to reduce costs that are a source of revenue for their parent company.
Governance failings could also arise from agency problems, or from a dilution of fiduciary responsibilities as the intermediary chain gets longer. Employers who are responsible for selecting providers may not focus on the costs borne by employees, while employees may lack representation on fund boards.9 Fund platforms might not use their bargaining power on behalf of members. Investment consultants could be tempted to increase their billings by proposing complex investment strategies or frequent changes to asset allocation. Advisors who benefit from built-in commissions (an implicit cost) are less likely to recommend switching providers. Investment managers who are not required to report indirect costs might not try to control them.
Barriers to entry/switching
Barriers to entry and to switching may exist at the level of the provider or at the level of the plan participant. Competition between plan providers should be strongest when a new plan is being set up or when participants (including employers, if they select the plan for their employees, or plan members if they have a free choice of provider) are thinking of switching plans.
Providers may face barriers to entry due to the high proportion of up-front costs in setting up a new plan - fixed costs such as IT are incurred before significant pools of assets are collected. This may make it especially difficult to attract new providers for automatic enrolment schemes targeting smaller employers and lower paid workers. New plan providers and external asset managers might be at a competitive disadvantage from lower brand recognition or a shorter track record. Vertically-integrated providers might limit access to their platforms by external asset managers or benefit from lower internal management costs thanks to the breadth of their internal trading platforms. On the other hand, if it is too easy for new providers to enter the market there is a risk that they will not achieve sufficient scale and be forced to increase charges or reduce the quality of the plan, or withdraw from the market completely.
When plan participants consider changing plan provider, they may be discouraged from doing so by regulatory barriers, such as taxes, or by commercial barriers such as explicit charges. They may also be unwilling to spend the time and effort researching a new plan, resulting in inertia and the failure to switch out of poorly performing plans. Employees who are enrolled into schemes that are selected by their employer may not have the option of switching provider.
Although the threat of switching can encourage competition among providers, participants should avoid excessive churning of pension portfolios, as this can create additional administration expenses for providers and unnecessary trading costs for members.
Failure to exploit potential economies of scale
As noted in OECD (2016[19]), there has been a significant decline in the number of private pension funds and plans since 2005 in several OECD member jurisdictions. A number of countries with mature pension systems, including the Netherlands and Australia, are actively encouraging further consolidation of funds. Pension plan size varies considerably across OECD and IOPS members and it is not clear that there is an "optimal" plan size, but the existence of high fixed costs in pension plan administration implies that larger plans will be more efficient. They could also benefit from better governance: the decrease in the number of pension funds in the Netherlands since 2005 from 800 to less than 400 has been accompanied by tougher qualification requirements for trustees.
Administration costs are largely driven by the size of the plan, as shown in Figure 3.3. Cost items such as IT, oversight, communications and collections have a substantial fixed element and there is evidence that scale economies can be captured relatively quickly. Di Gialleonardo and Marè (2015[20]) found that the administrative costs per participant of supplementary closed pension funds in Italy fell from EUR 31.43 for funds with 10 000 - 50 000 members to EUR 19.63 for funds with over 50 000 members. Furthermore, there were no diseconomies of scale for bigger funds. Bikker (2013[21]) reached similar conclusions for Dutch pension funds and found also that the size at which funds could continue to reap scale economies was increasing over time, suggesting that "average administrative costs per participant now decline without limit", in part because of more expensive technology and more complex regulation.
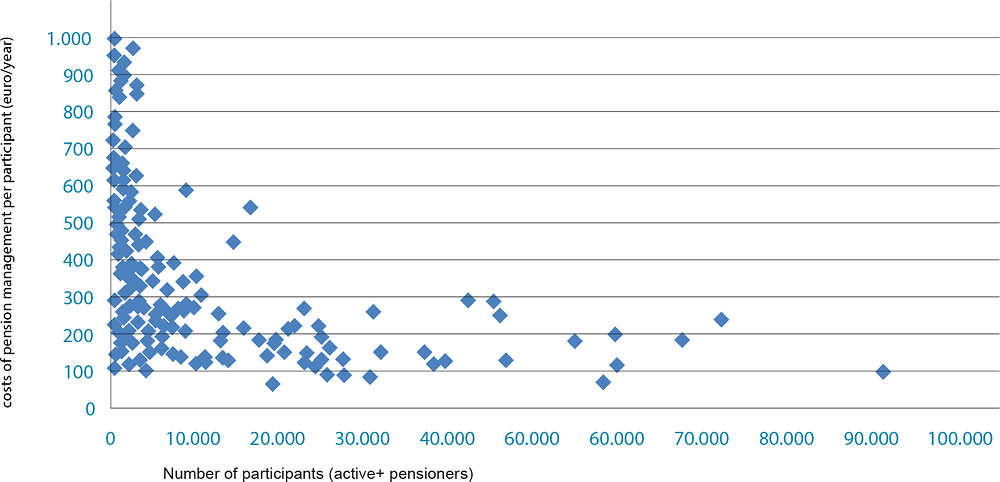
Note: Excludes pension funds with > 100 000 participants; all such funds had administrative costs below EUR 120 per year per participant.
Source: Pensioen Federatie (2016[22]).
Both studies found that the evidence for economies of scale in investment costs was less conclusive. Sources of economies of scale in investment costs include negotiating power with asset managers and other suppliers such as custodians, spreading semi-fixed costs such as research on external managers, and bringing investment management in house, especially for complex asset classes. Table 3.5 shows the fees charged by external managers to different types of US institutional investor in a range of asset classes – bigger investors pay less than smaller investors in every case.
Di Gialleonardo and Marè (2015[20]) suggest that the relatively low level of management fees for closed funds in the Italian market might leave fewer opportunities for further cost reduction and that larger funds implement more complex and so more costly investment strategies. Bikker (2013[21]) found that larger funds used more expensive asset classes and that scale economies were exhausted at an asset size of EUR 690 million. However, Broeders, van Oord and Rijsbergen. (2016[24]) found significant and sustained economies of scale for all pension funds with assets over EUR 20 million. Dyck and Pomorski (2011[25]) found that investment economies of scale worth between 43-50 bp per year for the largest DB funds, driven by insourcing asset management and increasing allocations to alternative asset classes.
However, there may be diseconomies of scale arising from concentration risk (investors may have limits on the proportion of an underlying asset that they can own, or of the share of an individual manager’s business that they can represent), from market impact (market delays or adverse price movements from passing large trades) or from the temptation to go into riskier asset classes. Larger DB plans may find it difficult to implement LDI strategies because there are fewer counterparties for large derivatives trades. Reducing the number of plan providers too far could stifle innovation by both providers and external investment managers, although this is unlikely to be a problem in countries such as Australia, the United States or the United Kingdom where there are multiple providers (Axa, 2013[26]).
Ineffective fee structures
Fee structures should be designed to provide the right incentives to managers to achieve the best outcomes for members and plan sponsors. In traditional asset classes, investment manager fees are usually ad valorem, that is they are calculated as a percentage of assets under management. Managers of alternative assets, such as hedge funds or absolute return funds, may charge a combination of an asset-based fee and a performance-based fee. Neither fee structure will necessarily reward managers appropriately.
Ad valorem or asset-based fees provide few incentives for investment managers to become more efficient or to share efficiency gains with clients. They can reward poor performance and penalise good performance. In other words, this fee structure may not provide good value for money. For example, a portfolio manager who generates returns of only 8% when the market rises by 10% will earn more in absolute terms, while one who returns -10% when the market falls by 50% will earn less in absolute terms, even though he has provided a much better service to his clients by limiting their losses. As shall be discussed below, performance-based fees can help avoid this problem but need to be carefully designed so that managers do not keep a disproportionate share of the value they create, and they do not distort incentives.
3.3. Policy options
Policy makers have introduced different measures to bolster or replace weak market mechanisms. Some options are aimed at better aligning fees and charges, while others are geared towards providing better value for fees and charges. The range of measures includes disclosure-based initiatives, price regulations, and structural solutions.
3.3.1. Disclosure-based initiatives
Disclosure-based initiatives have been the principal focus of regulatory efforts to strengthen competitive pressures on providers. There are different types of disclosure initiatives. Efforts to increase transparency of charges and costs are intended to influence their level. Disclosure-based initiatives can also be used to improve outcomes for members and plan sponsors by getting better value. These initiatives include the use of benchmarks to compare the value that pension funds deliver to members, and the reporting of outcomes alongside different investment strategies.
Greater transparency to influence the level of costs and charges
Making costs and charges more transparent has been a key objective of policy in all jurisdictions, with measures to improve reporting, communication and benchmarking of investment costs and plan charges. Such measures target market failures arising from lack of engagement by plan participants, complex and opaque charging structures, and weak governance.
Cost transparency has been successful in encouraging providers to monitor and control their costs in both DB and DC occupational pension markets. In the Netherlands, pension funds are required to provide granular information on administration and investment costs and this has led to greater cost awareness among sponsors and fund boards, resulting in better outcomes (see Box 3.1). Funds must report on their costs to a level of detail similar to that in Table 3.2, and the Dutch National Bank benchmarks the costs and investment performance of plans against their peer group and calls “expensive” plans to account.
The Dutch Authority for Financial Markets (AFM) published in 2011 a report on pension fund costs that highlighted:
-
The influence of costs on retirement incomes
-
That costs differed markedly among pension funds of similar size
-
The potential for economies of scale
-
Under- reporting of costs by pension funds
The report sparked a considerable backlash in the press and prompted the industry to address the issue of transparency. Over time, the Netherlands has introduced a series of legal and voluntary requirements for pension funds to publish more and more detail on their cost structure, service levels and performance. It is now mandatory for pension funds to report their administration costs, investment costs and transaction costs.
The evolution of plan providers' costs since the start of the reforms demonstrates the effectiveness of the Netherlands' cost disclosure framework. Table 3.6 shows cost data for five of the largest DB funds.
The reported costs suggest that pension providers had an incomplete picture of their costs before the authorities introduced reporting requirements. ABP and PMT understated their 2010 costs. The data also shows that pension funds were able to take action based on the new information – PME and PMT both reduced their costs over the period 2011-2013. It should be noted that the other funds took similar action, but made other changes that mean that overall costs did not decline.
The success of the framework reflects a number of factors:
-
Regulatory pressure: although the development of reporting standards was led by the industry, there was a clear message from the Dutch Central Bank, DNB, that it would intervene if progress was too slow (public pressure also contributed).
-
Industry leaders: the biggest funds adopted the voluntary Recommendations on Administrative Costs quickly; the Recommendations are burdensome for smaller funds but compliance is now close to 100%.
-
A gradualist, pragmatic approach: reporting requirements have become stricter and more detailed over time. For example, look through costs have to be reported since 2017 only. The usefulness of data is set against the cost of collecting it.
-
Benchmarking: the data is intended to enable participants to understand the relative performance of their plan on a number of criteria. Standard definitions and calculations are therefore used.
-
Explaining cost drivers: pension plans’ costs are heavily influenced by the choice of investment strategy, the scale of the fund, the complexity of the membership base, and service quality. Pension plans are benchmarked against plans with similar characteristics and annual reports contain detailed information about investment strategy and about service levels (for example, query handling).
Disclosure requirements are accelerating in many jurisdictions (Box 3.2). However, cost transparency can be cumbersome. The potential list of total direct and indirect investment costs is extremely long – the FCA Institutional Disclosure Working Group (IDWG) came up with over 300 discrete cost items – but many indirect costs are difficult to capture and may not be meaningful. Governing bodies, sponsors, regulators and members may be overwhelmed by too much data. In addition, some costs are relatively small, so may not be worth measuring; others are relatively large but cannot easily be compressed even once they are revealed. For example, stamp duty is a large part of trading costs, but cannot be avoided. An analysis of Local Government Pension Scheme costs in 2014 estimated that direct equity trading costs on a portfolio with turnover of 140% per annum were at least 75 bp. Of this, only around 10 bp was commission (which can potentially be squeezed through negotiation with brokers) while 65 bp was stamp duty and taxes. This figure was considerably higher than the direct investment management costs of 25.4 bp and administration costs of 12.6 bp (Sier, 2014[27]).
Regulators therefore need to decide which costs are relevant and whether and how they should be made transparent. Transparency does not have to create complexity. Meaningful cost reductions can be achieved even before detailed information about indirect costs is available. From 2011 to 2017, pension providers in the Netherlands were able to use standard, proxy spreads to measure transaction costs in fixed income portfolios and to use entry and exit charges as a proxy for look-through transaction costs. Despite the lack of detailed information about indirect costs, cost awareness increased and total costs fell.
A number of jurisdictions have introduced measures to improve transparency about DC costs and performance, in order to raise member engagement. The Danish government-backed site www.pensionsinfo.dk provides members with information on their individual accounts including direct and indirect administration and investment costs and past returns. The 2015 Communications Act in the Netherlands requires schemes to provide standardised information to members.
This type of information can enable members to make more straightforward comparisons between funds. In Mexico, individual pension statements include information on net-of-fees returns across AFORES (providers). Both Hong Kong (China) and Italy provide comparison websites and therefore impose a degree of standardisation on the way information about fund charges is collected and displayed.
Regulatory efforts to increase investment cost transparency are accelerating in several countries.
The Australian Securities and Investment Commission (ASIC) introduced enhanced fee disclosure requirements for most superannuation products and managed investment schemes in 2017 (ASIC, 2017[28]). Regulatory Guide 97 requires issuers of superannuation products to disclose indirect costs, defined as any amount that could potentially reduce the return of a product or the ultimate reference asset and that is not charged to the member as a fee. This includes the costs of interposed vehicles, such as fund-of-funds structures.
In the European Union, two new pieces of legislation came into effect at the start of 2018 that will increase transparency requirements on those providing investment services:
-
MiFID II specifies that firms providing investment services shall provide ex ante and ex post disclosure on total costs and charges that are expected to be incurred by the client
-
PRIIPS will require all entities advising on or selling Packages Retail and Insurance-based Investment Products to provide information on all direct and indirect costs to be borne by the retail investor.
In the United Kingdom, both the Financial Conduct Authority (“FCA”, the regulator of contract-based schemes) and the Department for Work and Pensions (“DWP”, the regulator of trust-based schemes) have imposed enhanced reporting requirements on providers but they have so far been reluctant to impose a standardised cost disclosure template on providers or asset managers. However, the regulators have tasked the industry to come with proposals to improve transparency.10
Since April 2015, all providers of contract-based pension schemes have been required to establish an Independent Governance Committee (IGC). IGCs are required to consider all the costs and charges of the scheme and produce an annual report demonstrating the value for money delivered by the scheme so that members can compare providers across the market.
FCA Policy Statement PS17/20 came into effect at the start of 2018 (FCA, 2017[29]). It requires firms managing money on behalf of DC workplace pension schemes to provide:
-
Information about transaction costs calculated according to the slippage cost methodology (i.e. the difference between the price at which a transaction was executed and the price when the order to transact was transmitted to a third party, in line with MiFID standards)
-
Information about administration charges
-
Appropriate contextual information
Demands from the public or press for better disclosure of costs have spurred transparency initiatives in several countries, including Israel and the Netherlands. However, a clear signal from the regulator has been the decisive factor in ensuring that providers sign up to disclosure standards. The Netherlands reporting framework was developed by the pensions industry in response to demands from the regulator. The United Kingdom relies on a combination of regulation and industry co-operation, while binding transparency requirements have been introduced in Australia and the European Union. The United States approach is different: the law requires fiduciaries to act prudently and in the interests of participants, and implicitly relies on market forces, supervisory activity including disclosure and the right of legal redress by members to contain costs.
Disclosure will only be effective in bringing down costs and fees if providers, sponsors and members understand and act on the information. Most OECD and IOPS member countries have found that disclosure-based initiatives, giving members and sponsors the information they need to apply competitive pressure to pension providers, have had some effect but not enough to align charges with costs. Therefore, they have supplemented these initiatives with measures to regulate fees or influence the structure of the market or of the providers themselves.
Benchmarking to help improve outcomes for members
Improved transparency can help align costs and charges across funded pension systems but will not necessarily reveal whether there is further room to improve outcomes at the level of the individual provider. Would it be possible for a given pension provider to deliver more speedy and accurate administration services at the current cost, or is the provider offering expensive services that members did not value? Could investment costs be reduced to increase the net returns generated by the investment strategy?
Benchmarking providers could give regulators, members and employers and sponsors information about the relationship between costs and outcomes of their pension fund that would complement other policy efforts to bolster market mechanisms.
Finding a relevant point of comparison for pension funds is not straightforward. Cost and quality can vary widely, depending on the nature of the pension arrangement, the complexity of its administration and investment operations, its membership structure and the design and implementation of its investment strategy. Benchmarking can lead to herding behaviour in investment and less innovation in administration, resulting in weaker competition among providers, and might encourage short-termism in investment. However, peer groups, proxies and other reference points can be constructed.
It should be relatively straightforward to assess whether there is scope to improve outcomes being delivered by DB arrangements. DB providers have a clear target – to grow assets so that they meet future liabilities – and often have a strategic asset allocation to guide long-term investment strategy. Net portfolio returns give an indication of the quality and cost of the investment strategy and can be compared to market returns for equivalent asset classes, or to the investment gains made by other DB funds with similar portfolios. Administration costs can be identified and the quality of administration services can be judged using largely quantitative criteria. Absolute levels of cost and quality will vary across plans, but comparisons can be made across providers with similar activities.
Table 3.7 shows the information revealed in the financial statements of two large occupational DB plans in the Netherlands and two in the United Kingdom. Table 3.7 does not show that one fund offers better value than another, but it highlights areas where there may be scope for funds to reduce costs. Administration costs of the four funds range from 4 bp to 10 bp of assets under management and direct investment costs from 10 bp to 19 bp. The United Kingdom does not require funds to report total investment expenses.
If DB providers understand their cost structures and they are able (or required) to benchmark the cost and performance of their administration and investment activities against relevant peers, they will be able to see where there is scope to improve outcomes. If there is an incentive to improve relative performance – or a sanction for being at the bottom of the range – then it is even more likely that pension providers will deliver good and improving value.
The supervisor enforces both transparency and benchmarking in the Netherlands. Pension plans are required to explain deviations from the cost structure of the peer group. The average investment costs for all pension funds were 58.5 bp in 2015; administration services for members (i.e. excluding the costs of governance and oversight of the plan) cost a further 7.5 bp; total costs across all funds ranged from 15 bp to 200 bp.11
In Switzerland, pension funds have been required to report their Total Expense Ratio (TER) in their annual reports since 2013;12 in that year they were also obliged to collect TER data from underlying vehicles in which they were invested and publish a blacklist of those who did not comply. The Swiss supervisor, OAK, is expected to publish comparative data on more than 2 000 pension funds in the near future.
It is more difficult to assess and compare across DC funds. They have a wide range of administration service levels, investment strategies and liquidity constraints, especially in DC systems where there is an element of choice. Employers or employees may be able to choose their provider, they may select bespoke investment strategies or require different levels of administrative support. There may be intermediaries between the member and the provider. This means that a wide range of DC outcomes is possible, making it complicated to construct peer groups.
Unlike DB funds, which have a unique long-term investment objective (meeting liabilities), DC plans can have different goals. PPI (2016[30]) noted that while high charges erode returns, members may prefer a higher priced, lower volatility investment strategy to either a lower cost strategy or a higher risk strategy, depending on their risk tolerances and other sources of retirement income. Where members are allowed to choose between different strategies offered by their provider or to build their own asset allocation from a range of underlying investment options, they could have widely differing investment outcomes in terms of returns, risks and costs (Table 3.8). Absolute investment gains and performance relative to market benchmarks or peers could also vary markedly over different time horizons.
Given the difficulty of creating DC peer groups of funds with similar administration and investment activities, a simpler method of assessing the relationship between provider costs and member outcomes could be to use default funds as a reference point for DC plans. Default funds are intended to provide an investment strategy that is suitable for the majority of DC members, which limits the design options. They are usually required to be low cost. Harrison, Blake and Dowd (2014[31])suggest that 50 bp is a reasonable TER for a default fund operating at scale. The OECD Roadmap for the Good Design of Defined Contribution Pension Plans recommends establishing appropriate default investment strategies, in particular lifecycle strategies.
Not all pension systems include a unique default fund. Countries may have a number of competing default funds offered by different providers, or no default option. Other, similar types of pension plan could serve as a benchmark, such as the lifecycle funds that are offered by the Thrift Savings Plan in the United States. Alternatively, a proxy portfolio that follows the principles of a default lifecycle option could be constructed as the basis for comparing the investment design and cost of actual DC arrangements. It would not, however, give information about administration activity.
DC plans could be assessed against the fees (to members and employers) and net returns of the default strategy or proxy. Members of other DC plans could reasonably ask their provider whether they were on track to achieve equivalent outcomes to the default for a similar cost, and if not, why not.13
Default funds with very similar investment designs can deliver different investment returns and charge a wide range of fees. Table 3.9 shows the investment strategy and fees for selected default funds or proxies in different jurisdictions. Return targets and investment performance differ between the funds, but the investment designs are similar: all include a form of de-risking as the member approaches retirement age. Fees vary from a minimum of 3.8 bp (United States) to a maximum of 95 bp (Hong Kong, China).
Benchmarking DC plans against a default could help to identify outliers in terms of outcomes, but it would remain complicated to draw conclusions about the potential to improve outcomes at individual funds in jurisdictions with a large number of providers and a wide variety of plan designs. Therefore, benchmarking should complement and not replace measures to align costs and charges at competitive levels.
Investment strategy reporting
Investment costs do not exist in isolation from the investment strategy. They should therefore be reported together. Indicators that take account of investment performance, manager skill and asset class are needed in addition to cost information to assess whether a fund’s investment expenses are reasonable. This assessment of reasonableness can be made both in absolute and in comparison to the costs incurred by other portfolios.
These indicators would also make it possible to tie rewards more directly to outcomes. Investment managers and strategies can be analysed in terms of the returns generated per unit of risk taken, fees per unit of return and the amount of return that is retained in fees.
This analysis is robust across different asset classes and investment styles. For example, passive management will score highly in terms of cost versus risk because passive portfolios track the reference benchmark closely and have low management fees and transaction costs. However, passive management scores poorly in terms of cost versus alpha because passive funds are not designed to outperform the market. This type of analysis makes it easier to improve the value for money of investment activities by tying rewards for investment managers to outcomes.
3.3.2. Pricing initiatives
Governments have introduced pricing initiatives aimed at managing fees and charges or providing good value to members. Pricing regulation aims to specifically limit what providers can charge. Some jurisdictions have also introduced performance-based fees to ensure that investment managers are rewarded for delivering high returns per unit of risk taken. They are intended to incentivise investment managers to become more efficient or to share efficiency gains with clients.
Pricing regulation
Pricing regulation can contribute to disclosure efforts by simplifying fee structures, making it easier for participants to understand what services they are paying for and exactly how much they are paying. Alternatively, pricing regulation can force providers to take action on costs, by imposing limits on what they can charge.
DC arrangements are subject to this type of price regulation in several countries. Australia, Estonia and Hong Kong (China) have introduced low-cost plans. Chile, Sweden, Turkey and the United Kingdom have imposed charge caps. Mexico simplified fee structures in 2008 by stopping the use of fees on contributions, so that AFORES can only levy a fee calculated on assets under management, which was also capped. Costa Rica replaced its mixed fee structure with a single, asset-based fee in 2011. In Denmark and Poland, fees are levied on both contributions and assets under management, whereas in Spain only asset-based fees are permitted.
Different fee structures may be appropriate at different points in the development of the pensions system or the growth of a pension fund. Assets grow over time, so asset-based fees reward established providers who have had time to collect and grow contributions. Contribution-based fees enable new DC schemes to raise revenues more quickly, but may not cover costs as plans mature if members leave or defer. Pricing regulation may therefore need to evolve as pension systems mature.
However, unless both asset-based and contribution-based fees cover a significant part of total costs, including indirect and implicit costs, this may not be sufficient to deliver better pension outcomes. Therefore, more direct controls over pricing, such as charge caps, may be introduced. The United Kingdom introduced a charge cap of 0.75% of assets under management on workplace default funds from April 2015. The cap applies to all direct and indirect administration and investment costs, but does not include transaction costs. As well as putting an upper limit on default fees, the cap also helped to raise awareness of high charges in other DC arrangements. The charge cap appears to have been effective in reducing fees for DC funds: all qualifying schemes (those that are eligible to be used as defaults) are now priced below 75 bp and the prices of other schemes have also fallen.
Charge caps set a clear and simple standard for member charges but can have unintended consequences. If the cap is set too high, charges tend to rise to the level of the cap, as was seen earlier in the UK market when stakeholder pensions were introduced with a maximum charge of 1%, which quickly became the market price for all similar retirement savings products. In a similar manner, the German government’s estimated total charge for Riester products of 10% has become the de facto standard charge (Better Finance, 2016[32]). If the cap is set too low, plan providers might try to cut costs by offering lower-quality plan designs or by reducing the number of transactions they undertake, even when the trades would be in the best interests of members.
If the cap does not include all direct and indirect costs, then providers might have an incentive to exaggerate uncapped costs in order to compensate for any lost profits in areas that do fall within the scope of the cap. Turkey reduced its charge cap quite significantly in 2013 and introduced a new charging structure consisting of a capped ad valorem fee that varies by asset class (ranging between 1.09% and 2.28%), a fee on contributions and a small fixed on-boarding fee. The cap takes into account all fees that pension providers can earn from participants and total fees are capped from the sixth year of a contract.
Establishing the correct level of the cap is especially complicated in markets where providers have different cost structures. Setting the cap in line with the cost structure of large, vertically integrated providers might squeeze out smaller providers. A low cap can also discourage new entrants. However, a relatively high cap could enable lower-cost providers to generate excessive profits if they chose to price at the level of the cap, unless there was pressure from participants or other stakeholders to reduce charges.
In order to capture economies of scale on behalf of members, charge caps should not be static. Costa Rica initially capped fees at 1.1% and this will reduce to 0.35% by 2020. In Estonia, fees must be reduced by 10% for each EUR 100 million increase in assets.
Charge caps focus on fees rather than design, putting the onus on providers to come up with a pension design that is profitable for them within the cap. An alternative form of pricing regulation is to introduce standardised pension designs with regulated fees. MySuper products in Australia have simplified product specifications and a limited range of fees, although this has not led to a high degree of standardisation in terms of product attributes, costs and outcomes. The Default Investment Strategy introduced by Mandatory Provident Fund (MPF) schemes in Hong Kong (China) in 2017 has a fixed asset allocation and maximum fees. MPF schemes were already required to offer a low-fee fund with no restrictions on design but with maximum management fees of 1% of assets.
Another form of price control is to change the basis for charges. Member-borne commissions have been banned in UK DC schemes; similar measures have been introduced in Australia and the Netherlands. Mexico changed the incentive structure of sales agents to limit negative-yielding switches.
Introducing performance fees to achieve better investment outcomes
Asset-based fees can fail to provide incentives to investment managers to become more efficient or to share efficiency gains with clients. Performance-based fees are one solution. Unlike price caps which specifically limit charges, performance-based fees aim to better align the interests of investment managers and pension fund members and sponsors. Hamdani et al. (2017[33]) use evidence from a regulatory experiment in Israel to demonstrate that funds with performance fees exhibit higher risk-adjusted returns than funds with asset-based fees operating in different competitive environments.
Performance-based fees can complement other pricing regulation such as price caps. This may be useful since ad valorem fees can limit the effectiveness of price caps. The average net profit margins of Mexican Pension Fund Providers (AFORES) rose from 33.5% in 2013 to 37.4% in 2017, despite pressure from the regulator, CONSAR, that pushed average fees down from 1.29% to 1.03% of assets under management over the same period (Table 3.10). Assets under management grew rapidly, implying that the AFORES were reaping economies of scale, and the cost of acquiring new contributions fell (Table 3.10). CONSAR will therefore start considering cost indicators, such as net profit, return on equity and return on assets, when assessing fee proposals from the AFORES. It also intends to introduce performance-based assessments, by taking into account historical investment performance, and investment performance relative to a benchmark portfolio.
Performance-based fees must be structured in such a way as to give the right incentives to pension funds and their investment managers. Rewards should be paid for delivering high returns per unit of risk taken, and a fair share of returns should stay in the portfolio rather than being paid out in fees. The basic parameters of a performance fee design (there are many more complex structures in operation) are:
-
The fee base (e.g. is the fee calculated on investment gains or on assets under management (AUM)) and the fee rate
-
The performance reference point, i.e. the minimum return the fund must earn before a performance fee is due
-
The measurement period, i.e. the length of time over which performance is calculated
-
The high watermark (HWM), if any, which is the last highest value that the fund has reached
The performance reference point can be fixed (a “hurdle rate”) or variable (e.g. a market index). It is important that the reference point reflects the investment strategy of the fund. An equity manager should not be paid a performance fee for outperforming a cash benchmark, since the bulk of any outperformance is likely to be due to the investment characteristics of equities relative to cash rather than to manager skill. Pension fund management companies operating in Latvia’s mandatory funded scheme are benchmarked against a composite debt and equity index. In Poland, the reference point is competitors’ performance. Performance fees are calculated as 0.06% of assets under management multiplied by the “percentage premium ratio”, or the relative performance of the fund versus its peers. The ratio is 1 for the best performing fund – which receives a performance fee of 0.06% of AUM – and 0 for the worst performer – which receives no performance fee. Other funds receive an amount below 0.06% of AUM that reflects their relative position.
High watermarks (HWM) are intended to ensure that managers are not paid a performance fee for good performance in one period unless they have caught up any underperformance in previous periods. The fund value must always be above the previous HWM for a performance fee to be earned. The Czech Republic and the Slovak Republic both use HWM in the calculation of performance fees; the Czech Republic sets the HWM as the historic maximum value of the fund while the Slovak Republic looks back over a shorter period.
High watermarks can be effective in preventing a “double fee”. Such double charging is a feature of ad valorem fees, where the fee basis is the full AUM. An individual, who joins a DC scheme at the age of 25 and retires at the age of 65, will pay annual fees on his first year’s contributions 40 times. Fees will also be paid each year on the prior years’ investment gains. Box 3.3 illustrates the application of a performance fee with a fee base of investment gains, a fee rate of 20%, a hurdle rate of 5%, a measurement period of one year and a HWM. Box 3.3 also shows that a high watermark can be effective in preventing a “double fee” (i.e. the fund manager is not rewarded for the Year 1 performance in both Year 1 and in Year 4). Conversely, if an asset class suffers a sharp fall, a manager might take several periods to get back to the HWM even if he outperforms the market consistently. This outperformance would not be rewarded. This can be resolved through the use of “relative high watermarks”, relative to different asset classes.
However, this may not be enough to create alignment of interests. The upside potential of a strongly performing manager is potentially unlimited, while the downside risk is limited – especially since most performance fees are payable on top of an asset-based fee. Fee caps can help to create more symmetrical payouts; so can reserve systems, whereby a portion of any performance fees earned are “banked” in a reserve pool, and used to top up the portfolio if the manager subsequently underperforms. This cushions investors against a run of poor returns and leaves the possibility for the manager to earn back lost reserves and fees once performance improves.
There are practical difficulties in implementing performance fees. Parameters need to be negotiated and calculating fee accrual can be complex; performance fees may be higher than asset-based fees for strong managers and so increase investment expenses. They may also pose stability risks, as performance fees are more volatile than asset-based fees. Given the importance of investment manager fees and performance to outcomes, they are nonetheless a potentially powerful means of improving the value for money of the investment activities of pension funds.14
The chart shows the path of a pension fund portfolio, with a starting value of 80 rising to 100 at the end of Year 1, falling to 82 at the end of Year 2, climbing back to 90 at the end of Year 3 and finishing Year 4 with a value of 110.
The fund manager receives a performance fee of 20% for performance above a hurdle rate of 5%, subject to a high watermark, HWM. The fee is calculated on the absolute increase in the value of the portfolio.
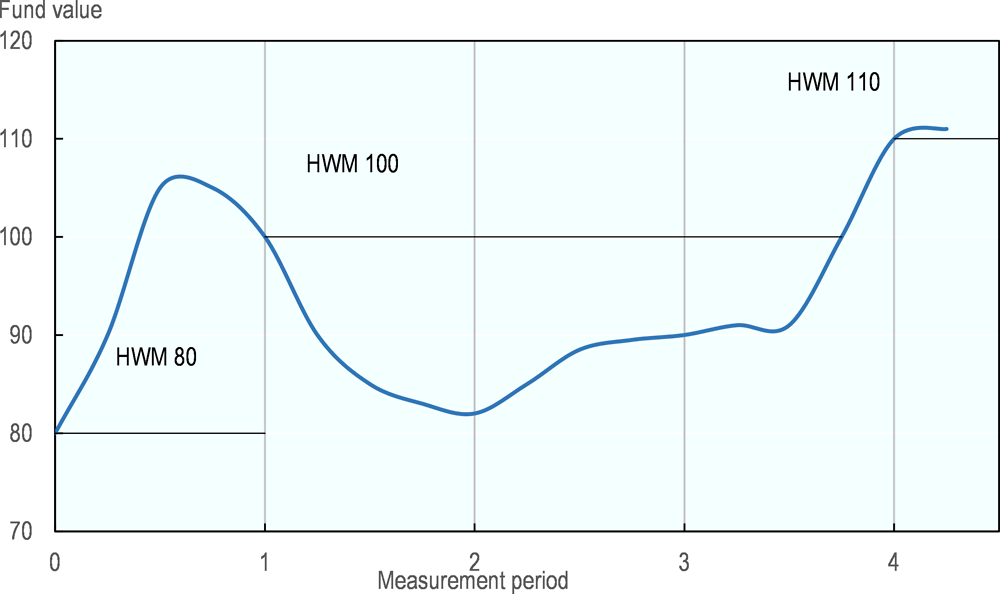
At the end of Year 1, the fund manager has earned a performance fee of 4. This is equal to 5% of AUM and 20% of investment gains. Absolute performance is 20 (100-80), equating to an investment return of 25% (20/80) and the hurdle rate is 5%. The performance fee is therefore calculated as [20 × (25% - 5%)]. The high watermark rises from 80 to 100.
The fund ends Year 2 with a negative performance and fails to meet the hurdle rate, so no performance fee is due. At the end of Year 3, the fund value has risen from 82 to 90, a return of 9.75% that is almost double the hurdle rate. However, the value of the fund remains below the HWM so no performance fee is due.
At the end of Year 4, the fund value has risen by 20, or 22%. The fund manager earns a performance fee of [20 × (22% - 5%) = 3.4]. This is equivalent to 3% of AUM and 17% of investment returns. The new HWM is 110.
Structural solutions
Structural solutions entail efforts to overcome market weaknesses by intervening in the structure of the market. These can include measures to strengthen market mechanisms or alternatively to circumvent them and their weaknesses by imposing new organisational structures.
Mexico and Chile provide examples of policies designed to strengthen market mechanisms. In Mexico, the number of providers (AFOREs) increased from 11 to 21 between 2003 and 2008 as the Regulator encouraged new entrants in order to stimulate price competition. However, because of weak member engagement and inappropriate incentive structures, this led instead to increased expenditure on commercial activity that did not benefit plan participants.
Chile followed a different approach, introducing an auction process in 2008.15 Providers bid for the right to enrol new members of the mandatory DC system who remain captive for two years. Bids cover administration costs and internal investment costs and must be lower than the minimum fee currently available in the market. This appears to have been effective in reducing fees levied by Chilean providers (AFPs): the first auction in 2010 was won by a new entrant to the market with a bid of 1.14% of salary; by 2016 the lowest fee in the market had fallen to 0.41%. However, according to the Superintendence of Pensions, average fees, weighted by the number of contributors, have shown a smaller decline from 1.50% in January 2010 to 1.20% in June 2017. Furthermore, there were no bidders for the latest auction, most probably because providers could not improve upon the previous winning bid as required by the design of the auction process.
A fee-based auction system presents potential risks. Providers might make unsustainably low bids, in the hope that they would make enough gains from economies of scale to remain profitable if the won the auction. Eventually, they may raise their fees to compensate for this unsustainable position, eroding the benefits of the auction system, or they may reduce the quality of their investment and administration services. The Australian Productivity Commission (2017[34]) describes the potential risks.
A multi-criteria tender could partially address such risks. To select default providers, New Zealand uses a range of selection criteria in addition to fees (e.g. fund features, past investment performance). However, this approach is more expensive to implement and may introduce more subjective judgements into the tender process.
In some pension systems, regulators look to improved governance to create the conditions for market mechanisms to function. Australia and the Netherlands have imposed tougher qualification requirements on members of governing bodies, and the UK regulator is asking for more detailed reporting from the Independent Governance Committees of DC schemes. These reforms are in each case part of a much larger package of measures to improve outcomes for DC plan participants. In the United States, under the federal statute known as ERISA, plan administrators, sponsors and other parties have fiduciary responsibilities in terms of managing costs and imposing fees. Private lawsuits and compliance enforcement reinforce this regulatory approach.
Policymakers may consider measures to influence the operational set-up of pension providers or the organisational set-up of the market in which they operate in order to align costs and charges at competitive levels. Policymakers in several jurisdictions are encouraging schemes to consolidate to reap economies of scale. Fund mergers can be mandatory, as in Sweden, or a voluntary response to other regulatory pressures such as increased scrutiny of costs, as in the Netherlands and Switzerland. Canada's Pooled Registered Pension Plan system is designed to pool individual accounts in order to benefit from scale economies and participating providers must ensure that charges are no more than they would be for a plan with 500 members. The Australian Prudential Regulation Authority (APRA) found considerable scope for rationalisation and efficiency within the superannuation system, with over 40 000 investment options available across the industry (APRA, 2016[7]). Although APRA does not stipulate a minimum size for a provider, it suggests that better-resourced superannuation funds might be more sustainable as the system matures and cash flows turn negative. APRA applies a scale test to MySuper products to check that returns are not adversely affected by the size of a (smaller) fund.
Alternatively, rather than attempting to influence the cost structure of existing pension providers, policymakers may change the structure of the market by establishing new, centralised institutions. These can help to control total charges to members in a number of ways. They can provide additional competition to plan providers – the UK’s NEST competes with other providers for auto-enrolment business. They can offer low-cost solutions directly to underserved populations – NEST has an obligation to take on smaller accounts. They can ensure that scale economies are available to all participants – Sweden’s PPM clearinghouse offers very low platform fees to plan providers and has negotiated total investment costs including transaction costs for members of only 30 bp.
However, it could be argued that centralised institutions have an unfair marketing advantage and can price in scale economies before they are realised thanks to government support. Furthermore, centralised institutions may add to complexity when employers or members have choices to make. NEST's annual management charge of 0.3% is low relative to the UK market, but it also charges employers a fee on contributions of 1.8% that makes comparisons with other providers more difficult (Now Pensions has a monthly charge of GBP 40 and People's Pension charges a one-off set up fee of GBP 500 or GBP 300 if the employer comes via an intermediary).
Countries could consider a combination of several potential solutions to reduce fees. For example, India’s National Pension System (NPS) combines centralised institutions, an auction system and fee caps. Rather than having integrated providers, NPS has unbundled the various administration and investment activities and found a low-cost intermediary for each activity, as shown in Table 3.11. There are two providers of central record-keeping and clients can choose between them based on quality and cost criteria. The NPS is technology driven, both to enhance interactions with members and to contain costs.
3.4. Conclusions and policy implications
The cost of running pension funds – providing administration and investment activities – and the way those costs are passed on to members, employers and sponsors have a significant impact on outcomes. The value of pension assets is directly affected by fees that are levied on contributions before they are invested and by other charges that are deducted from the investment portfolio throughout the accumulation phase.
Market mechanisms cannot alone be relied upon to keep costs and charges at competitive levels. Initiatives to improve transparency are the principal policy tool that jurisdictions have implemented for strengthening competitive pressures in private funded pension systems. These policies have been supplemented by regulations to control pricing and/or structural measures to influence the set-up of the pension market or the products offered by pension providers.
There are a number of lessons that can be learned from the experience of different jurisdictions in addressing weak market mechanisms in both DB and DC pension provision.
-
No single policy response is effective in isolation. Measures aimed at stimulating market mechanisms work best when they are reinforced by pricing regulation and structural solutions.
-
Transparency is a pre-requisite for aligning costs and charges, but is not sufficient in itself to improve outcomes. Sponsors and trustee bodies must be prepared to act on the information to reduce the costs of DB plans, and employers and members must be able to benefit from greater disclosure to put pressure on DC providers.
-
The role of the Regulator is critical. Plan providers may take action on costs and charges when faced with regulatory and compliance enforcement action (or the threat of such action). Plan participants are generally ill-equipped to tackle excessive costs and charges without support from regulators and policy makers.
Reducing costs leads to immediate gains, which can become significant over time through the effect of compounding. Targeting costs and charges may not, however, improve outcomes.
-
It is difficult to get a true picture of total costs, so such policies may miss important indirect or implicit charges.
-
Cost-cutting may lead to overly conservative investment strategies or lower quality administration services.
-
Policy makers have therefore tried to address the “value for money” offered by pension providers as well as their costs.
The relationship between costs and outcomes determines whether a pension fund is offering good value for money.
-
Benchmarking DB funds against relevant peer groups, and DC funds against a low-cost lifecycle strategy, can reveal whether administration and investment costs are competitive and investment performance is commensurate with investment expenses.
-
For benchmarking to be effective, providers that underperform need to be held to account by the regulator, sponsor, or members.
-
Direct investment costs are likely to be one of the biggest expenses for pension funds so it is important that they do not overpay for investment performance relative to other funds. Rewards for portfolio managers should reflect their contribution to outcomes, which is a function of performance, risk and costs. Performance-based fees can improve incentives for investment managers and avoid the double-charging inherent in asset-based fees.
Regulatory efforts to increase investment cost and charges disclosure are accelerating and reporting requirements are increasingly stringent. However, policy makers might find that putting in place a limited disclosure regime and making it more stringent over time is more effective than asking providers to introduce full cost disclosure in one go.
-
Aiming for a very high level of investment cost transparency can create delays and generate new expenses.
-
Compliance rates for less rigorous disclosure regimes are likely to be higher and the amount of data will be manageable for regulators as well as providers.
-
Direct costs – especially direct investment costs – have a significant impact on outcomes and are relatively easy to identify.
Policy makers have been successful in reducing the costs and fees of pension funds in several jurisdictions through a combination of different measures to strengthen market mechanisms, restrict fee options and introduce structural changes in the overall system or at the level of the provider. These efforts could be complemented by data on the relationship between costs and outcomes offered by different funds, including performance metrics and cost comparisons, which would indicate whether individual funds have the potential to reduce costs further in order to generate better outcomes for their members and sponsors.
References
[18] Ainsworth, A. et al. (2016), “Superannuation Fund Performance and Fund Fees”, Working Paper, Vol. No. 115.
[7] APRA (2016), “Productivity Commission Issue Paper: Superannuation efficiency and competitiveness”, Submission from the Australian Prudential Regulation Authority.
[28] ASIC (2017), “Disclosing fees and costs in PDSs and periodic statements”, Regulatory Guide 97.
[26] Axa (2013), Is Big Better?, Axa Investment Managers.
[3] Ayres, I. and Q. Curtis (2015), “Beyond Diversification: The Pervasive Problem of Excessive Fees and "Dominated Funds" in 401(k) Plans”, The Yale Law Journal, Vol. 124, p. 1476.
[12] Better Finance (2017), Pension Savings - the real return.
[32] Better Finance (2016), Pension Savings - the real return.
[21] Bikker, J. (2013), “Is there an optimal pension fund size? A scale-economy analysis of administrative and investment costs”, DNB Working Paper, Vol. No. 376.
[5] Blake, D. (2014), “On the Disclosure of the Costs of Investment Management”, Pensions Institute discussion paper PI-1407.
[24] Broeders, D., A. van Oord and D. Rijsbergen (2016), “Scale economies in pension fund investments: A dissection of investment costs across asset classes”, of International Money and Finance, Vol. 67, pp. 147-171.
[11] Calderón-Colín, R., E. Domínguez and M. Schwartz (2010), “Consumer confusion: the choice of pension fund manager in Mexico”, Journal of Pension Economics & Finance , Vol. 9/1, pp. 43-74.
[15] Deloitte (2014), Inside the Structure of Defined Contribution:401(k) Plan Fees, 2013: A Study Assessing the Mechanics of the "All-In" Fee, Deloitte/ICI.
[20] Di Gialleonardo, L. and M. Marè (2015), “The Efficiecy of Italian Pension Funds: Costs, Membership, Assets”, Siep Working Paper , Vol. No. 687.
[9] DWP (2017), Pension Charges Survey 2016: Charges in defined contributuion schemes.
[25] Dyck, A. and L. Pomorski (2011), Is Bigger Better? Size and Performance in Pension Plan Management.
[29] FCA (2017), “Transaction cost disclosure in workplace pensions”, Policy Statement PS17/20.
[1] FCA (2016), Asset Management Market Study - interim report.
[2] Grattan Institute (2014), Super Sting: how to stop Australians paying too much for Superannuation.
[33] Hamdani, A. et al. (2017), “Incentive Fees and Competition in Pension Funds: Evidence from a Regulatory Experiment”, NBER Working Paper, Vol. No. 22634.
[6] Han, T. and D. Stanko (2018), “2018 Update on IOPS Work on Fees and Charges”, IOPS Working Papers on Effective Pension Supervision, Vol. Forthcoming.
[31] Harrisson, D., D. Blake and K. Dowd (2014), VfM: assessing value for money in defined contribution default funds, Cass Business School/Pensions Institute.
[23] Jennings, W. and B. Payne (2016), “Fees Eat Diversification's Lunch”, Financial Analysts Journal, Vol. 72/2.
[10] Johnson, M. (2017), The LGPS: a Lost Decade, Centre for Policy Studies.
[17] Morkoetter, S. and T. Wetzer (2016), Investment Decisions of Swiss Pension Funds, University of St. Gallen/SFAMA.
[14] OECD (2016), OECD Reviews of Pension Systems: Mexico, OECD Reviews of Pension Systems, OECD Publishing, Paris, https://doi.org/10.1787/9789264245938-en.
[19] OECD (2016), Pension Markets in Focus, http://www.oecd.org/daf/pensions/pensionmarkets.
[4] OECD (2012), “A Policy Roadmap for Defined Contribution Pensions”, in OECD Pensions Outlook 2012, OECD Publishing, Paris, https://doi.org/10.1787/9789264169401-9-en.
[13] OFT (2013), Defined contribution workplace study.
[22] Pensioen Federatie (2016), Recommendations on Administrative Costs - Revised version, Federation of Dutch Pension Funds.
[30] PPI (2016), Value for money in DC workplace pensions, Pensions Policy Institute.
[34] Productivity Commission (2017), Superannuation: Alternative Default Models - Draft Report.
[16] Ramsey, I. (2002), Disclosure of Fees and Charges in Managed Investments.
[8] Rice Warner (2014), “MySuper Fees”, Financial System Inquiry 2014.
[27] Sier, C. (2014), Pension Fund Cost and Complexity - Quick Wins, Pension PlayPen.
Notes
← 1. The focus on the chapter is on charges and costs in the accumulation phase. It does not address the pay-out phase, which deserves a full analysis in itself.
← 2. The provider’s costs include its profit margin, where applicable.
← 4. While this may be true in many circumstances, if sales increase the size of funds and scale efficiencies, there may be, in this case, benefits to members.
← 5. DC plans may also be able to access these share classes. Most DC plans in the United States, including those that are participant-directed, use lower-cost institutional plans.
← 6. Financial System Inquiry (Murray) final report, Australia.
← 7. See for example OECD/INFE International Survey of Adult Financial Literacy
← 8. Source: Financial Times, 24 August 2014
← 9. Member representation may be particularly difficult to implement in DC funds because of the individual rather than collective nature of fund membership.
← 10. The Institutional Disclosure Working Group set up by the Financial Conduct Authority has prepared voluntary templates for pension trustees to gather cost data from their suppliers.
← 11. Source: CEM Benchmarking
← 12. The TER includes explicit investment costs that are deducted directly from members’ assets and some administration costs.
← 13. Short-term investment returns could differ e.g. if a bespoke strategy included more volatile asset classes than the default.
← 14. There may be regulatory challenges in certain common law, trust-based environments where performance fees may be construed to give a fiduciary the capacity to control his own level of compensation. However such cases are not common across OECD or IOPS jurisdictions.
← 15. Chile also introduced other reforms in 2008 to help drive competition, such as the elimination of fixed fees and including comparative fee information on members’ account statements.