Chapter 1. Boosting firm dynamism and performance1
With persisting slower growth worldwide and in China, over-capacity in some heavy industry sectors, declining profitability, and intensifying competition from other, lower-cost emerging economies, corporate behaviour in China needs to change and focus more on efficiency and sustainability. This need is further intensified by mounting environmental pressures and China’s ambition for greener and more sustainable growth. A larger proportion of firms, including state-owned enterprises, should step up innovation efforts and improve corporate governance practices. To this end, supportive policies are needed, fostering an environment that is more conducive to innovation and entrepreneurship, and facilitating resource reallocation through the exit of unviable firms. At the same time, fraudulent corporate practices must be halted and State assets need to be better managed. Reforms are under way or envisaged that will help improve corporate performance and, more broadly, deliver more resilient and environmentally sustainable growth and continuing progress in living standards.
Growth has slowed both worldwide and in China. The Chinese economy continues to grow fast but over-capacity has emerged in some heavy industries and enterprise profitability has been eroding. At the same time, competition from other, lower-cost emerging economies, has been intensifying. Against this backdrop, corporate behaviour in China needs to change and to focus more on efficiency and sustainability. Instead of relentlessly seeking expansion, echoing the “growth above all” macroeconomic principle, firms should focus on how to boost productivity, which is the only way to secure growth in the long term. This calls for greater emphasis on innovation. As a share of GDP, China is already spending as much on research and development (R&D) as many OECD countries, but making the most of innovation calls for broader reforms, notably with respect to corporate governance. China has adopted many best practices in this area, but the lack of transparency and incentive distortions give rise to abusive practices such as shifting assets through related party transactions or expropriating minority shareholders. Such practices reduce firm value and overall efficiency. The announced reforms of state-owned enterprises (SOEs) will be instrumental in boosting overall firm performance given their large share in many industries. While the sweeping SOE reforms initiated in the late 1990s sharpened incentives to enhance efficiency, the SOE sector is now ripe for reforms to enhance checks and balances, improve transparency and achieve a better return on government assets.
This chapter discusses how to improve corporate performance under the above three angles, drawing as appropriate on analysis of firm-level data: first, it examines how to boost innovation activities and entrepreneurship; it then turns to corporate governance asking how to help avoid fraud and protect the interests of all the stakeholders; finally, it zooms in on the large SOE sector, which is subject to special rules, and the reforms in this area.
Coping with excess capacity in selected sectors
Adjustment towards somewhat lower but higher-quality growth urgently requires a reduction of overcapacity and a shift towards more efficient and less energy-intensive production through market-oriented mechanisms. A number of industries are affected by excess capacity, including steel, coal, cement, chemicals, machinery, shipbuilding and metallurgy. This exerts downward pressure on the overall price level as those industries supply intermediate inputs to most other sectors. It also reduces corporate profits, weighs on enterprise investment and absorbs resources that could be used more efficiently elsewhere, thereby constraining potential growth. Recent measures (Table 1.1) aim at capacity cuts in firms with high costs, tight financing conditions and high pollution as well as outdated production facilities. Measures to eliminate capacity taking into account different levels of technology, energy efficiency, emissions and other criteria, are, however, challenging to operationalise.
One organising principle of the process of cutting excess capacity is local leadership. While it creates a sense of ownership, it also slows the process, especially in the regions where excess capacity and costs are the highest. More central government support could accelerate the process in such cases. The overall employment impact of capacity reduction is expected to be modest as most of the sectors affected by overcapacity tend to be capital-intensive (OECD, 2015a). The nine major sectors with sizeable excess capacity employ around 16 million people, or about 4% of the total urban labour force. Workers made redundant with the capacity cuts are retained in the enterprise, transferred to other enterprises, offered a severance package or, as a last resort, moved onto early retirement.
In December 2015, the Central Economic Work Conference stressed the importance of cutting excess capacity as a major supply-side reform measure. Supply-side measures were expected to effectively address the issue of excess capacity, unlike demand-side measures such as the scrap-and-build subsidy in shipbuilding. However, by February 2016, when the targets for capacity reduction were announced, ambitions had been scaled back owing to concern over short-term economic growth (Table 1.1). In steel, for instance, 150 million tons of capacity is to be eliminated over 2016-20, although at end-2015 excess capacity reached 336 million tons (Center on Globalization, Governance and Competitiveness at Duke University estimate). Even though annual capacity reduction targets so far have been met, as those targets have been relatively modest, the 2016 Central Economic Work Conference reiterated the importance of cutting excess capacity as a major objective for 2017. Coal mining capacity is to be cut by 150 million tons and steel production capacity by 50 million tons. The scope of reduction of excess capacity will go beyond steel and coal in 2017. Coal power generation capacity is to be cut by 50 million kW.
Delaying the necessary adjustment to work off excess capacity by rolling over loans, persuading investors not to exercise their rights to avoid funding pressure on ailing companies or in other ways to artificially keep unviable firms afloat, will lead to a further build-up of imbalances. Moreover, despite the capacity reduction targets, declining demand for steel and demand weakness in several other sectors affected by overcapacity imply that capacity utilisation rates may not improve much in the short term. This will keep prices down and force or keep otherwise efficient private companies out of the market. Furthermore, subsidies to ailing firms impose a large burden on the budget and slow the necessary adjustment. Last but not least, keeping loss-making polluting firms afloat takes a toll on the environment.
Strengthening the role of innovation and entrepreneurship as drivers of growth
Innovation and reallocation are key for sustainable growth: new industries will emerge to meet new types of demand and traditional industries will be upgraded to produce better quality and greener goods, or phased out. The importance the Chinese government attaches to innovation is reflected in its choice of innovation as one of the five keywords for the current Five-Year Plan, alongside coordination, sharing, green development and opening up. The emphasis on innovation is not new, however, and much progress has already been achieved, as documented in the 2015 OECD Economic Survey of China (OECD, 2015d). In some respects, China still has room to catch up with the frontier. In addition to setting the main directions (Box 1.1), new initiatives have therefore been launched in 2015, notably Made in China 2025 and Internet Plus, backed up by increased public funding (Box 1.2). The major policy targets emphasise human capital, financing of innovation and technological progress. Also, more attention is being paid to quality and greening. Green technological innovation, which is being embraced by China, will lead to a better utilisation of resources and hence, to higher overall efficiency. Furthermore, innovation is to be coupled with entrepreneurship.
The 2006 Medium and Long-term Plan for Science and Technology Development set out major policy directions. In 2010, a set of seven “strategic emerging industries” was identified, whose share in GDP was to rise to 15% by 2020. In 2015, the focus broadened with the unveiling of Made in China 2025 and Internet Plus, which is more comprehensive and also puts a greater emphasis on market mechanisms. The 13th Science, Technology and Innovation Five Year New Plan was issued in August 2016 and provides more specific guidance on how to achieve the 12 targets set out by the Plan by 2020 (Table 1.2). The New Plan treats innovation as both a technological and an economic concept. It defines a tiered system for innovation, with the major cities competing in the world innovation arena, followed by indigenous innovation zones and high-tech zones, and then innovation centres with strong ability to drive regional development and finally extension of the various experiments with innovation reform.
In addition to those set in the Five Year New Plan, a number of specific targets for 2020 are being pursued. For instance, the number of professional farmers aware of modern agro-technology is to increase to 10 million. Quantifiable targets have also been set with respect to the commercialisation and transfer of science and technology outputs, with a view to increase their relevance and quality: i) establishment of 100 model technology transfer institutes; ii) supporting the creation by sub-national governments of 10 model zones for commercialisation and transfer of science and technology outputs; iii) training 10 000 technology transfer professionals; iv) reaching CNY 2 trillion worth of technology contracts.
Made in China 2025 is the first action plan specifically targeting manufacturing. It is inspired by Germany’s “Industrie 4.0” plan. To transform China into a world manufacturing power by 2025, the plan lists nine tasks: 1) improving innovation in the manufacturing sector, 2) integrating technology and industry, 3) strengthening the industrial base, 4) developing Chinese brands, 5) fostering green manufacturing, 6) continuing restructuring of the manufacturing sector, 7) promoting service-oriented manufacturing with a focus on product customisation, 8) internationalising production and 9) promoting breakthroughs in 10 key sectors. The 10 priority sectors are: 1) new advanced information technology; 2) automated machine tools and robotics; 3) aerospace and aeronautical equipment; 4) maritime equipment and high-tech shipping; 5) modern rail transport equipment; 6) new-energy vehicles and equipment; 7) power equipment; 8) agricultural equipment; 9) new materials; and 10) biopharma and advanced medical products.
For some of the priority sectors, 2020 objectives were specified. For instance, the Development Plan for the Robotics Industry 2016-20, issued in May 2016 aims at 1) larger industry scale, i.e. an annual domestic production of 100 000 industrial robots, 2) better quality, i.e. 80 000 hours mean time between failures for domestically produced industrial robots, 3) 50% or greater market share for domestic core components and 4) more widespread application of industrial robots, i.e. 150 robots per 10 000 employees.
The nine main tasks including breakthroughs in the 10 priority sectors are supposed to be market driven, but government guidance and support is provided in the form of various subsidies and accelerated depreciation. The Made in China plan also aims at achieving a 40% domestic reliance in core components and basic materials by 2020 (and 70% by 2025). This compares with the 2006 Medium and Long-term Plan target of at least 70% domestic reliance in terms of overall technology by 2020 that was achieved well ahead of time. To support the Made in China 2025 initiative, the government set up the CNY 20 billion Modern Manufacturing Industry Investment Fund, CNY 6 billion of which are allocated from the government budget.
Internet Plus seeks to integrate mobile internet, cloud computing, big data, and the Internet of Things with modern manufacturing, to encourage the healthy development of a wide array of services, and to get internet-based companies to increase their presence in the international market. The 11 priority areas where internet will be promoted include entrepreneurship/innovation, integrated manufacturing, modern agriculture, intelligent energy, internet banking and other financial services through the internet, public services, efficient distribution, e-commerce, transport, green ecology and artificial intelligence.
Smart cities and communities are envisaged to emerge as a result of Internet Plus initiative, with an increased level of digitisation and e-government services. Hospital services such as making appointments and getting the results of diagnoses online are already available in some cities. In the area of commercial services, online booking and other services are even more widespread.
Source: Guofa 2015/28 Guanyu Yinfa Zhongguo Zhizao 2015 de Tongzhi (Notice on Made in China 2025), Guofa 2015/40 Guanyu Jiji Tuijin Hulianwang Jia Xingdongde Zhidao Yijian (Guiding Opinion on Promoting Internet Plus Activities).
Progress in innovation has been impressive, but more focus on outcomes is needed
China’s gross expenditure on R&D reached just over 2% of GDP in 2014, in line with that of the EU 15 economies and well above countries with a similar level of GDP per capita such as Chile, South Africa or Turkey, but still behind major innovators such as the United States or Japan. However, research personnel, as a share of the total employed, has not kept up with R&D outlays (Figure 1.1). Research money has mostly been spent on developmental rather than on applied or basic research, consistent with a view of science emphasising development (Sun and Cao, 2014). Only 5% of the total was channelled to basic research, as against 18% in the United States (2013) and 12% in Japan (OECD, 2015f).
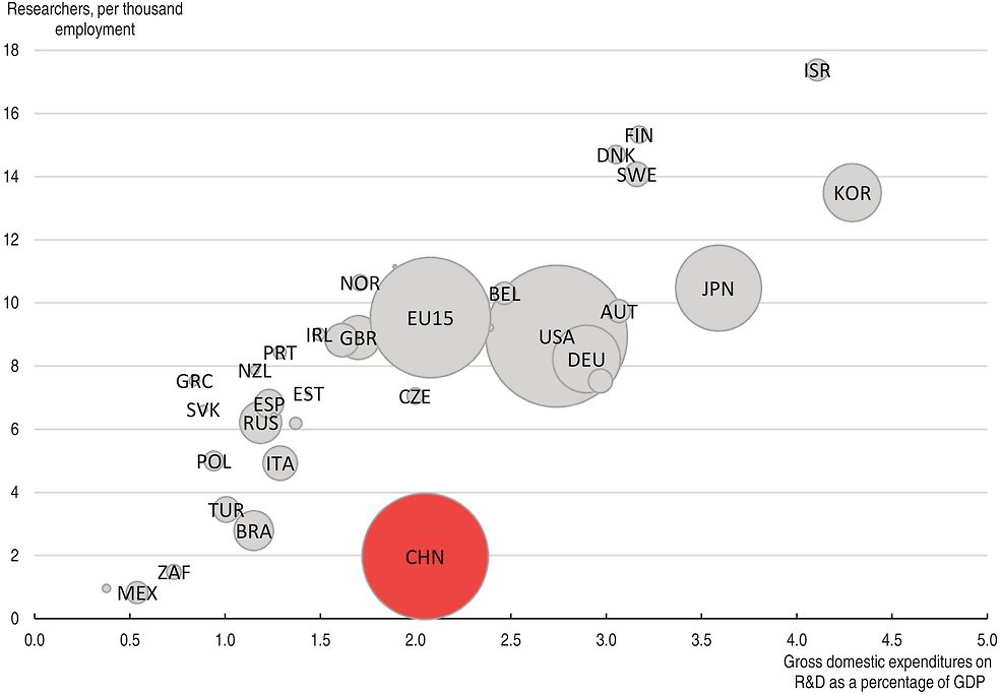
Note: The size of the bubble indicates the size of spending in absolute terms measured in 2010 USD PPP prices. In China, all people in agriculture are defined as employed, which affects total employment.
Source: OECD Main Science and Technology indicators (MSTI) database (2016).
Not only is total R&D spending as a share of GDP high in China given its level of GDP per capita, but within it the share of the business sector exceeds three-quarters (Box 1.3). Business spends more on R&D in China than in the median OECD country (Figure 1.3). It also spends more on industry-financed public R&D spending. Chinese firms have become more innovative in response to wage pressure and global opportunities (Wei et al., 2016).
Over three quarters of R&D spending in China is attributable to enterprises (Figure 1.2). Most of the R&D money firms spend is raised by them, only 4% comes from the government budget and even less from foreign and other sources. Thus, the business sector is both the main source and the main spender of R&D funds. In addition to its own spending, 3% of its total spending on research is directed to universities and 0.6% to public research institutions. Within enterprises, State-controlled firms (including enterprises of different types with absolute or relative State control) commanded a 32% share in 2014, a sharp fall from 55% in 2005.
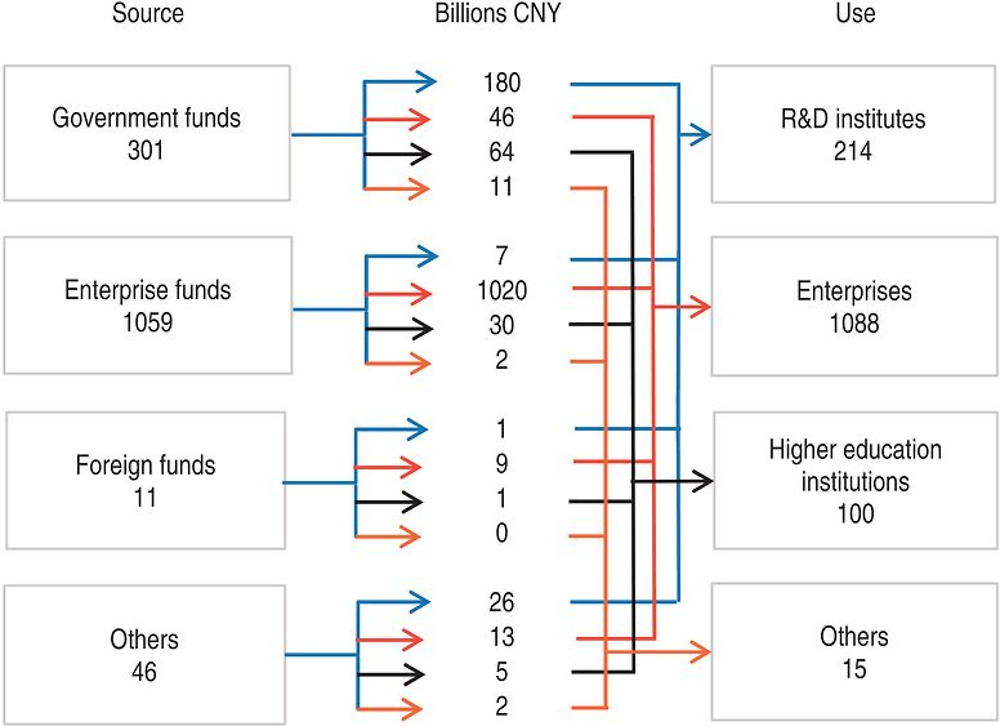
R&D institutions, mostly relying on government funding, are another key dispenser of R&D funds, though their share is less than a fifth of that of enterprises. Higher education institutions follow in importance, with spending nearly half of that of research institutions.
Public R&D spending at the central government level is disbursed to several dozens of agencies, with the Chinese Academy of Sciences, the Ministry of Science and Technology, the Natural Science Foundation, the Ministry of Agriculture, the Ministry of Industry and Information Technology and the Ministry of Education jointly commanding 35% of the total. From publicly available data, roughly half of central R&D spending is disbursed by government agencies, the other half most likely by SOEs.
Direct R&D spending, however, is not the only way the government supports research activities. Support through R&D tax incentives in China is of the same order of magnitude as direct support.
Source: Yearbook of Science Statistics, 2016 and Departmental Budgets of budgetary institutions.
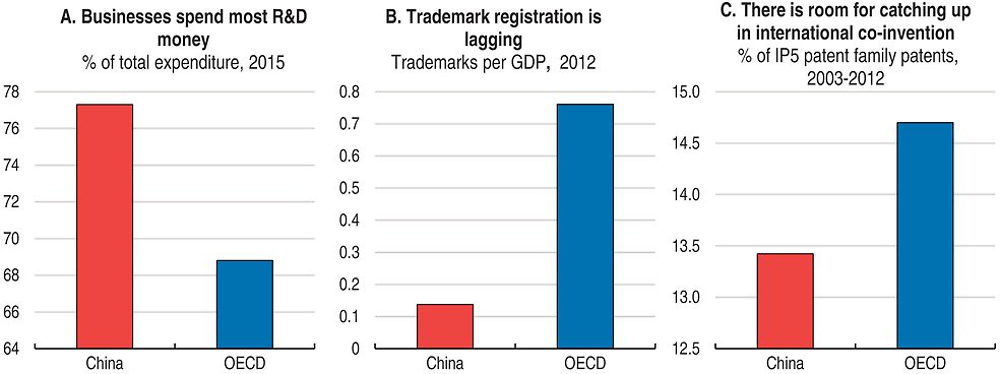
Note: IP5 patent families include patents filed at one of the five patent offices the European Patent Office, the Japan Patent Office, the Korean Intellectual Property Office, the State Intellectual Property Office of the People’s Republic of China and the United States Patent and Trademark Office (the so-called IP5), according to the earliest filing date and the applicant’s residence. IP5 patent families have at least two members, one of which is in the IP5. For further details on the definition of IP5 families see pp. 20-21 at www.oecd.org/sti/inno/World_Corporate_Top_RD_Investors_Innovation_and_IP_bundles.pdf. The number of trademarks is normalised by GDP in USD PPP to take country size into account.
Source: OECD Science, Technology and innovation Outlook (2016), based on OECD (2016), Main Science and Technology Indicators, December, www.oecd.org/sti/msti; OECD (2016), STI Micro-data Lab: Intellectual Property Database, December, http://oe.cd/ipstats.
The number of patents has increased rapidly alongside the rise in R&D spending. In absolute terms, China is a leader in patents: in 2015, its patent filings exceeded one million, making up over a third of the world’s total. In that year, China also surpassed the United States as the largest patent issuer. Moreover, China has been a frontrunner in fast-track “green” patent applications. The elasticity of patenting with respect to R&D spending, however, is small (Dang and Motohashi, 2015). Indeed, beyond R&D spending, the surge in patenting in recent years has been driven by FDI and institutional change (Hu and Jefferson, 2009), technology transfer (Lin et al., 2015) and subsidies: around a third of the increase can be ascribed to subsidisation (Dang and Motohashi, 2015).
On average, the impact on productivity of new patents has declined, though private firms appear to achieve greater productivity gains from their R&D efforts (Boeing et al., 2016). The decreasing productivity impact of soaring patenting activity is largely related to quality and relevance issues. Most Chinese patents are utility or design patents and only a smaller share are genuine inventions. Furthermore, only a fraction of Chinese patents are also registered in the United States, the European Union and Japan. On this measure, China lags behind most OECD and many emerging economies (Figure 1.4). As the 2015 OECD Economic Survey of China pointed out, the utilisation rate of university patents is low at around 5% compared to 27% in Japan (OECD, 2015d). In contrast, for firms it approaches nearly two-thirds, comparing well with other countries. A successful example of increasing utilisation is the applied laboratory for nanotechnology under the Chinese Academy of Sciences established in 2015.
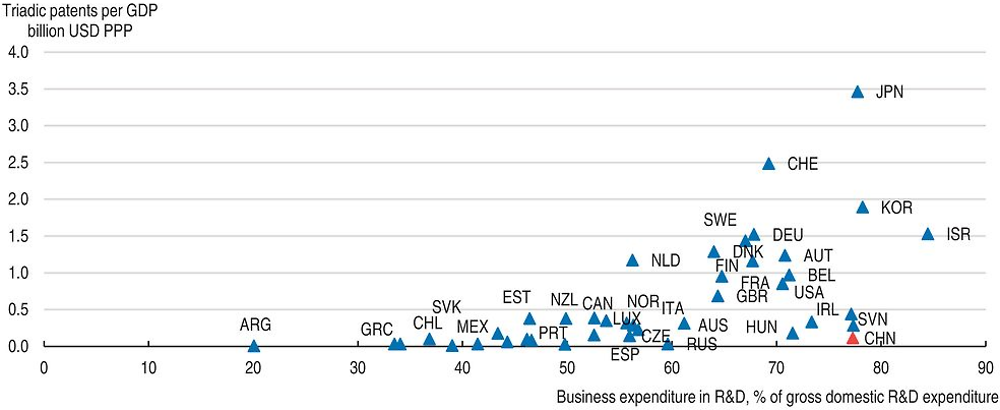
Note: R&D spending data are from 2014 or the latest available year, patent data 2013 or the latest available year. Triadic patents are those registered in the United States, the European Union and Japan.
Source: OECD calculation based on OECD Main Science and Technology Indicators (MSTI) database.
Utilisation of patents is not necessarily related to the number of registered patents in the province (Figure 1.5). Moreover, patenting or even patent utilisation is not necessarily related to enhanced productivity. Notwithstanding the large number and high utilisation of patents in Guangdong, there is no concentration of high-productivity firms there unlike in the Yangtze River delta (OECD, 2014b). This might be related to the highly concentrated holding of patents by a small number of firms without much spillover to the surrounding firms in Guangdong.
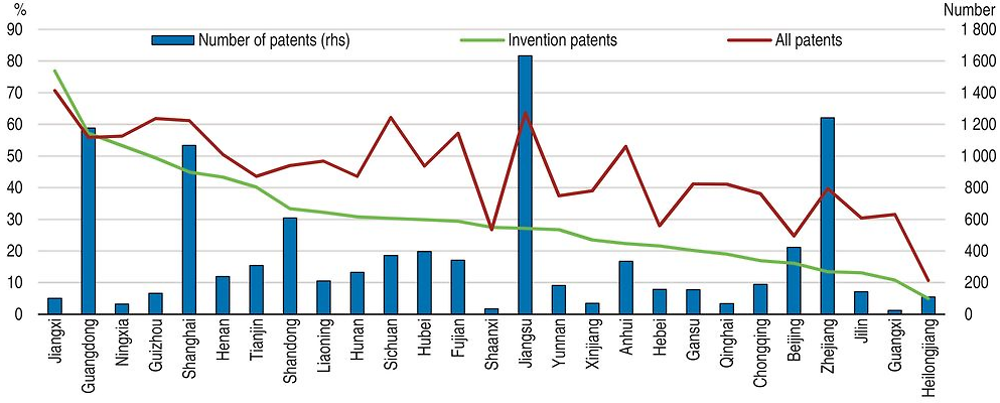
Note: The survey on which these shares are based has been conducted on a representative sample of patent holders, stratified by province. Patents include invention patents, utility patents and exterior design patents.
Source: 2014 Nian Zhongguo Zhuanli Diaocha Baogao (2014), in Chinese, 2014 China Patent Survey Report, State Intellectual Property Office.
Innovation and the diffusion of its benefits are hampered in China by limited collaboration across firms, as shown by the patent survey by the State Intellectual Property Office (SIPO, 2015) and documented in the literature (Zhao, 2015). In the Chinese ecosystem of innovation, vertical linkages or interactions with suppliers and customers are well established but horizontal linkages are more limited (Zhao, 2015). Most R&D projects are carried out by the firm alone, collaborative projects with research institutions are rare and with other firms even scarcer. This silo effect is detrimental to potential spillovers and the exploitation of complementarities across firms. The first national-level manufacturing innovation platform, established in June 2016, aims to exploit synergies and complementarities across activities and to strengthen the link between development and commercialisation.
Even though patents may be good indicators of innovation activity, not all innovations are patented. Weak protection of intellectual property rights (IPR) has hampered innovation and patenting in China. Companies often do not bother registering patents: two-thirds of them think that patent rights cannot effectively prevent others from copying their inventions. According to a country-wide representative survey of patent holders by the State Intellectual Property Office, 18% of patent owners have experienced violation of their rights, but 37% of them did not take any measure in response (SIPO, 2016). The problem is especially acute for micro-enterprises. Domestic firms are more likely not to take any measure than foreign-invested firms. According to survey respondents, violation of commercial secrets causes a greater damage to firms than that of patents, but damage related to violation of trademarks, copyrights and topographies of integrated circuits is relatively low. Over half of the firms think that better protection by patent rights would effectively stimulate innovation at firm level and 87% say that IPR protection should be strengthened. In addition to IPR protection, most firms try to: i) reap the first-mover advantage by quickly marketing their invention; ii) sign confidentiality agreements with staff; or iii) change products quickly so that competitors cannot catch up.
In addition, not all inventions are patentable and other metrics such as the share of new products or trademarks can help gauge innovation performance. New products make up over a fifth of sales in some high-tech industries, such as chemical fibres, electrical equipment or computer manufacturing (Figure 1.6). To be classified as such, products need to be fundamentally different from existing ones in function, components or technology. They can be designated as new by the Ministry of Industry and Information Technology or, only for one year, by the producer. Firms recognised as producing new products are eligible for tax reduction and support from sub-national governments. In contrast, China appears weaker on trademarks (Figure 1.3) – an indicator of non-technological innovation that is particularly relevant for services. To overcome the lack of branding in general, notwithstanding the success of some local brands, acquisition of brand names through overseas M&As has been on the rise in recent years prompting the Government to call for stronger branding and upgrading of consumer products.
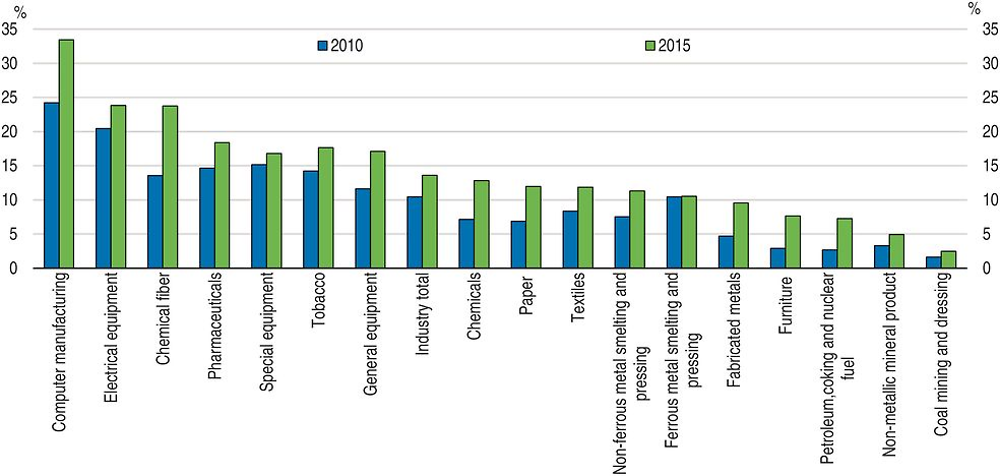
Note: New products need to be fundamentally different from existing ones in function, components or technology. They can be designated as new by the Ministry of Industry and Information Technology or, only for one year, by the producer. Industry classification follows the Chinese system.
Source: National Bureau of Statistics.
Innovation activities can be affected by corporate governance. Historically, patenting by small and medium-size enterprises has been correlated in China with enterprise ownership concentration and some corporate governance features such as the size of the board, the number of independent directors sitting on the board and whether the CEO is hired externally (Shapiro et al., 2015). Patenting activity first increases with ownership concentration as block owners care more about the company’s long-term development and therefore are more willing to invest in innovation activities. Beyond a critical threshold, however, ownership concentration appears to affect patenting negatively. This may be related to increasing risk aversion in the case of private firms as often their personal wealth is invested in the firm and they have limited options for portfolio diversification.
Policy support for innovation is becoming more comprehensive
Innovation – or more precisely science and technology – has long been considered in China as key for development and is therefore supported by a plethora of industrial policies. The innovation system has traditionally been segmented between the public and the private sector (Zhao et al., 2011). Public funding has been geared to SOEs and public research institutions, which boast remarkable scientific and technological achievements in a wide range of areas, including 3D printing, nanotechnology and robotics (OECD, 2017). Private enterprises using foreign technology, mainly in the South of the country, have relied on private funding and engage in fierce competition with each other. Also, funding has been biased towards frontier-technology projects. Researchers interested in developing new technologies in traditional industries receive scant encouragement as such research activities are not included in the national support catalogue, and are therefore not eligible for public funding.
In addition to directed government spending on projects of high importance, a number of subsidies have been extended to firms engaged in high-tech industries. The designation as high and new-technology enterprise, however, is done in differing ways across the country, creating an uneven playing field. Moreover, the 2016 revision of the definition includes more stringent standards for IP ownership implying that a global exclusive licence for over five years can no longer be the basis for obtaining high and new technology enterprise status. This would deprive many foreign high-tech firms of their existing or prospective status, as they tend to own a large part of their IP outside of China (European Chamber of Commerce, 2016). Ultimately, fewer foreign firms might choose China as a research base, potentially reducing knowledge spillovers to the domestic economy.
Subsidy policy is evolving in other ways as well. Patenting has long been enjoying generous support. Since the late 1990s, sub-national governments provide exemptions from application and/or examination fees and/or offer prizes for successful patent filers. More recently, the patent fee-exemption scheme adopted in 2006, which benefits some 70% of applicants, has been streamlined. Since September 2016, individuals with an income below CNY 3 500 per month and firms with pre-tax revenue below CNY 300 000 per year are eligible for an exemption of up to 85% of fees related to application, examination, maintenance and re-application of a patent. Subsidies at the filing and examination phase tend to be particularly harmful as the former encourage filing non-patentable or low-quality/low-value inventions and the latter hinder the filtering effect of examination fees and overload patent examiners, imposing a congestion externality on other applicants. Grant-contingent subsidies may be the least harmful, though they still boost low-value and/or low-quality patents. Streamlining patent subsidy policies could lead to higher quality and more relevant patents.
Another recent initiative is to grant company shares to technology personnel in technology-oriented SOEs to reward good performance. The specific scheme, which is still to be disclosed, should strike a balance between being sufficiently attractive to encourage better research performance and avoiding the leakage of state assets. Upon leaving the company, staff could be required to sell their shares back to the company at the prevailing market price in the case of listed firms or according to pre-determined rules if not listed.
Specialised IPR courts have been set up since 2014 in Beijing, Shanghai and Guangzhou. Together, they dealt with around 8% of all concluded IPR cases in 2015. Of the 120 000 cases, 62% were related to copyrights, 22% to trademarks, 10% to patents and the remaining 6% to technology contracts, unfair competition and other disputes (Supreme People’s Court of the PRC, 2016). Specialisation is justified on the basis of training qualified specialists for an effective handling of cases. Those specialists are expected to understand both technology and law and therefore are hard to recruit. In China, such courts are expected to strengthen IPR protection. A key difficulty experienced elsewhere, however, is that a specialised court system is more likely to lead to interest-group capture (Dourado and Tabarrok, 2015).
Like in many OECD countries, high-tech parks play an important role in nurturing innovation (Ou et al., 2014 and Sun and Liu, 2014). They numbered 146 in 2015 at the national level, accommodating over thirty thousand high-tech firms (41% of the country’s total), accounting for 32% of enterprise R&D spending and boasting 8.5 times more invention patents per employee than the national average. Some high-tech parks provide an integrated service package including technology trade, incubator guidance, international liaison and finance. For example, the Shijiazhuang high-tech park (in Hebei Province) established an administration and licensing bureau, which incorporates 151 functions of nine agencies, thereby reducing the number of stamps from 21 to a single one and economising costs. To facilitate the next upgrading, however, and to remain a major actor in the field of innovation, high-tech parks need to move from managing science and technology activities to tailoring services to the ever-evolving needs of enterprises.
The business environment needs to become more conducive to innovation
The easing of administrative burdens on start-ups and streamlining of procedures have reduced overall barriers to entrepreneurship (Figure 1.7). This has spurred business creation, which is an important source of innovation and productivity growth, and has accelerated recently as over 350 administrative procedures were either abolished or delegated to the sub-national level. In 2016, 16.5 million new business entities were registered, making up nearly 19% of all registered business entities. Nearly a third of them chose to register their business as a company, and over two-thirds as individual businesses (getihu). In 2016 there were 87 million business entities in China, a doubling in seven years. Among the newly registered companies, over 80% operate in the service sector, a slight increase from a couple of years before. Two-thirds of all new firms were registered in the Eastern region of the country, which is the most prosperous. Nevertheless, there is ample room to make the business environment more entrepreneurship-friendly.
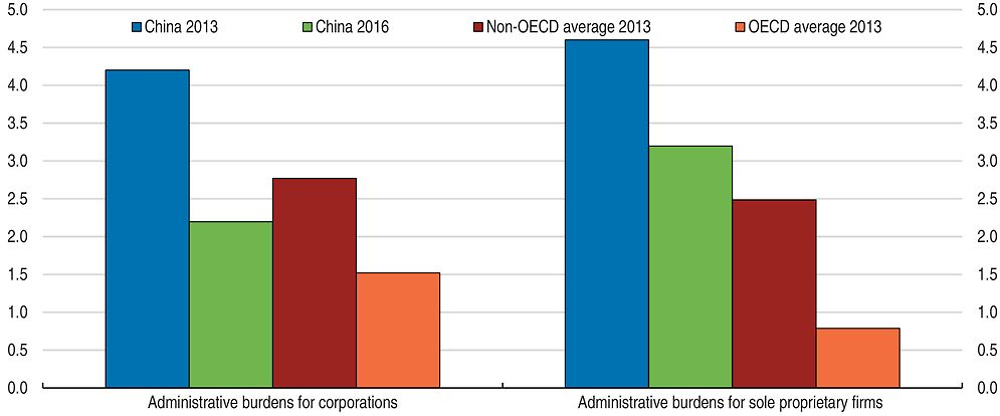
Note: The value of the indicator ranges from 0 to 6, with 6 being the most restrictive.
Source: OECD Product Market Regulation database and OECD updates for China for 2016.
Indeed, competition remains low in many sectors, particularly in network industries. In the energy sector, introducing competition, shifting towards retail prices that reflect actual costs of generating, transmitting and distributing electricity, and incorporating the environmental costs of carbon-generated energy into prices are key to enhance efficiency. Electricity price reform is being piloted with cost-plus pricing or direct negotiation between the generator, the buyer and the grid company, which should result in lower energy prices.
In sectors such as internet services, oligopolistic market conditions hinder the formation of start-ups as the platforms which are the basis for applications are owned by a few large players. Mandatory sharing of internet platforms would facilitate the commercialisation of computer applications and thus boost start-ups where entry costs are otherwise relatively low. Furthermore, internet fees are high, speed is low and consumers often have no choice of provider, as networks are not shared.
The opposite problem arises in manufacturing industries and some services sectors, such as retail or land transportation, where companies engage in cut-throat price competition rather than innovation, endangering product quality and safety. This race to the bottom often leads to counterfeiting and ignoring product safety regulations. Establishing and enforcing standards while raising consumer awareness and enhancing consumer protection would help promote fair competition, provided such efforts do not unduly raise barriers to entry.
Efforts to reduce the costs of doing business are being broadened and intensified. These reforms are welcome to ease the burden on firms facing deteriorating profitability, but there is still ample room for more extensive reforms. With the unification of licences and procedures, the list of agencies has not been exhausted: there is still some way to go to achieve a one-stop shop. A pilot programme has been introduced in Jiangxi Province to unify all the nine procedures to register a business.
To foster innovative ideas, the government is promoting mass entrepreneurship, which is meant literally: people from all social strata are encouraged to set up a business to realise their ideas. Chengdu, the capital of Sichuan Province, is a successful model for promoting innovation through entrepreneurship. Through its development plan based on innovation as a major driver, effective implementation of administrative simplification and other measures, the city managed to attract fresh graduates with new ideas. Another important factor in attracting young entrepreneurs is the city’s reputation as an IPR protection model city. As a result, innovation and start-ups are thriving with a survival rate of 70-80% after one year. Civil servants, university teaching staff and students can leave their positions to do business for a couple of years with a return guarantee. This possibility is not taken up much, however, because such an absence reduces promotion chances in the administration or academia. Migrant workers are encouraged to return to their homes to start a business and spread knowledge gained during their city life. The Internet Plus programme will be key in driving this return of migrants bringing e-commerce into rural areas and establishing 200 model counties for integrated provision of distribution services at the county, township and village levels. People willing to return to the countryside and set up a business will enjoy an opportunity to participate in training at least once by 2020 and be exempt from or subject to reduced taxes, surcharges and contributions.
The “New Normal”, with lower overall growth and corporate profits, can improve the funding environment for start-ups insofar as investors seeking high returns now need to invest at an earlier stage than in the past. Indeed, in 2015, funding at the seed and early development stages accounted for around 55% of all investment, an 11 percentage-point increase relative to 2013. In addition, the increasing number of high net-wealth individuals makes for a growing pool of potential domestic venture capitalists, reducing the need for foreign or state-backed funding of new ideas. These investors appear to be diversifying their portfolios sectorally (though internet services remain the favoured target) and geographically (Box 1.4).
Although angel investment is relatively nascent in China, some sectors, such as internet services, telecommunications, and other IT-related activities have attracted sizeable funds. In 2015, the internet service sector commanded half of all angel investment at CNY 5.1 billion, followed by telecommunications with a 16% share and IT with a share of 8%. While internet services have remained a major destination, the past years saw diversification within this sector with internet finance, online travel services, online catering services and online-to-offline boasting the largest amounts of investment. These industries are characterised by small-scale, rapid growth and bright potential – ideal features for angel investors.
Although two-thirds of angel investment is still channelled to the three cities of Beijing, Shanghai and Shenzhen, government guidance helped to attract an increasing number of angel investors and amount of funds to Zhejiang and Guangdong provinces. In addition, the ever-fiercer competition among investors in the coastal areas provided a chance to entrepreneurs with ideas in inland provinces to realise them and provinces like Sichuan and Shaanxi have become vibrant centres of innovation in the West.
Source: NDRC (2016), 2015 Nian Zhongguo Dazhong Chuangxin Wanzhong Chuangye Baogao (2015 China Entrepreneurship and Innovation Report).
The steps taken to facilitate firm creation need to be accompanied by measures to ensure that unviable firms exit the market. By 2013, around half of all steel mills and nearly half of all developers were making losses but could still obtain loans, or were unable to discharge their interest payment obligations (National Academy of Development and Strategy of Renmin University, 2016). OECD research shows (Adelet McGowan et al., 2017) that zombie-firms aggravate capital misallocation and by preventing more efficient firms from expanding, also drag down productivity. Major impediments to bankruptcy initiation include the lack of a feasible and acceptable worker compensation plan and resistance at the local level. The length and high degree of uncertainty associated with the bankruptcy procedure may also discourage firm managers from choosing this form of exit (Box 1.5). Firms that are able to obtain new bank loans (or roll over existing loans) notwithstanding their balance sheets and the size of their debt, or those that can cover their liabilities with their assets, notwithstanding their loss-making record and prospects, do not meet the conditions and therefore cannot apply for bankruptcy. Moreover, publicly-owned firms can only apply for bankruptcy if their asset managers agree. Agricultural producers and private entrepreneurs do not need to apply, but can choose to follow the rules of the bankruptcy procedure if they wish to do so.
The current Bankruptcy Law, adopted in 2006, applies to all entities with a legal-person status. The Law specifies the conditions for bankruptcy, which include a high debt level and little prospect for its repayment as well as a worker compensation plan. Either the company or its creditor can file for insolvency; in the former case the requirements in terms of documents are slightly more stringent. Once either side has filed for bankruptcy, the court examines whether the conditions are met and whether the documents are valid. At the time of filing it needs to be specified whether it is for liquidation or reorganisation, but that classification can change during the process. For instance, if a company filed for liquidation but during the process it records a positive valuation effect for its assets, it will be considered for reorganisation. By the same token, a company seeking reorganisation may end up being liquidated if no feasible restructuring plan can be devised.
If the court judges that the firm meets the requirement for bankruptcy, it appoints an insolvency practitioner to manage the company throughout the process. The court draws on a pool of accountancy and law firms as well as specialised bankruptcy professionals, from which it randomly assigns one. The practitioner then acts according to the decision of the creditors’ committee whether to keep production going or to lay off staff. For production purposes, the company can take up new loans. In the case of liquidation, when it comes to the distribution of the proceeds of the sale of the debtor’s assets, expenses of the bankruptcy procedure enjoy priority, followed by wages, social security and loans for operational purposes during the procedure, then by tax liabilities, and secured and unsecured creditors. While collateralised debt needs to be honoured before unsecured liabilities, if debt of higher priority such as costs of the bankruptcy procedure or unpaid wages is large enough, creditors may not be able to get hold of the collateral. The sale of assets must be through auction by a professional company, except when all creditors agree to the price of the assets, in which case they can be directly sold without auctioning. The proceeds are then distributed proportionately to the recognised claims.
Source: Enterprise Bankruptcy Law of the People’s Republic of China, available at www.npc.gov.cn/englishnpc/Law/2008-01/02/content_1388019.htm, accessed on 28 June 2016.
At the time of its enactment the new Bankruptcy Law was considered progressive and well-suited to the increasingly market-based economy. However, China’s economy has undergone significant changes since then, and bankruptcy legislation needs to keep up, particularly as regards conditions for bankruptcy and law coverage. Compensation plans for workers should not be a condition for filing bankruptcy. Instead, workers should be compensated according to relevant laws. Financial institutions are still not covered by bankruptcy legislation and their insolvency process follows ad hoc rules. The 2015 OECD Economic Survey of China recommended that before full liberalisation of interest rates, a deposit insurance system and an exit mechanism be put in place. The latter is still pending. The legislation makes it possible to convert a liquidation case into a reorganisation one if creditors, who control the insolvency practitioner, wish to do so. Creditors may be demotivated by the fear of increased non-performing loans in case of liquidation of their client or by uncertainty related to the insolvency procedure. Uncertainty needs to be reduced by setting clear and reasonably short deadlines for each stage in the insolvency procedure. A major obstacle to getting rid of public zombie companies is the obstruction of the insolvency process by the insolvency manager for fear of state asset embezzlement. The ongoing reform aiming at specialisation of the industry by establishing bankruptcy divisions in intermediate courts in provincial capitals and No. 2 cities in provinces will likely increase the efficiency of case handling. Shenzhen has been a pilot and by July 2016 15 provinces had introduced this new system with nationwide coverage expected by end-year. A simplified procedure for micro- or small enterprises would also work in the same direction.
Building a more robust corporate governance framework
With slowing overall growth and a still sizeable productivity gap vis-à-vis the advanced countries a crucial question is what corporate governance arrangements can enhance efficiency and support economic growth. Effective corporate governance builds confidence in capital markets, which remain underdeveloped in China (Figure 1.8), and enhances trust in business transactions. Furthermore, good corporate governance can encourage socially and environmentally responsible behaviour on the part of firms and make it easier for foreign firms to operate in China.
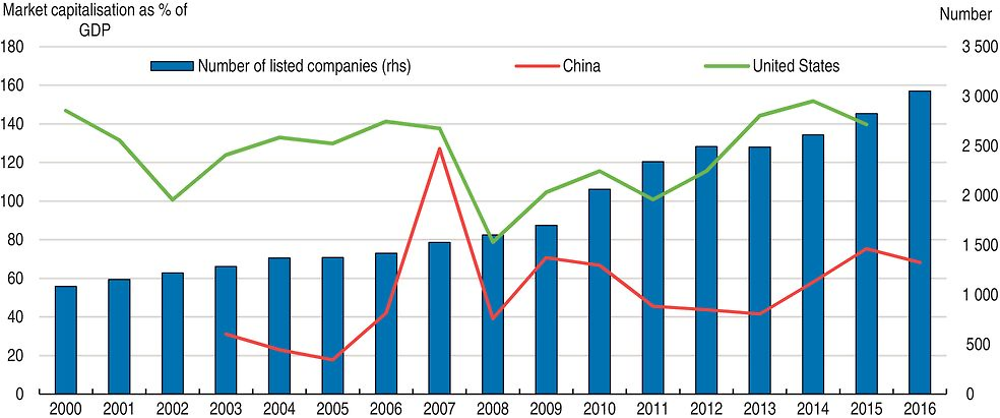
Note: Data for China refer to A shares in Shanghai and Shenzhen.
Source: CEIC and World Bank World Development Indicators database.
Streamlining the institutional framework would boost performance
China’s legal regime governing securities markets encompasses international good practices to mitigate the principal-agent problem related to asymmetric information between shareholders and managers. In addition to the Securities Law (2005) and the Company Law (2005), listed companies must also comply with guidelines and regulations of the China Securities Regulatory Commission (CSRC). However, there appears to be a gap between the law “in the books” and the law “in action” (Miles and He, 2005; Yang, 2005; Zhou, 2014). Another oft-cited weakness of the legal regime governing securities markets is inefficient (minority) shareholder protection rules (Zhou, 2014).
Both weaknesses are mainly related to weak institutional settings, in particular the lack of court independence and of expertise on the part of judges. On both fronts, recent reforms have brought about significant changes. Judges are now better qualified, partly owing to the requirements to have at least two years of experience working in law and to have a bachelor’s degree or a joint law degree as prescribed in the 2001 Judges Law. Also, a recent pick-up in litigations has been increasingly exposing judges to real-life challenges of the corporate world. Following the Third Plenum of the 18th Central Committee of the Communist Party of China, pilot provinces were designated to experiment with reforming the appointment system of judges and paving a professional career path for them (instead of making judges part of the general civil service system as before) as well as lifting the financing responsibility of courts to the provincial level (so that the possibility of local interference in the courts’ work is reduced). The reforms have increased the number of cases concluded per judge by as much as two to four times as in the case of Guizhou Province (Supreme People’s Court of the PRC, 2016). Moreover, judges now take lifelong responsibility for the outcome of the cases they hear. All these measures are expected to strengthen court independence and enhance the effectiveness and efficiency of the system.
As securities markets in China are governed by strong administrative regulations, public enforcement through the exercise of State power comes first, followed by private enforcement through litigation. There is little role for private-monitoring market mechanisms. CSRC is not only the regulator but also the supervisor and is in charge of enforcement. A major function of CSRC as the regulator of securities markets is its authority over disclosure of information by listing or listed companies. In addition, it can grant or refuse permission for public share offerings and can punish violators of securities laws and regulations. Although CSRC cannot take violators to criminal court, it can freeze or seal accounts with the approval of the State Council. Furthermore, CSRC regulates stock exchanges including appointing their managers and nominating their chairperson.
The recent decision to shift initial public offerings (IPOs) from an approval to a registration-based system facilitates listing and is aimed at promoting direct financing through the equity market (OECD, 2015c). The new system is expected to increase efficiency. It will, however, be applied gradually so as not to hurt the market as over 700 IPOs are in the pipeline. Full information disclosure to investors is required since March 2016 as part of this transition, where regulatory focus shifts from approval before the IPO to supervision during/after the IPO. Market forces will be given an increasing role in supervision. However, some types of information, like environmental performance, are disclosed on a voluntary basis. For 2014, only a quarter of listed firms chose to publish their environment-related information.
Another important ingredient of the transition is a sound delisting mechanism. Some companies have started to be delisted, but this remains very rare. In the past, failure to meet profitability requirements was the main reason for delisting, but recently a shell company was delisted on the grounds of information disclosure violations, potentially signalling the end of the shell company golden age. Indeed, regulations on back-door listing (when a privately-held company that may not qualify for an IPO purchases a publicly-traded company) have become tighter since July 2016, including with the introduction of an obligation to hold a news conference and accept public supervision before the resumption of share trading plus on-site inspection by the regulator. Also, companies having violated environmental rules and regulations over the past three years are no longer allowed to sell shares through IPOs. Environmental approval, however, is no longer required since October 2014 for companies wishing to sell shares through IPOs.
China’s corporate governance framework, which applies to listed companies, has evolved since its Code using the OECD Principles of Corporate Governance as a reference was adopted in 2002 (OECD, 2011). Only certain regulations concerning internal control, independent directors and information disclosure have been amended since and the Code is now ripe for a revision. The CSRC is currently undertaking a systematic review of the system governing listed firms aiming at enhancing the system’s ability to address corporate governance problems while ensuring consistency between relevant laws and regulations. The CSRC requires listed companies to include certain types of information in their articles of association, for instance the powers of independent directors. The CSRC is empowered to verify the articles of association of companies seeking listing, but it is less clear how to force already listed firms to amend their articles of association to ensure conformity with CSRC-designated principles, though experience shows that so far there has not been any problem with compliance (OECD, 2014c). Moreover, as the CSRC does not directly enforce those articles of association, it is hard to guarantee that the required corporate governance norms are implemented even if they are included in the foundation documents of the company. The enforcement mechanism for the articles of association would be private litigation, but the effectiveness of such action may be hindered by two factors: i) local judicial protectionism may hinder private litigation as judges have long been appointed by and loyal to sub-national governments and plaintiffs normally must sue in the court of the defendant’s domicile; and ii) if private litigation is based on the Securities Law 2005, it is often conditional on official punishment by the CSRC or another government agency.
Stock exchanges may also have corporate governance rules. For example, the Shanghai Stock Exchange does on training of independent directors or the conduct of Board of Directors’ meetings. The exchange is then in charge of enforcing those rules, but the conduct leading to one of the four possible sanctions (oral warning, letter of oversight, criticism notices and public criticism) is not made public. While public naming and shaming may be effective, keeping the motive confidential diminishes its impact on prospective violators. Stock exchanges can initiate investigations whether listed firms follow laws and regulations, but need to entrust the local branch of the CSRC in case on-sight examination is needed.
Strengthening external monitoring and internal control would improve outcomes
Corporate governance practices are being strengthened by enhancing both external monitoring and internal control. The self-regulatory body, the China Association for Public Companies (CAPCO), established in 2012 and representing 65% of listed companies (85% by market capitalisation), has put forward six areas in which to improve corporate governance: independent directors; boards of directors; external audit and internal control; institutional investors; controlling shareholders; and listed company supervision.
All listed firms need to have a board of directors as well as a board of supervisors, which is instrumental in protecting minority shareholders’ rights. What is even more important is the quality of board members. Recruiting competent and experienced board members is a major challenge for listed firms in China as the history of corporate governance is relatively short, even on paper and a fortiori on the ground.
Almost all companies choose to have only the minimum number/share of independent directors required by law (Figure 1.9) and very few decide to have more, not recognising the potential benefits of having additional external experts sitting on the board (OECD, 2013). This may be because the marginal cost of having an extra independent director (including remuneration as well as information acquisition and communication costs) exceeds the marginal benefit (monitoring and advice). Moreover, as independent directors may not be truly independent, they may not be able to provide the monitoring and advice sought by shareholders. Data on independent directors’ votes show that they rarely vote against the board, indicating that they indeed do not have the time or courage to engage on behalf of all shareholders (Ye et al., 2011). In addition, whistleblowers – be they independent directors or anyone inside the firm noticing unlawful practices – lack legal protection. Remedying this would help uncover more cases and serve as a disciplining device. Furthermore, independent directors tend to sit on too many boards, making effective monitoring and advising very difficult. The usefulness of independent directors is confirmed by the appointment of such directors by non-listed firms, which are not required to have any (OECD, 2015b and Shapiro et al., 2015).
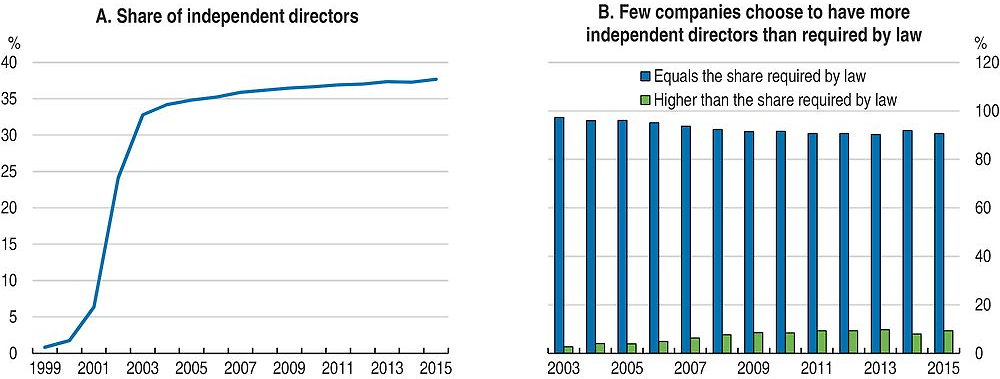
Note: Listed firms include both state-owned and private companies.
Source: OECD calculations from the CSMAR database.
While ownership concentration has declined over the past decade, in particular as a result of the 2005 split share-structure reform, which aimed at making previously non-tradable shares tradable (see below), it remains high (Figure 1.10). The biggest shareholder owns at least a third of the shares in half of the listed firms and more than half in nearly a fifth. As noted above, beyond a certain threshold, the performance of listed firms is negatively related to ownership concentration (Shapiro et al., 2015). While large shareholders tend to monitor better and ownership concentration reduces the free-rider problem of many dispersed shareholders, control rights are more readily abused when there are too few shareholders. Moreover, coordination and consensus building among several large shareholders may be costly. The Chinese Code of Corporate Governance advocates a “reasonably balanced shareholding” structure (Article 1, Chapter 2), which can be interpreted as several large shareholders, mid-way between overly dispersed and overly concentrated ownership.

Source: OECD calculation from the CSMAR database.
Protecting minority shareholders from expropriation is an acute problem given the highly concentrated ownership of listed firms. Since the establishment of the stock exchanges in the early 1990s, controlling shareholders have used myriads of ways to siphon large amounts of funds from their firms. A typical way is to “borrow” money from the company and book it under other receivables. Banning such company lending was ineffective until the State Council put forward the possibility of punishment, followed by arrests (Jiang and Kim, 2015). Tunnelling or shifting assets has often been done through non-operational fund occupancy (NOFO) whereby controlling shareholders or related companies take funds away from listed firms without matching business transactions (Jiang et al., 2015). Since 2006, the board chairperson is personally responsible for the firm’s NOFO disclosure. Accounting regulations pertaining to related-party transactions have been strengthened. Moreover, the Chinese Code of Corporate Governance requires disclosure of related-party transactions and fair pricing and the major task of independent directors is to monitor controlling shareholders. That is why they are not only barred from any position in the company, but they also have to be independent from majority shareholders (OECD, 2015b).
In advanced economies, board members, key executives and in some cases controlling shareholders have an obligation to disclose any potential conflict of interest they may face in their judgement with respect to decisions affecting the company (OECD, 2015b). In China also, the corporate governance framework should ensure appropriate checks and balance, including that all related parties are properly identified and the nature and amount of material related party transactions disclosed. One possibility is to oblige the beneficiary to inform the board about the transaction. Internal control systems covering financial and the use of corporate assets should be strengthened including by more stringent supervision by the board.
Recent empirical evidence points to the role foreign institutional investors can play in addressing the problem of wealth appropriation by controlling shareholders (OECD, 2015b, Chapter 3; and Huang and Zhu, 2015). Institutional investors can provide stability to the market as they tend to look at longer time horizons. Indeed, on average they hold stock more than three times longer than individual investors. Foreign institutional investors can have a positive impact on corporate governance to the extent that they are more likely to participate in arm’s-length negotiation and monitoring (Huang and Zhu, 2015). To enhance market stability, activism and oversight, the government has long fostered the development of institutional investors. In 1998 the first closed-end fund was established, followed by open-end mutual funds and index funds. As of 2015, professional institutional investors held slightly less than 7% of tradable shares (Box 1.6), while 52% was owned by the state and legal persons (often called “ordinary” institutional investors), leaving around 42% for individual investors. Original research undertaken for the Survey shows that institutional investors boost firm performance (Molnar et al., 2017).
Although under the 2005 Company Law (Article 132) listed companies have only common shares, those shares can be distinguished by owner type: i) state shares, retained by the state in an IPO; ii) legal person shares, owned by legal entities, which can be companies, financial institutions, or even government bodies; iii) public shares, owned by individuals or foreign or domestic institutions. The first two types of shares used to be non-tradable, and state shares can only be owned by state bodies. The purpose of non-tradable shares was to retain control over firms and about two-thirds of shares were non-tradable. Legal-person shares cannot be traded on the market, but can be sold to other legal persons as long as the stock exchange listing the company agrees.
To reduce the distortions stemming from large blocks of non-tradable shares, a split-share structure reform was rolled out in 2005 to reclassify non-tradable shares as tradable. Distortions can relate to incentive conflicts between owners of tradable shares and non-tradable shareholders: as holders of non-tradable shares did not benefit from share price appreciation, they had little incentives to maximise share value (Jiang and Kim, 2015). This conversion would dilute the value of tradable shares and therefore holders of such shares negotiated compensation with non-tradable shareholders. The process was completed by most listed firms by 2006, but technically a large portion of shares are still not traded (Figure 1.11). Those shares are officially called “restricted” and will eventually become tradable. Restrictions on trading can relate to IPOs, where the listing firm commits not to trade its shares for two or three years or to mergers and acquisitions, in addition to the 2005 split-share reform. Tradability however does not mean actual trading as the State or even some legal persons may wish to hold on to their shares even after they become tradable.
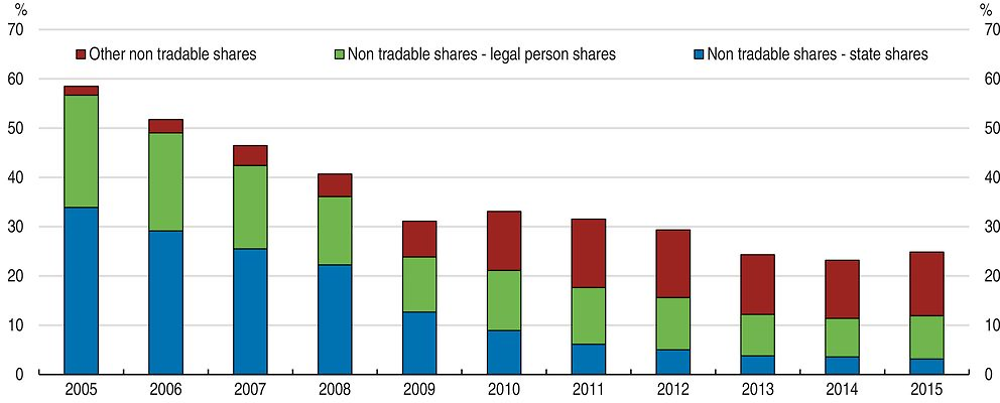
Note: As defined by the China Securities Regulatory Commission.
Source: CSMAR database.
Market-based mechanisms are playing an increasing role economy-wide, including determining executive pay. While high remuneration of executives may create strong incentives to deliver at one’s best to be promoted and boost company performance, greater pay disparity between executives and other staff may alienate workers and thus lower productivity (Firth et al., 2015). In addition to salaries, incentive mechanisms may also include distributing shares to executives (and less often, to staff). While shareholding by executives increased sharply in the late 2000s in listed firms of different ownership types, as of 2015, around one-eighth of private firms’ executives owned shares in the company they managed, while this share was less than 0.5% among listed SOEs (Figure 1.12).

Note: Executives are the top five people in the company.
Source: CSMAR database.
External audit is one area where CAPCO is pushing for improved corporate governance. Lack of audit independence, a shortage of qualified auditors and widespread corruption (Zhou, 2014) hinder the effectiveness of the audit market. To overcome the lack of qualified auditors and improve audit quality, most listed firms use foreign auditing company services.
Taking the state-owned enterprises to market
Following the reform wave in the late 1990s, many SOEs were closed down and merged, and tens of millions of workers laid off. This efficiency-oriented process stalled in the mid-2000s when, in an attempt to counteract the impact of the Global Financial Crisis, the government engaged in large-scale stimulus, a big part of which was channelled through SOEs. This is often characterised as “public in, private out”. Following the large-scale clean-up in the early 2000s, most large central SOEs are highly productive and profitable (OECD, 2015d), thereby reducing the pressure to further reform. As documented in the 2015 OECD Economic Survey of China, SOEs are dominant not only in natural monopolies such as network sectors, but also have significant market share in many inherently competitive industries such as construction, retail and wholesale trade or hotels and restaurants. More recently, an increasing number of SOEs have been venturing overseas, posing additional challenges to managing State assets (OECD, 2016b). SOEs can belong to different government levels and their supervision is also split across the State Asset Supervisory Administrative Commission (SASAC), the Ministry of Finance (MoF), their local arms and other government agencies (Box 1.7).
Chinese SOEs vary widely by size, ownership structure, supervision and other characteristics. In total, there are around 167 000 SOEs (as of 2015) but when referring to SOEs, observers often talk about the 100 or so central government-owned enterprise groups supervised by SASAC. These include most of the mammoth SOE groups in monopolistic and oligopolistic industries. Around a fifth of Fortune 500 enterprises are from China, among which most are SOEs and most controlled by SASAC (Table 1.3). Central SOE groups managed by SASAC are often large conglomerates consisting of hundreds or sometimes even over a thousand firms. Those slow in reforming have up to dozens of public service institutions within the conglomerate.
However, not all SOEs are managed by SASAC. One specific group of central SOEs include around 100 culture-related enterprise groups such as publishing houses and press/media groups operating in oligopolistic markets and their assets are managed by the MoF. There are also three unique mammoths, the China Tobacco, China Posts and China Railways, each alone representing a whole industry. MoF exercises ownership control in the case of the latter two on behalf of the State Council. The Huijin Corporation manages all centrally-owned stand-alone financial firms on behalf of the MoF. In addition there are finance companies in the SOE groups, which are managed by their respective groups. Several government agencies also operate enterprises, which comprise an additional type of SOEs. They are even more opaque than other SOEs as they are supervised by their respective agencies. Furthermore, local governments also own enterprises represented by local SASACs. Local financial institutions owned by local governments are sometimes supervised by local SASACs, sometimes by local finance bureaus. All major SOE group types can control listed firms. In 2015, those supervised by SASAC controlled 388 and their listed assets made up 61% of the total, while their listed firms’ profit share amounted to 76%.
Source: Ministry of Finance and sub-national Finance Bureaus.
Against this backdrop, SOE debt soared in recent years and now makes up around 70% of total corporate debt (Figure 1.13, Panel A), which at around 170% of GDP in 2015 is higher than in any large OECD economy. Firms in industries suffering from excess capacity display high leverage, in particular in real estate, building materials and metals (Panel B). Leverage is a bit lower in utilities (Panel C). SOEs controlled by central government agencies saw a very sharp increase in leverage during the Global Financial Crisis (Panel D). Indeed, they served as vehicles of the large-scale stimulus to hold up growth. Central SOEs under SASAC also experienced a significant increase in leverage around the same time and for the same reasons.
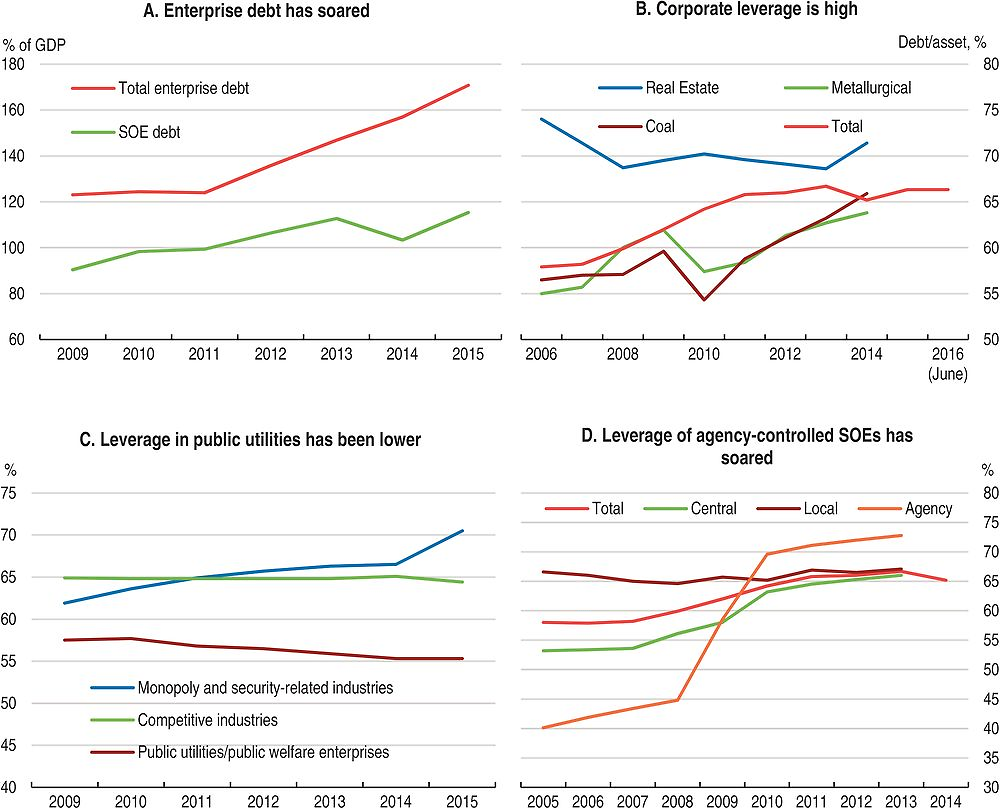
Note: Panel A shows corporate debt as a percentage of GDP and Panels B, C and D corporate leverage defined as debt-to-asset ratio. In Panel C, competitive industries include most sectors with competitive markets (shangye yilei or jingzhengxing), monopoly and security-related industries refer to industries with monopolistic or oligopolistic markets and industries related to national security (shangye erlei or longduan) and public utilities/public welfare enterprises primarily pursue public policy objectives (gongyilei or gongyixing). In Panel D, Central refers to SOEs under SASAC, local to those under local SASACs and agency to SOEs under other government agencies.
Source: BIS database, State Asset Supervisory Administrative Commission and Ministry of Finance (2014, 2015).
The current wave of SOE reforms needs to focus on enhancing efficiency
SOE reform became a priority again at the Third Plenum in November 2013 with the aim to boost their competitiveness and profitability. The Guidelines on Deepening SOE Reforms released in September 2015 define six priority areas for reform: i) mixed ownership; ii) transitioning to a modern enterprise system; iii) professional management; iv) classifying firms according to their nature; v) strengthening supervision to avoid loss of state assets; and vi) better managing state assets with a focus on capital management. A year after the adoption of the Guidelines, progress has been uneven, partly related to how difficult or controversial reform measures appeared but also to which agency manages the firm.
Mixed ownership reform has been quite successful with 68% of SASAC-controlled central SOEs having introduced non-State owners by end-2015 (Xiao, 2016). Sub-national governments also came up with plans to restructure SOEs through mixed ownership reform, but progress at agency-controlled SOEs has been much slower. SOEs in fully competitive sectors pioneer the process. Mixed ownership is achieved in various ways: restructuring, IPO, introduction of a strategic investor, conversion of part of the State-owned shares into preferred shares or employee share ownership. Technology-seeking acquisition of private firms with a share offer to the private owner in exchange is another, less common, example. Opening up ownership often needs to be preceded by improvements in transparency, corporate governance and returns to shareholders as private firms would otherwise have little interest in injecting funds into SOEs. While only a small portion of the shares is typically transferred to private owners, mixed ownership makes an important difference by bringing in an additional monitor. A private owner may not be able to prevent the expropriation of wealth from minority shareholders and tunnelling, but at a minimum can enhance transparency. With such monitoring, the value of state assets is more likely to be preserved and grown. Experience of OECD countries, however, shows that the pressure private owners are able to exert depends on the extent to which their rights are protected and enforced (OECD, 2016a).
The current Chinese notion of a modern enterprise system includes separation of business from politics, corporatisation, establishing a board, managing executives by type and level of enterprise and choosing a remuneration system that fits the country’s economic system (SASAC Research Centre, 2016). A major link between business and politics is the appointment system and the intertwined career paths in the public administration and the SOE system (Box 1.8), where progress has so far been modest. In the area of corporatisation, in contrast, progress is tangible: over 80% of SOEs have been corporatised and have set up or are in the process of setting up a board. Reforming SOEs under the MoF is slower as some represent entire industries.
Governance of centrally-owned SOE groups under SASAC broadly follows four patterns in terms of separation of Party Secretary, Chair of the Board and CEO functions: i) the Chair of the Board is also the Party Secretary, and the CEO is also Vice Chair or Deputy Party Secretary – this is the most common arrangement; ii) the CEO is also the Party Secretary in enterprises not yet corporatised; iii) the Chair of the Board, the CEO and the Party Secretary are three different people – this is rare; and iv) all the three functions are held by a single person – this is also very rare.
Among the 100+ centrally-owned SOE groups, the No. 1 executive of the top 51 is appointed by the Central Party Organisation and the deputies by SASAC. SASAC also appoints the top executives of the remaining central SOEs with approval from the State Council Party Committee. The heads of the top 15 financial institutions are appointed by the Central Party Organisation, those of the remaining 12 by the respective specialised agency such as the CSRC or the China Insurance Regulatory Commission. The Party also appoints the top leaders for China Railways, China Tobacco or China Post. Also for China Publishing the Party appoints the leader, while the Central Propaganda Department is in charge of choosing the second in command.
The key SOEs’ top managers have a rank equivalent to a Vice Minister in the government administration or even hold ministerial rank (in the case of China Railways, for instance). Mobility between government and SOEs also confirms this administrative hierarchy in the SOE sector. Most common is to move from a bureau head or deputy bureau head to a No. 2 position in the top 51 firms. Less common is to move from minister level or SASAC bureau head level to a No. 1 position in firms other than the top 51. In the other direction, most common is for mid-level managers in first-tier SOEs or heads of second-tier SOEs to become bureau heads in the administration.
Source: Various issues of Guozi Bao (State Asset Journal).
Sometimes SOE managers appear to fare worse than their private peers in profit maximisation or raising the market value of the firm but those may not be their primary goals, which may include public policy objectives. The principal-agent problem is more complex at SOEs. In the case of private firms, management is the only agent to shareholders (although in China there are few purely private firms and most of the large ones also have large public sector shareholders, where the principle-agent problem is more complex). For SOEs instead, government officials, acting as the principal to the management team, are also agents of the owner – the State, which in turn, exercises ownership on behalf of the general public. Moreover, as in the case of private firms, information asymmetry, conflicts of interest and mismatched obligations allow agents (i.e. the management) to pursue their own interest such as personal benefits or perks, rather than those of the principal (i.e. the State). The complex nature of the principal-agent problem at SOEs complicates some of the usual corporate governance issues. The “other people’s money” problem may be more pronounced, as appointed managers often have little stake in the corporations they manage. To mitigate the problem, under the new incentive mechanism, top executives can be rewarded for their performance in the form of company shares. The entrenchment problem is also prevalent as executives are rarely removed for bad performance. Moving towards a professional management system, which is underway, can help address this issue.
New regulations for senior executive compensation are being introduced and performance-based incentive plans will be put forward. SOEs enjoy large discretion in setting executive salaries. In addition to the base salary, part of executives’ salary is based on annual performance and a third part is paid upon the end of the term. Some central SOEs link only a negligible part of the salary to performance, and others most of it. The salary differences related to performance vary considerably. While some firms tolerate only a 5-10% difference in salaries owing to performance, on average, a variation of around 50% appears to be common. Differences among executive salaries at various enterprises are much larger as a result of linking salaries to firm performance. To mitigate social issues related to high salary differences, the government has capped executive salaries at 20 times the average staff salary.
Tunnelling or transferring assets across firms is common as corporate holdings often consist of hundreds of firms and managers in control can move assets across affiliated firms. Listing the company at the level of a corporate group can be a way of mitigating the tunnelling problem as higher disclosure requirements and monitoring would make it harder to shift assets across listed firms. Even before listing, however, SOEs could be subject to the same quality accounting, disclosure, compliance and auditing standards as listed companies recommended by the OECD Guidelines on Corporate Governance of SOEs (OECD, 2015e). Listing of full groups needs to be preceded by reorganisation in case the company performs social functions and owns non-operational assets to sever the former and strip out the latter (2002 Code of Corporate Governance). Furthermore, enterprises or institutions providing services for the listing company will need to enter into relevant agreements with it in accordance with commercial principles.
Boards can mitigate the agency problem, but even when there are boards they cannot always operate effectively. Indeed, the number of independent directors is often low (around three out of some eight directors) and they are chosen by the company from a SASAC pool, so may not be truly independent. Moreover, the Chair of the Board, who de facto manages the company, is often a civil servant without extensive prior practical experience (Box 1.7). In most OECD countries, there are one to two civil servants on an SOE board, subject to the same fiduciary duties as other board members. Less frequently, such as in New Zealand, civil servants are not allowed to act as board members; moreover all board members need to be independent and selected through a competitive process (OECD, 2016a). Hiring of professional managers is expected to mitigate the agency problem and thus improve corporate performance. While professional managers, including international professionals, are found in many listed subsidiaries of SOEs, their share in the total is still minuscule.
SOEs are in the process of being classified into competitive, monopoly and security-related and public utility/welfare firms. In the future, their performance evaluation will be conducted according to which category they belong to. For enterprises belonging to the competitive category, net profit or other profit-related variables will carry a bigger weight while for other types of enterprises safety indicators, public welfare and similar measures will be more relevant. Firms pursuing public policy objectives have lower return on assets and their profit ratio (profit to costs) has been stable, likely owing to pricing policies (Figure 1.14). Until recently the major performance evaluation indicator SASAC used was gross profit. Accordingly, most of the 100+ central SOE groups set profit as a major objective for themselves and for their subsidiaries. As the results of a survey of these SOE groups carried out for this Economic Survey indicate, other objectives may vary widely depending of the nature of the group’s business. At the group level, many of the objectives are relatively broad and hard to measure such as State building or implementing a State mission, while others are more specific such as increasing the value of State assets, scale and profit growth targets, green production or maintaining or improving Fortune 500 status. Capacity reduction has also been adopted as a new variable to evaluate SOE executives. At the affiliate level, objectives are more specific and related to profit or growth such as return on assets, return on equity, net profit, gross profit, revenue growth, asset growth, market share, production efficiency, safety indicators, new products, leverage or asset turnover.
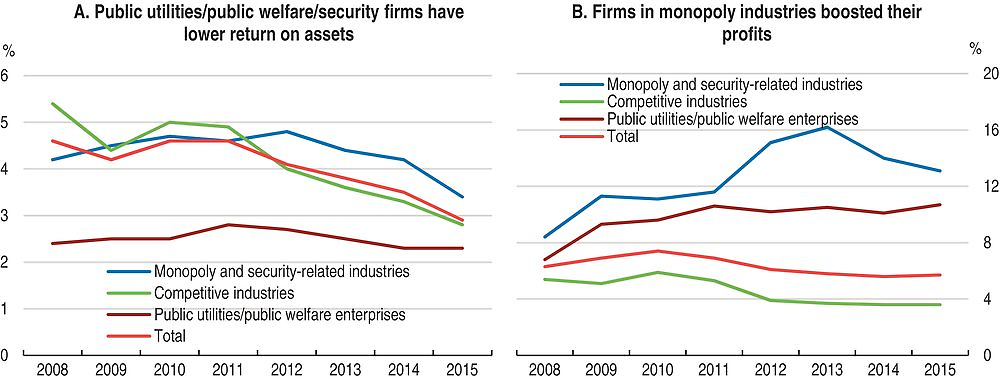
Note: Data include non-financial state-owned or state-controlled enterprises at the central and local levels. Competitive industries include most sectors with competitive markets (shangye yilei or jingzhengxing), monopoly and security-related industries refer to industries with monopolistic or oligopolistic markets and industries related to national security (shangye erlei or longduan) and public utilities/public welfare enterprises primarily pursue public policy objectives (gongyilei or gongyixing).
Source: Ministry of Finance (2014, 2015).
The strengthening of supervision to avoid loss of government assets is mainly being done through fortifying the Party organisation within the company and reinforcing internal and external supervision. Past mechanisms to safeguard government assets, however, did not appear to function well, leading to series of arrests related to State fund embezzlement. Fortifying whistle-blower protection may encourage insiders to report unlawful conduct, including State-asset embezzlement. Moreover they would need to report to an independent investigator body to make such protection meaningful as supervisors and regulators may be subject to capture. In OECD countries independence of investigators is common. People noticing corruption in Australia, for instance, can turn to the Independent Commission Against Corruption.
SOEs pay only limited dividends to shareholders (centrally-owned financial institutions pay none) and the little they pay to their largest shareholder, the State, tends to be recycled back to SOEs through various channels. Currently a five-tier system is applied according to firm type/industry: joint ventures pay 25%, resource-based firms 20%, most other firms pay 15%, public service institutions 10% and some like the company in charge of grain reserves are exempt. In the past, they paid even less: 0% of profits between 1994 and 2007 and 0-10% from 2007 to 2011. Since 2011, they have been paying 5-15% and the target set by the Third Plenum is to increase dividend payments to 30% by 2020, which will be in line with dividend payments in those OECD countries that set explicit targets (OECD, 2014a). Thus dividend payments do not significantly constrain managers’ use of cash flow. Wasting of company revenue is instead being tackled by restricting spending on travel, entertainment or other perks.
Shifting the focus to more actively managing assets (ziben touzi yunying) is considered as a promising way to ensure an increase in the value of State assets. For this purpose specialised companies in charge of both operation and investment of State assets are being proposed. The first pilots, COFCO and China Investment Corporation were designated in July 2014 and the pilot programme was extended to two more enterprises in early 2016 and seven more in July of that year. In July 2016 a company managing coal reserves was established jointly with coal-making central SOEs under SASAC. Capital management and investment companies are organised on a sectoral basis, though not necessarily with one per sector. SASAC has delegated some important powers to them such as long-term development and annual investment planning, staffing and in the case of COFCO, also reallocation or disposal of assets.
Renewed efforts to fix SOEs are under way
Consolidation (Box 1.9) is expected by policymakers to drive efficiency gains, the major challenge remaining how to ensure that merging inefficient groups will result in higher efficiency. Horizontal mergers may lead to economies of scale in production, but central conglomerates are already sizeable enough alone, so it is less likely that small scale was their problem. Horizontal mergers can be harmful to competition as they reduce the number of competitors. Vertical mergers can be harmful to competition as they hinder the entry of competitors at various stages along the production chain. The effect of mergers on competition needs to be assessed by competition authorities before they are approved.
Following the State Council’s Guidelines on Deepening SOE Reforms released in September 2015, the Guiding Opinion on Promoting Structural Adjustment and Restructuring of Central SOEs was issued in July 2016, which aims at clarifying central SOEs’ strategic position, ensuring their effective functioning, improving their overall structure, significantly boosting the allocative efficiency of state assets and forming a group of innovative and internationally competitive firms.
Restructuring of conglomerates picked up in the first half of 2016. The aim is to bring down the number of groups from around 110 to below 100 by end-2016. Four routes have been identified to handle central SOEs: i) strengthening; ii) reinventing and developing; iii) restructuring; and iv) exit.
In the restructuring process, alliances among conglomerates in the equipment manufacturing, construction, steel, non-ferrous metals, air transport, tourism and air service industries will be promoted. In particular, vertical integration along the supply chain is encouraged. Pilot conglomerate-pairs are already being implemented, such as the acquisition of China Huafu Trade & Development Group Corp. by COFCO Group, where COFCO with strong up- and downstream businesses benefits from Huafu’s midstream liqueur-manufacturing business.
The reorganisation wave goes in the direction of specialisation. Resources are expected to flow to more efficient firms through asset restructuring, asset swap, non-remunerated asset transfer, strategic alliances, joint development, etc. The Guidelines encourage enterprise groups in energy, automobile, new materials, new energy, oil and gas pipelines, marine equipment, air cargo, etc. to set up jointly-owned shareholding platforms.
In addition, the Guiding Opinion calls for accelerating the consolidation of intra-firm resources in the specialisation-driven consolidation wave via capital injections and restructuring of operations.
Another important direction is reducing the number of governance levels and absorbing firms from the fifth affiliate level downwards so that investment decisions are concentrated at the third level and above.
A fourth measure advocated by the Guiding Principles is M&As. Here higher market concentration is seen as facilitating access to key technologies, core resources and marketing channels.
The Guiding Principles also touch upon the exit mechanism. First of all obsolete and excessive capacity needs to be cut in steel, coal and other industries. The next targets are loss-making firms with grim prospects for turnaround in the coming two years and finally inefficient firms. In the following three years SASAC plans to handle 345 zombie enterprises.
Getting rid of non-core activities and assets through liquidation is encouraged to enhance efficiency. In addition, social functions and legacy-related obligations (medical, education, civil affairs, fire prevention, residential management. Services and the like) will also be taken off firms’ shoulders.
Source: Guiding Opinion on Promoting Structural Adjustment and Restructuring of Central SOEs, 26 July 2016.
Between 2012 and 2015, central SOEs controlled by SASAC shed assets worth CNY 108 billion, equivalent to 1.6% of their total assets in 2015. Stripping off assets is quite complicated as the suspicion of State asset embezzlement always looms large. Social functions still constitute a significant burden for SOEs. The pilot reform of central SOEs in Heilongjiang starting in 2011 to strip off public utility functions (water, electricity, heating and building management services) was extended to more provinces in 2012 and the whole country in 2016, though it only covers those functions. In addition to public utilities, SOEs also control hospitals and other public service providers.
Employee shareholding is now being made possible, though only in enterprises in competitive industries and only in affiliates at third tier level or below. Employees can buy up to 1% of the shares each or 30% of the shares jointly, but at a minimum 34% must remain in State hands. Not all employees, but mainly executives and persons in technology development, strategic decision making and other key positions are targeted as a way to enhance incentives. Managers with administrative rank cannot hold shares. While the ownership of shares increases commitment to the enterprise, the stringent conditions to dispose those shares are likely to lock up professional or management staff, decreasing overall efficiency. Also, management’s bargaining power may increase towards staff that invested heavily in the firm’s shares.
Reform measures and proposals are plentiful, often with ambitious targets. The success of reforms should be judged by how much SOEs improve their profitability, innovation capabilities and ability to compete in a level playing field.
Key recommendations
-
Strengthen intellectual property right protection by more systematically prosecuting violators and raising fines. Broaden the number of sectors benefiting from government support for innovation.
-
Require the regular publication of company accounts and enhance disclosure standards for all firms. Raise penalties for individuals committing fraud.
-
Gradually remove implicit guarantees to SOEs and other public entities to reduce contingent liabilities. Reduce state ownership in commercially oriented, non-strategic sectors. Let unviable SOEs go bankrupt, notably in sectors suffering from overcapacity. Professionalise the state ownership system to make a clear division between business and politics. Strengthen the independence and decision-making role of the board by hiring truly independent directors and giving it authority to appoint and evaluate management as well as to decide management salaries and promotion. Where possible carry out social functions separately from commercial operations to boost the efficiency of the latter.
Further recommendations
Fostering innovation
-
Streamline the innovation policy system to better serve prospective innovators, enhance coordination across agencies in charge of implementing innovation policies and to avoid duplication.
-
Enhance the screening of patent applications to avoid perverse incentives and congestion costs at handling institutions.
-
Increase public spending on basic research, financed partly by economising on inefficient subsidies through better screening.
-
Mandate the sharing of internet platforms to foster the commercialisation of computer applications.
-
Further reduce the costs of doing business by increasing firm disclosure, extending one-stop shops to the whole country, making the negative list for entry as short as possible and boosting internet speed while reducing its costs.
-
Incorporate achievements of civil servants and academics on leave in their performance evaluations to encourage more academics and civil servants to temporarily engage in innovative activities.
-
Accelerate the bankruptcy process to reduce uncertainty and compensate the laid-off according to relevant laws.
-
Remove other barriers to exit such as subsidies, environmental clean-up costs and social liabilities, notably in sectors affected by excess capacity, thus facilitating the reallocation of resources from less efficient to more productive uses. The removal of subsidies could partly finance clean-up costs and social liabilities.
Improving corporate governance
-
Implement the registration-based system for stock-market flotations and streamline de-listing procedures.
-
Enhance board independence by ensuring that independent directors are not influenced by the controlling shareholder or others. Boards should declare who they consider to be independent and the criterion for this judgement.
Reforming SOEs
-
Categorise SOEs according to their degree of commercial/social orientation.
-
Strengthen whistle-blower protection to encourage reporting of unlawful conduct to investigators, who should be independent.
Bibliography
Adalet McGowan, M., D. Andrews and V. Millot (2017), “The walking dead? Zombie firms and productivity performance in OECD countries”, OECD Economics Department Working Papers, No. 1372.
Boeing, P., E. Mueller and P. Sandner (2016), “China’s R&D explosion – Analysing productivity effects across ownership types and over time”, Research Policy, Vol. 45.
Cao, K., X. Zhou and Y. Wang (2016), “Caizheng keji zhichu shifou youzhuyu jishu chuangxin – Yige shizheng jianyan” in Chinese (Does public finance expenditure in science and technology contribute to technological innovation), Research on Economics and Management, Vol. 37(4).
Chen, T. (2015), “Institutions, board structure and corporate performance: Evidence from Chinese firms”, Journal of Corporate Finance, Vol. 32.
Dang, J. and K. Motohashi (2015), “Patent statistics: A good indicator for innovation in China? Patent subsidy program impacts on patent quality”, China Economic Review, Vol. 35.
Dourado, E. and A. Tabarrok (2015), “Public choice perspectives on intellectual property”, Public Choice, Vol. 163.
European Chamber of Commerce (2016), European business in China Position Paper 2016/2017.
Firth, M., T.Y. Leung, O.M. Rui and C. Na (2015), “Relative pay and its effects on firm efficiency in a transitional economy”, Journal of Economic Behavior and Organization, Vol. 110.
Guo, D., Y. Guo and K. Jiang (2016), “Government-subsidised R&D and firm innovation: Evidence from China”, Research Policy, Vol. 45.
He, Y., Y. Chiu and B. Zhang (2015), “The Impact of corporate governance on state-owned and non-state-owned firms’ efficiency in China”, North American Journal of Economics and Finance, Vol. 33.
Hu, A. and G.H. Jefferson (2009), “The Great Wall of patents – What is behind China’s recent patent explosion?”, Journal of Development Economics, Vol. 90(1).
Huang, W. and T. Zhu (2015), “Foreign institutional investors and corporate governance in emerging markets: Evidence of a split-share structure reform in China”, Journal of Corporate Finance, Vol. 32.
Ito, A., Z. Li and M. Wang (2014), “What types of science and technology policies stimulate innovation? Evidence from Chinese firm-level data”, RIETI Discussion Paper Series, 14-E-056.
Jiang, F. and K.A. Kim (2015), “Corporate governance in China: A modern perspective”, Journal of Corporate Finance, Vol. 32, June.
Jiang, G.H., P.G. Rao and H. Yue (2015), “Tunnelling through non-operational fund occupancy: An investigation based on officially identified activities”, Journal of Corporate Finance, Vol. 32, June.
Lin, Y., Y. Qin and Z. Xie (2015), “International technology transfer and domestic innovation: Evidence from the high-speed rail sector in China”, Centre for Economic Performance Discussion Papers, No. 1393.
Liu, Y., M.K. Miletkov, Z. Wei and T. Yang (2015), “Board independence and firm performance in China”, Journal of Corporate Finance, Vol. 30.
McKinsey Global Institute (2015), The China Effect on Global Innovation.
Miles, L. and M. He (2005), “Protecting the rights and interests of minorities shareholders in listed companies in China: Challenge for the future”, International Company and Commercial Law Review, Vol. 16.
Ministry of Finance (2015), Qiye Caiwu Baobiao – Shuju Zhaiyao, in Chinese (Survey of Enterprise Financial Reports Nationwide), Zhongguo Caizheng Jingji Chubanshe.
Ministry of Finance (2014), Qiye Caiwu Baobiao – Shuju Zhaiyao, in Chinese (Survey of Enterprise Financial Reports Nationwide), Zhongguo Caizheng Jingji Chubanshe.
Molnar, M., W. Chen and B. Wang (2017), “Corporate governance and firm performance in China”, OECD Economics Department Working Paper, forthcoming.
National Academy of Development and Strategy of Renmin University (2016), “Zhongguo jiangshi qiye yanjiu baogao – Xianzhuang, yuanyin he duice” in Chinese (Research report on zombie companies in China – Current state, background and policy remedy), Niandu Yanjiu Baogao (Annual Research Report), Vol. 9.
NDRC (2016), 2015 Nian zhongguo dazhong chuangye wanzhong chuangxin baogao, in Chinese, 2015 China entrepreneurship and innovation report, Renmin Publishing.
OECD (2017), The Next Production Revolution: Implications for Government and Business, OECD Publishing, Paris, forthcoming.
OECD (2016a), Broadening the Ownership of State-Owned Enterprises- A Comparison of Governance Practices, OECD Publishing, Paris.
OECD (2016b), Governments as Competitors in the Global Marketplace: Options for Ensuring a Level Playing Field, OECD Publishing, Paris.
OECD (2015a), Excess Capacity in the Global Steel Industry and the Implication of New Investment Projects, OECD Publishing, Paris.
OECD (2015b), G20/OECD Principles of Corporate Governance, OECD Publishing, Paris.
OECD (2015c), “Growth companies, access to capital markets and corporate governance”, OECD report to G20 Finance Ministers and Central Bank Governors available at www.oecd.org/ g20/topics/framework-strong-sustainable-balanced-growth/OECD-Growth-Companies-Access-to-Capital-Markets-and-Corporate-Governance.pdf accessed on 18 October, 2016.
OECD (2015d), OECD Economic Surveys: China 2015, OECD Publishing, Paris.
OECD (2015e), OECD Guidelines on Corporate Governance of State-Owned Enterprises, OECD Publishing, Paris.
OECD (2015f), Science, Technology and Industry Scoreboard, OECD Publishing, Paris.
OECD (2014a), Financing State-Owned Enterprises: An Overview of National Practices, OECD Publishing, Paris.
OECD (2014b), Perspectives on Global Development, OECD Publishing, Paris.
OECD (2014c), Public Enforcement and Corporate Governance in Asia – Guidance and Good Practices, OECD Publishing, Paris.
OECD (2013), Better Policies for Board Nomination and Election in Asia, OECD Publishing, Paris.
OECD (2011), Corporate Governance of Listed Companies in China – Self-Assessment by the China Securities Regulatory Commission, OECD Publishing, Paris.
OECD (2008), OECD Reviews of Innovation Policy – China, OECD Publishing, Paris.
Ou, G., Q. Yang and L. Lei (2014), “Gaoxinqu jiqun xietiao chuangxin xitong neisheng gongneng yu waixian nengli guanlian pingjia yanjiu” in Chinese (“Evaluation research of relations between inputs and outputs in high-tech zone innovation clusters”, Keji jinbu yu duice (Science & Technology Progress and Policy), Vol. 31(19).
SASAC Research Centre (2016), Guanyu shenhua guoyou qiye gaigede zhidao yijian – Baiti wenda, in Chinese (Guiding opinion on deepening SOE reform – One hundred questions and answers), China Economic Publishing House.
Prodi, G., F. Frattini and F. Nicolli (2016), “Regional innovation systems in China: A long-term perspective based on patent data at the prefectural level”, Sustainability Environmental Economics and Dynamics Studies Working Paper Series, 03/2016.
Shapiro, D., Y. Tang, M. Wang and W. Zhang (2015), “The effects of corporate governance and ownership on the innovation performance of Chinese SMEs”, Journal of Chinese Economic and Business Studies, Vol. 13, No. 4.
Shi, C. (2007), “Protecting investors of China through multiple regulatory mechanisms and effective enforcement”, Arizona Journal of International and Comparative Law, Vol. 24.
Sun, J. and Z. Liu (2014), “Gaoxin jishu chanye jilü xiaoguo de shizheng yanjiu – Yi Zhongguo gaoxinqu zhengce wei li”, in Chinese (An empirical study on the effect of the high-tech industry agglomeration – Through the example of China’s high-tech zone policies), Ruan Kexue (Soft Science), Vol. 28(2).
Sun, Y. and C. Cao (2014), “Demystifying central government spending in China – Should funding focus on scientific research?”, Science, Vol. 345(6200).
State Intellectual Property Office (SIPO) (2016), 2016 Nian quanguo zhuanli diaocha jichu shuju baogao, i n Chinese (2016 National patent survey basic data report).
State Intellectual Property Office (SIPO) (2015), 2014 Nian Zhongguo zhuanli diaocha baogao, in Chinese (2014 China patent survey report).
Supreme People’s Court of the PRC (2016), The Work of China’s Courts 2015.
Wei, S.J., Z. Xie and X. Zhang (2016), “From ‘Made in China’ to ‘Innovated in China’: Necessity, prospects, and challenges”, NBER Working Paper Series, No. 22854.
Xiao, Y. (2016), Guoziwei zhuren gei Renda daibiao changweihui de gongzuo baogao, in Chinese (Working Report by SASAC’s Chairman to the Standing Committee of the People’s Representatives) on July 30.
Xiao, Y., A. Tylecote and J. Liu (2013), “Why not greater catch-up by Chinese firms? – The impact of IPR, corporate governance and technology intensity on late-comer strategies”, Research Policy, Vol. 42(3).
Yang, J. (2005), “Comparative corporate governance: reforming Chinese corporate governance”, International Company and Commercial Law Review, Vol. 16.
Ye, K., J. Zhu, Z. Lu and R. Zhang (2011), “Duli dongshi de dulixing jiyu dongshihui toupiaode zhengju” in Chinese, The independence of independent directors:Evidence from board voting behavior, Jingji Yanjiu (Economic Research Journal), Vol. 2011(1).
Zhao, W. (2015), “Is R&D upgrading China from imitation to innovation? An institutional analysis of absorptive capacity”, Transition Studies Review, Vol. 22(2).
Zhao, W., R. Arvantis and F. La Pira (2011), “Innovation policy and local cluster of entrepreneurs in South China”, International Journal of Management and Enterprise Development, Vol. 11.
Zhou, T. (2014), “Legal regulation of China’s securities markets – Recent improvements and competing advantages” in M. Faure and G. Xu (eds.), Economics and Regulation in China, Routledge.
← 1. The statistical data for Israel are supplied by and under the responsibility of the relevant Israeli authorities. The use of such data by the OECD is without prejudice to the status of the Golan Heights, East Jerusalem and Israeli settlements in the West Bank under the terms of international law.